Quickstart
Items covered in this section:
What Timing Solution Does
Timing Solution software works with market data. It analyzes price history data using a variety of methods in an attempt to predict possible future market moves. Timing Solution achieves this by creating a projection line, it is the main goal of the software. The program's tools are focused on generating and verifying a projection line.
There are many methods for generation of the projection line. They range from basic statistical analysis techniques to more complex methods including cyclical analysis and astronomy, fuzzy logic and neural networks and also our "know-how" techniques. New methods are constantly added after thorough testing, so the variety of tools at your disposal is continuously growing.
In this section you will get familiar with the basics of Timing Solution software and will learn how to create the simplest projection line using the most common techniques available.
Getting Started
When you run Timing Solution, the first window that appears has a number of options for you to assist with the software. There are links for help, troubleshooting, and updates to the program:
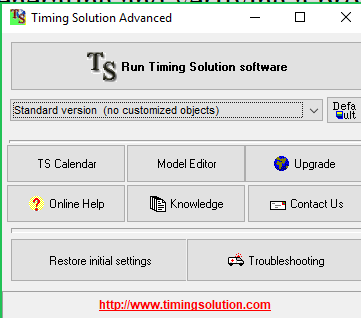
There are also utilities like TS Calendar and Model Editor; that will be discussed in later chapters.
Once you run the software by clicking
 button, the
program performs some initial calculations:
button, the
program performs some initial calculations:
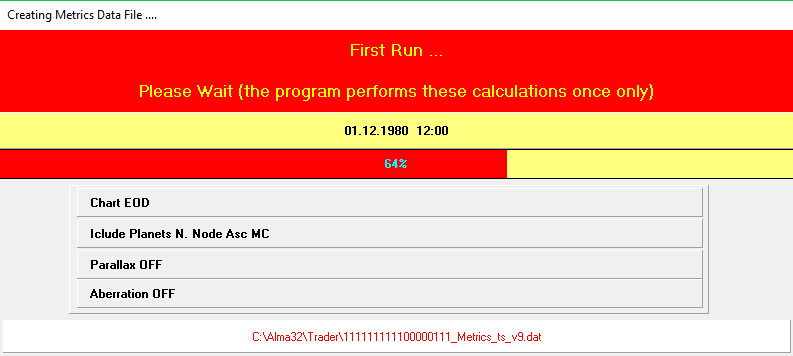
These are one time calculations; i.e. they are performed when you run Timing Solution for the first time. These calculations allow to speed up further calculations significantly and to draw very complicated astronomically based charting tools fantastically fast.
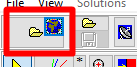
The layout of the interface is described in the image below. It is organized by general purpose of each button. For beginners, the sets of buttons that you should be looking at are:
- Downloading price chart;
- Manipulating price chart;
- Three of the most important forecast modules,
- Other features (including Charting tools, Natural cycles, some TA indicators) that will be discussed in details later.
The labels below show groups of buttons related to some theme:
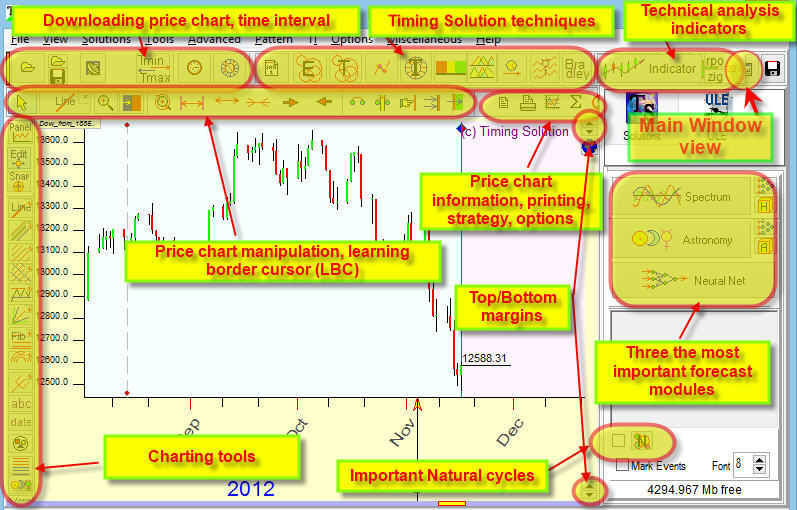
When you open the software, the center of this Window is empty, and buttons are not available. To activate them, the price data must be downloaded first.
Instructions for Mac Users
1) Installation: The program is written for Windows operating system. Please make sure that it is possible to run Windows applications with your MAC. You need to have installed Windows emulator for MAC. The most used Windows emulators for MAC are:
Parallels
VWMware Fusion
CrossOver
2) Right mouse button issue: One issue with MAC is the usage of RIGHT mouse button. The issue appears due to the different logics of Mac system. To solve this problem, it is recommended to use "Shift" key on the keyboard. For example, you would like to magnify a piece of the price chart. The standard way is: move the cursor to the beginning of the interval, press the right mouse button, then drag the mouse cursor keeping the right mouse button pressed. The same operation for Mac users is: press Shift key on your keyboard and do the same, keeping the LEFT mouse button pressed. (Instead of right mouse button, you use the left mouse button and Shift key.)
Another issue appears when opening the pop-up menu. On PC you would click the right mouse button on the price chart. Mac users would click left mouse button while Shift key is pressed. To activate this option follow menu "OPtions"-"Timing Solution OPtions" and set there option "This is MAC" ON
Downloading price history data
Timing Solution analyzes historical market data using a variety of methods in order to generate a projection line for the future. Therefore, the very first step in any calculation is opening relevant market data for the program to use.
This is achieved by clicking on the
 button.
This window appears:
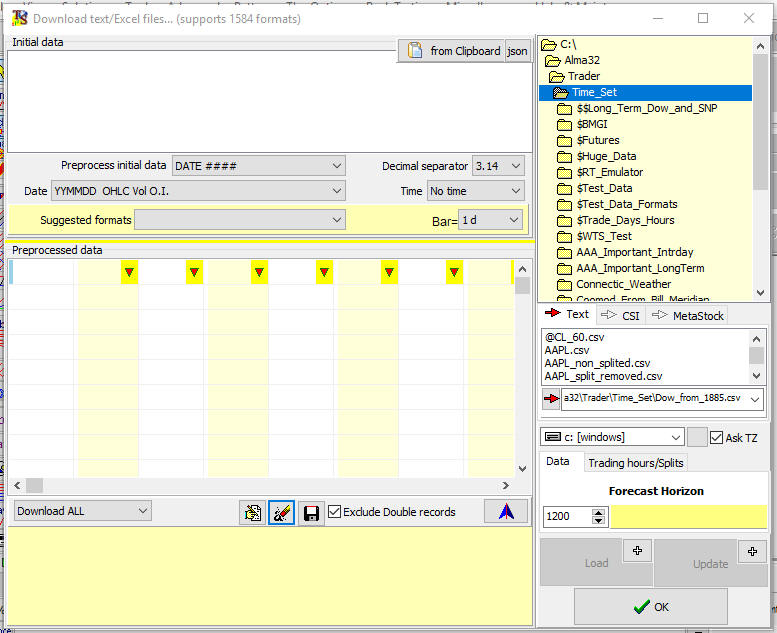
Here you can select a file with your market data. There are several files in this folder with market data from open sources. You may add your own data files here as well. Timing Solution supports thousands of different data formats. Therefore you can obtain market information from multiple sources, and the program most likely will be able to read it.
While you choose the data file you want to download, the program automatically searches the most probable date format (mm/dd/yyyy, or dd/mm/yyyy, or mmddyyyy, or something else). Click "Load" button to preview the data and then click "OK" to download the price history into Timing Solution:
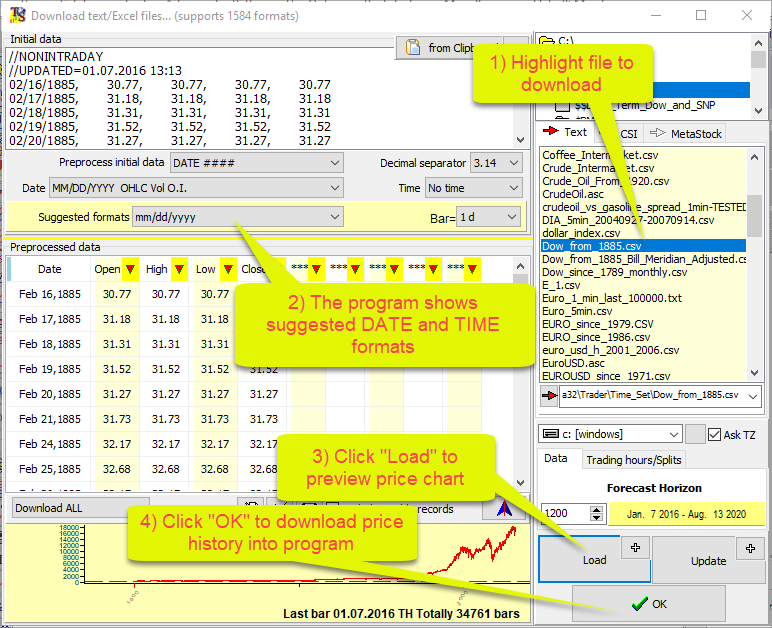
This window allows you to manipulate the original data to some extent. For example, you can handle splits in the data, or you can try to fix corrupted records. All of these features will be discussed further in the following lesson. For now, you can select the relevant data file, click "Load" to preview it, and click "OK" to load it into the program.
You can download market data directly from the Internet (without previously saving that to some file). This is the button to do that ("Download through Internet" button):
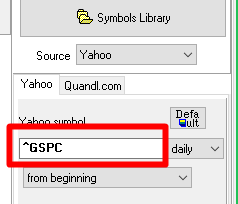
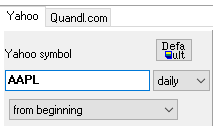
or to download Apple price quote from Yahoo, type AAPL:
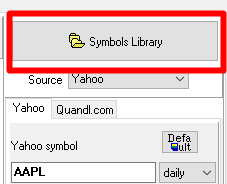
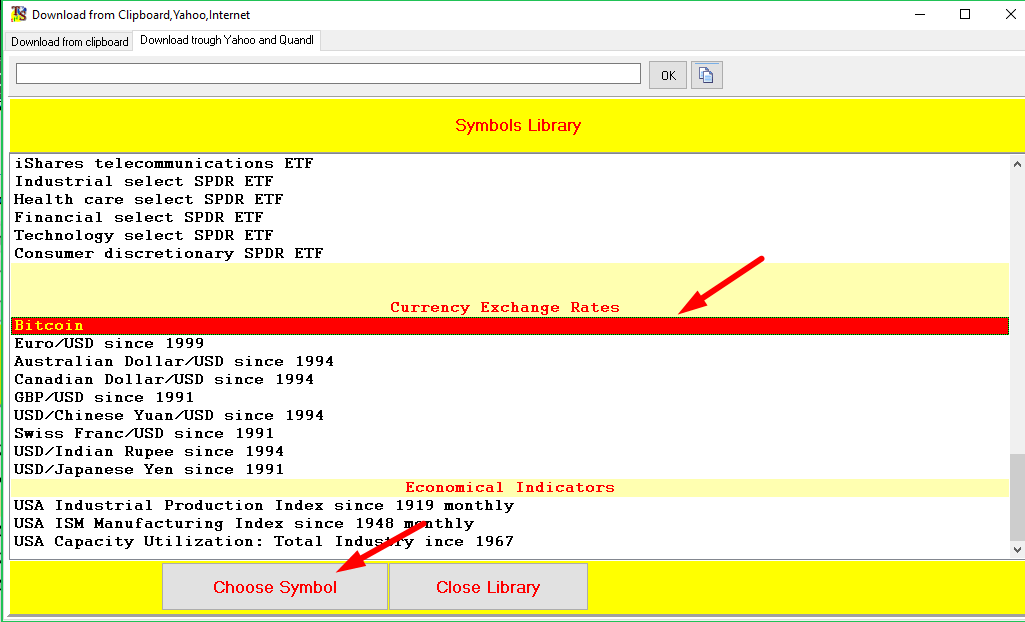
Or you can choose an item from Symbols Library:
If you select one from the library, the program automatically determines whether to download it from Yahoo or Quandl servers.
Both services, Yahoo and Quandl, provide data in JSON, so to use these services you have to install JSON viewer before the first downloading. You can do it by clicking this button:
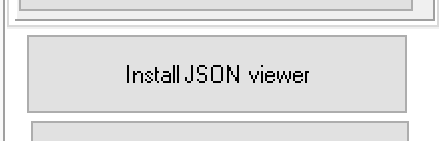
Also the program automatically installs JSON viewer when you first download the price data.
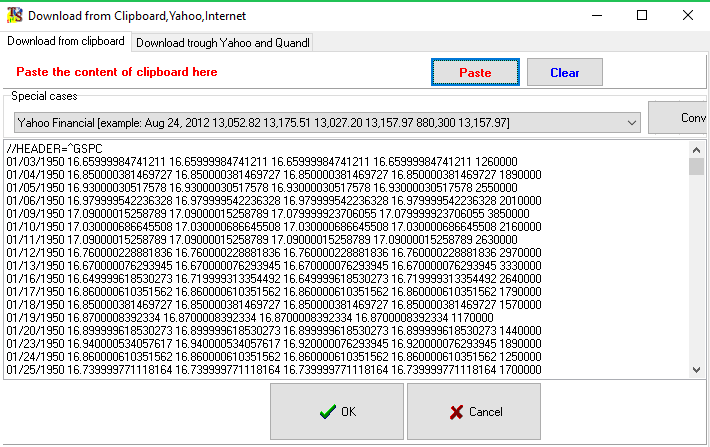
Now you can click "Download Data" button to get the data from these services. Raw data is shown in the next window:
Now you have the market data to work with. The next step is to learn how to manipulate the charts, so you can focus on specific areas of the downloaded data.
Price Chart Manipulation
The chart manipulation tools are located on the second bar from the top:
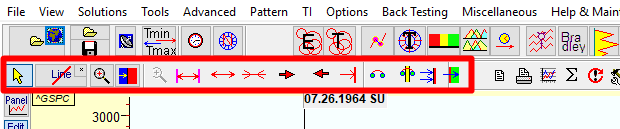
No matter what module you use, you need to orient yourself effectively around the price chart, therefore the buttons of this bar will be discussed in further detail below:
 The first button is your standard cursor button. It reverts the left mouse button (LMB) to its standard function.
 This button allows
to zoom in on the price chart using the LMB. This function is mainly reserved for the right mouse button.
In other words, you can select a piece of the price chart using RIGHT
mouse button. If you need, you can select this button to zoom in using the LMB
(LEFT mouse button).
This button allows
to zoom in on the price chart using the LMB. This function is mainly reserved for the right mouse button.
In other words, you can select a piece of the price chart using RIGHT
mouse button. If you need, you can select this button to zoom in using the LMB
(LEFT mouse button).
 The next button sets the Learning Border Cursor (LBC). This function is very important for testing any of the modules. When you set the LBC, the program uses price data UP TO that point for its calculations. This is very useful when testing your projection line. This button is a very important feature of Timing Solution and you can read more about it here.
For example: If you want to check how the price of gold will behave in 2018, you can set the LBC to January 2017. Then you can use any method you like to generate a projection line. Timing Solution does its calculations using market data up to January 2017 and generates a projection line. This allows you to compare the created projection line to the actual price movement of gold in 2017. It helps you in determining whether this particular method is useful in your prediction of the gold price movement in 2018.
 The next button is the un-magnify button. It zooms out the price chart to your previous zoom level. For example, if you have zoomed in on the last quarter of a price chart and then zoomed in again on the last few bars of the chart, clicking on this button returns you to the view of the last quarter of the price chart. It is essentially an undo button for
a zoom function.
The next button is the un-magnify button. It zooms out the price chart to your previous zoom level. For example, if you have zoomed in on the last quarter of a price chart and then zoomed in again on the last few bars of the chart, clicking on this button returns you to the view of the last quarter of the price chart. It is essentially an undo button for
a zoom function.
All the buttons and features related to price chart manipulations will be discussed in the next lesson.
Introduction to the three most used modules of Timing Solution
Now you know how to obtain the price data and how to orient yourself around it, and you can try to build your first projection line using the most common forecast modules.
Spectrum Module
The underlying idea of Spectrum module is that the stock market is moved by fixed math cycles. As an example, it may be 57 days or 120 days cycles. Spectrum module is exploring this idea. It provides the answer to the question "what cycles are relevant to the financial instrument we are working with". Instead of guessing or trusting some source of information, you can find it with Spectrum. It is quick and easy.
Click on "Spectrum" button. The program starts its calculations. Once they are done, it opens Spectrum Analyzer window:
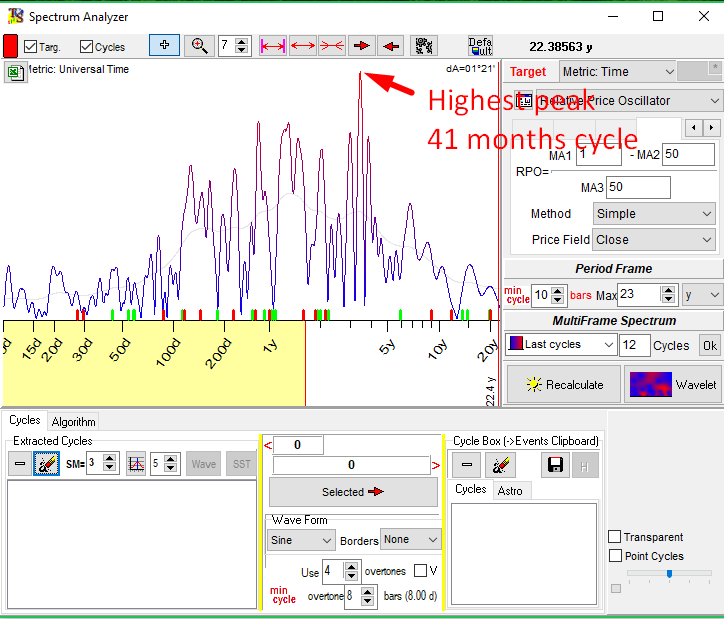
The main chart you see here depicts all cycles that have been calculated. The higher the peak on this chart, the better this cycle fits the price chart. Take it as a cyclical portrait of your financial instrument.
The example above shows that the highest peak for a chosen set of data corresponds to 41 months cycle. (By the way, this is a well known Kitchen economical cycle.) Once a specific cylce is selected, a question arises: how well has it worked in the past? It is important to know as we want to make a projection line based on this cycle. In order to do that move the mouse cursor to 41 months peak and make the left mouse click there. The vertical line appears. It marks the cycle. You can see a projection line based on it in the Main window:

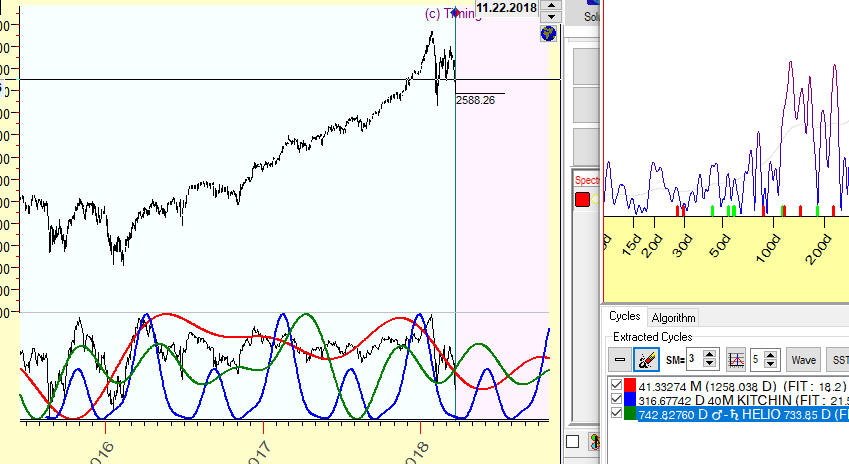
You can select as many cycles as you want; and they all will be displayed on the Main Timing Solution window as separate projection lines of different colors. You can see parameters of each cycle and how well it fits your price chart in the lower part of the Spectrum Analyzer window:
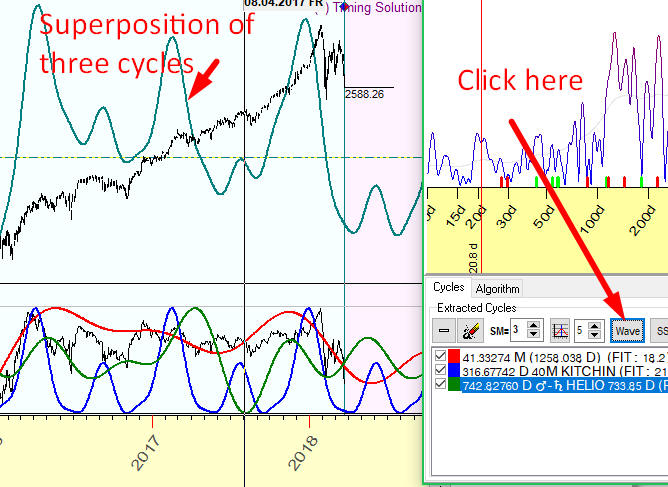
Also you can calculate a superposition of these chosen cycles (three in the example) by clicking on "Wave" button. The resulting projection line appears in the Main screen:
To keep the results of your work, you should minimize the Spectrum Window. Closing the window will delete the projection lines that have been generated, and you will have to start over in creating these lines.
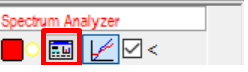
You can recall the Spectrum Analyzer Window any time by clicking on this button:
The button next to it gives you a possibility to see in the Main window the initial price chart and projection lines with a target either on separate panels or overlaying each other.
Finally the checkbox to the right of the "Separate Panel" button toggles the display of the projection line.
The Spectrum Analyzer will be discussed in greater detail in later lessons.
Astronomy Module
The next commonly used module is the Astronomy Module (or Composite). The underlying idea of this module is that fixed math cycles are not the only cycles that have some influence on stock market behavior. Astronomical cycles do that too. Think about seasonal patterns; they are an evidence of Annual cycle's effect on the stock market. There are many other astronomically based cycles - like 29.53 days Moon synodic (phases) cycle, 88 days Mercury heliocentric cycle, 584 days Venus synodic cycle etc. It is known that Annual cycle works for stocks, but not many traders know that Venus synodic cycle works for Forex market. Astronomical cycles do prove themselves being useful in forecasting of market moves.
The Main difference between astronomical and regular (fixed) math cycles is that astronomical cycles are irregular due to an irregularity of planetary movements. Timing Solution software gives a possibility to work with these cycles. You can do that in Astronomy Module.
This module calculates cycles based on the relative position of astronomical bodies and/or angular separation between planets and creates projection lines based on these cycles.
There are many features in this module. All of them will be discussed in detail in later lessons.
To start, we suggest to work with Annual cycle (which reflects the price movement in respect to the Sun passing through Zodiac signs).
This window appears when you open the module:
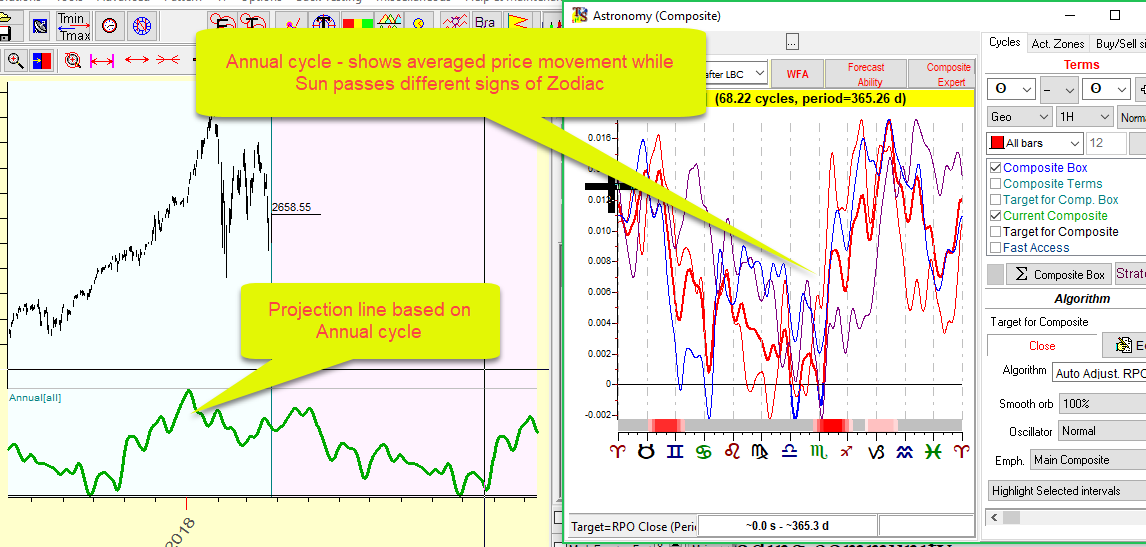
You can see the Annual cycle immediately after opening the Astronomy module. The cycle's settings are there by default.
The thick line represents the Annual cycle calculated for your financial instrument using all downloaded price history, while other lines show that same Annual cycle calculated for different time periods of data.
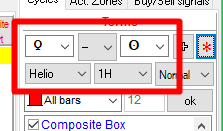
You may try to do the same for the Moon and the planets or explore the price movement in relation to the angle separation between the planets. To do that, there are two drop down menus in the top right corner.
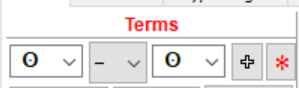
These menus allow to select specific astronomical bodies. If both menus have the same body selected, then the chart shows the average price movement in respect to that astronomical body's passage through Zodiac signs. If two different bodies are selected in the menus (e.g. the Sun and the Moon), then the chart shows the average price movement in relation to angular separation between these two bodies:
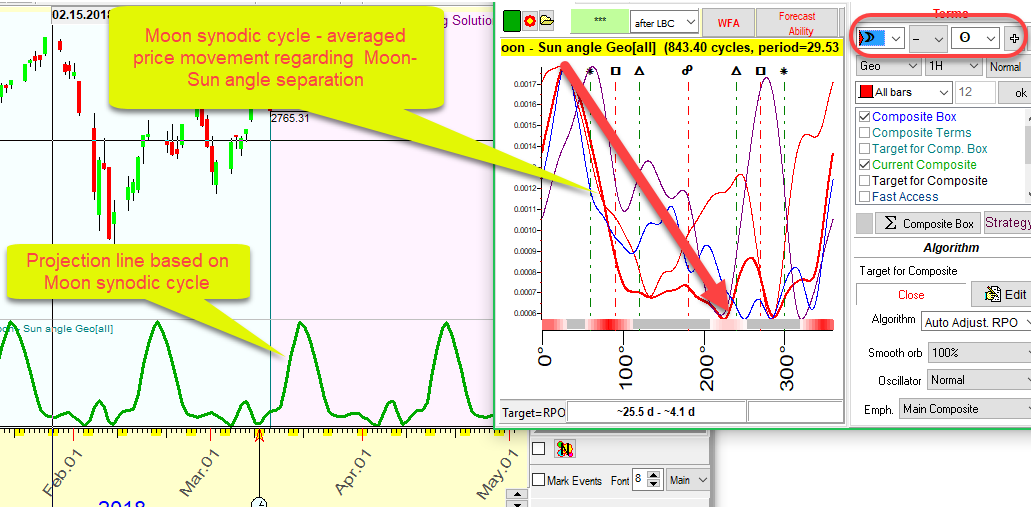
The composite diagram shows that price tends to go down when Moon-Sun angle separation changes between 25-230 degrees, it corresponds to the period 2 days - 18 days after the New Moon.
You can also select different coordinate systems (Zodiacs) just below the drop down menus. The default zodiac is Geo, and you can select a variety of them. For example, Venus synodic cycle is Venus-Sun angle in the heliocentric Zodiac:
Once done selecting different cycles, make sure to minimize the Astronomy window in order to save your work and switch to the Main window. Closing it will delete all of your work just like in the Spectrum module.
Neural Net Module
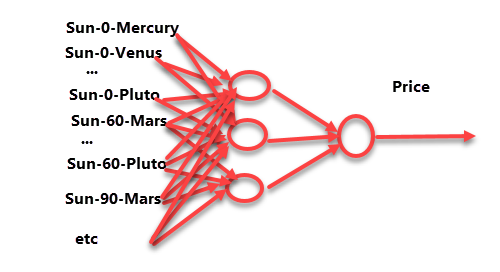
The third commonly used module is a Neural Net Module (NN). (It is not available in Timing Solution Primo version.) Generally speaking, Neural Net is a mathematical structure that may be applied for the process of forecasting. There are two main things that you should remember about Neural Nets: what you would like to forecast - outputs, and what you use for that - inputs. Neural Net conducts learning procedure trying to "cook" price (i.e. output) from inputs events. In this section we will build NN that forecasts price (the output) using transiting aspects between planets (inputs). This is the NN's scheme:
Click on Neural Net button. The following window appears:
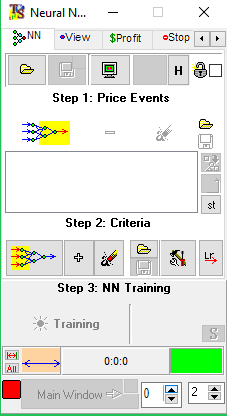
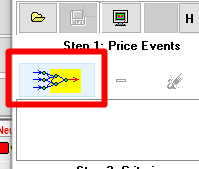
The first step you should do is to select what you would like to forecast. This is done by clicking the "Price Events Master" button:
Once there, you can define what you want the Neural Net to use as the output. One of the selections is Relative Price Oscillator. With it, the program attempts to forecast the future price oscillations, but not the general trend (which is an overall up or down movement of market).
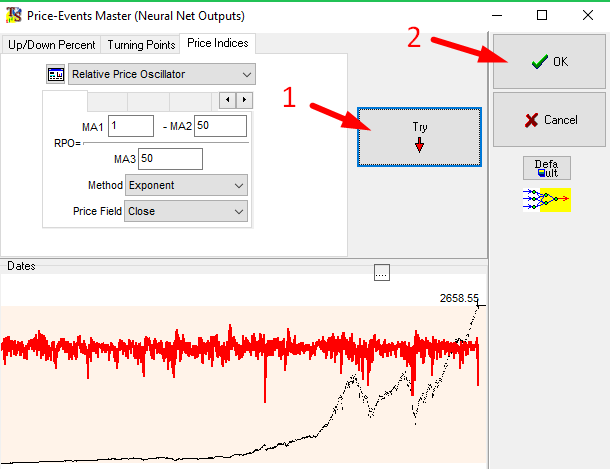
Clicking on "Try" button gives you a quick view of what the new result will look like, and clicking OK finishes Step 1.
Now you should select the criteria for Neural Net learning. This is Step 2 Think of it as trying to predict the weather: For a better forecast, you need more variables to include in the calculations such as air temperature, pressure, humidity etc. The same is happening here. Let us look at variables you may use for these calculations.
The first button
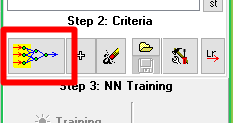
allows to choose the criteria manually. Its window is shown below:
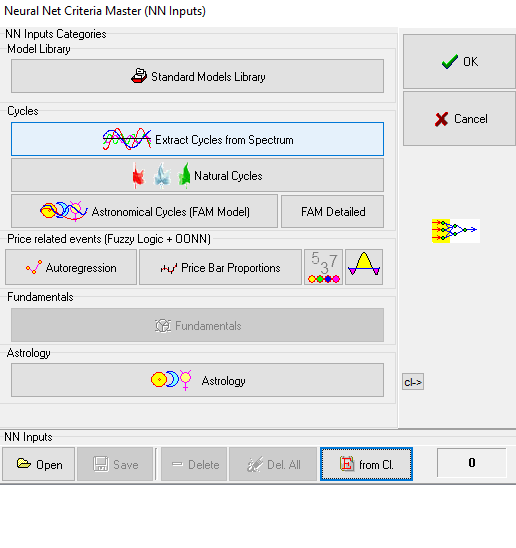
Or you can use a set of criteria already organized in the model window. That is done by clicking the "+" button. The popup menu shows a list of predefined models:
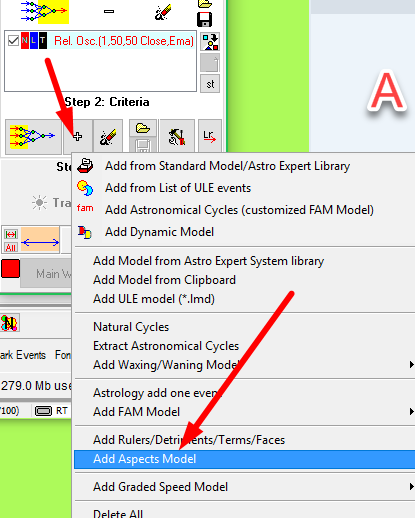
Choose "Add Aspects Model" item:
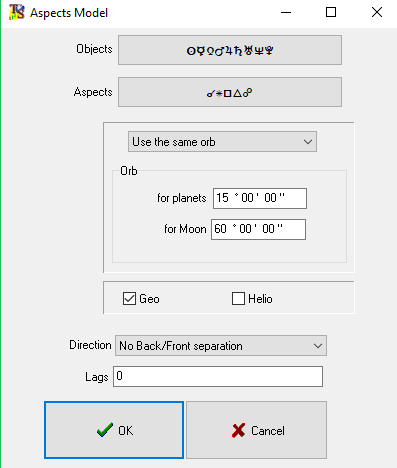
Here you may set the planets that form the aspects, aspects values, orb, Zodiac type (Geo or Heliocentric). Also you can analyze back and front aspects separately.
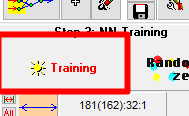
After selecting the criteria (inputs), you can train the Neural Net in Step 3. If the two previous steps are complete, then this button becomes available:
Clicking it starts the training of the Neural Net. The resulting projection line is updated after a completion of the specific number of steps. The calculations continue until the process is stopped; the amount of cycles processed is displayed in the green field on the NN Module window:
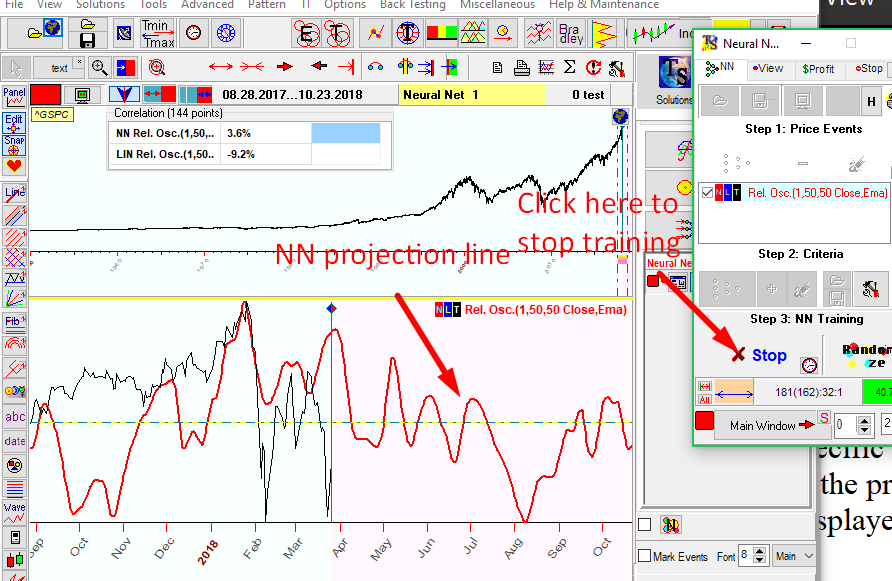
When the amount of steps is low, the projection line is not precise, and the program needs more training to refine its forecast. However if the number of steps becomes too large, the projection line becomes less accurate as well. This condition is called overtraining, and the process should be stopped before this condition is reached. Generally, when the projection line does not change much with each update, then the training process should be stopped.
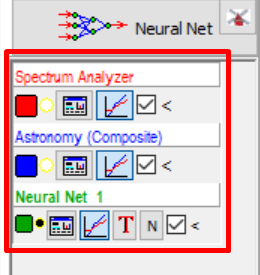
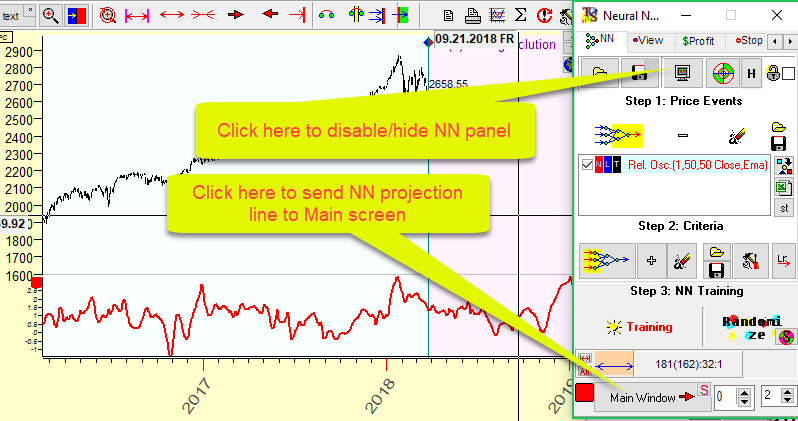
Finally, once training is stopped, you should click the "Enable/Disable NN Results Panel" and "Main Window" buttons:
There is more to learn about the Neural Net in Timing Solution. It will be discussed in later lessons.
Useful tips
Tip #1:
Pay attention to the numbers at the bottom of the Main Window:
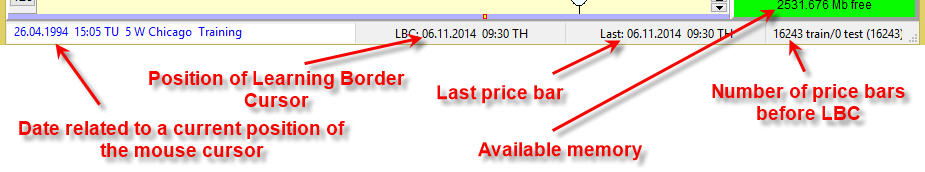
They are important. The date related to a current position of the mouse cursor is changing when you move the mouse across the screen. Also, you can see the date of the position of Learning Border Cursor (LBC) and the date of the last price bar as well as available memory and number of the price bars used for training the model (price bars before Learning Border Cursor).
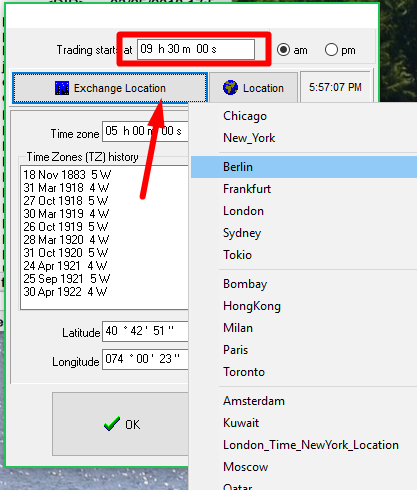
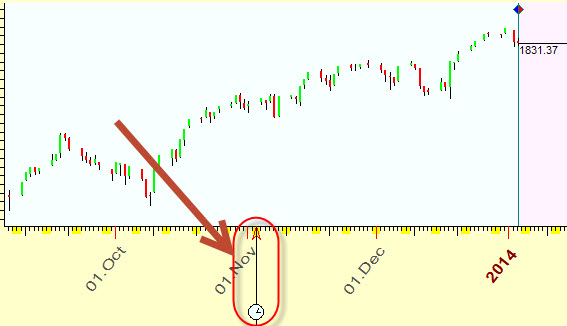
Tip #2: Daylight savings marker
This marker with watches shows the date when daylight saving time have changed:
This concludes the introduction to Timing Solution. As you may guess now, this program offers you a huge variety of tools for market analysis, and we have only scratched the surface of it. However, at this point you should be able to feed the program various price history data and use the most common forecasting techniques to generate your first projection lines.
In the next lesson we will be looking in detail at different ways of loading market data into Timing Solution and useful things to make your working with the program more efficient.