ULE - Universal Language of Events
This module allows to create simple and more advanced models by analyzing processes that occur in time and researching the effect of these phenomena on the stock market. We have developed a special way to deal with different types of events. "Different" means really different events - physical phenomena (like Sun spot activity), astronomy phenomena (Eclipses, planetary speed, elongation, etc), astrological phenomena (aspects, midpoints, dignities, and others) and fundamental phenomena (FED activity, consumer price index and more).
In this module, we define and record the events that may have some effect on the stock market performance. As soon as it is done, the program calculates the moments and/or time periods when these events take place - and shows them together with the price chart. Therefore, we deal in this module with two processes: one is the price movement of some financial instrument (and we would like to know what will happen to it), another is some other process, already known and documented (which means that we know what occurs next). Comparing these two processes, we can come up with specific conclusions regarding future price movements.
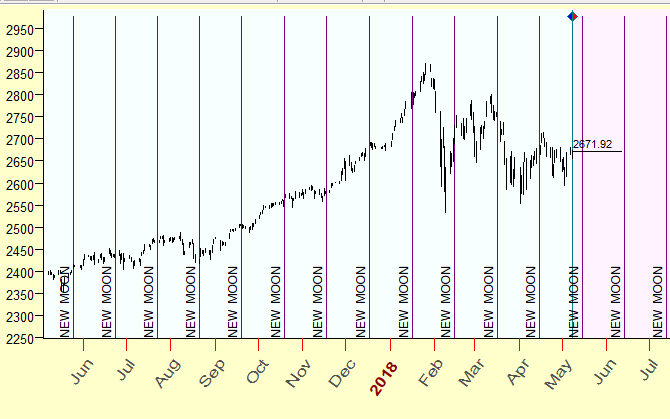
One of the examples described in many sources is a research regarding the effect of Moon phases on the stock market. With Timing Solution we can easily draw New Moon dates for visual analysis
and calculate Efficiency Test to get an idea how this astronomical phenomenon affects the stock market:
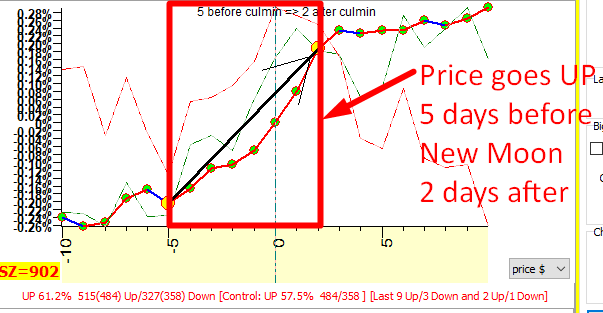
The two screenshots above show the S&P500 index from 1950 to May 2018 analyzed relative to the Moon phases. This chart shows that within the time interval of 5 days before the New Moon through two days after the New Moon the price tends to go UP. Since 1950 till May 2018 there were 842 New Moons within this interval (5 days before the New Moon to 2 days after), and the price went UP 515 times versus 327 DOWNs. Within the last year, May 2017 - May 2018, it was 9 UPs versus 3 DOWNs.
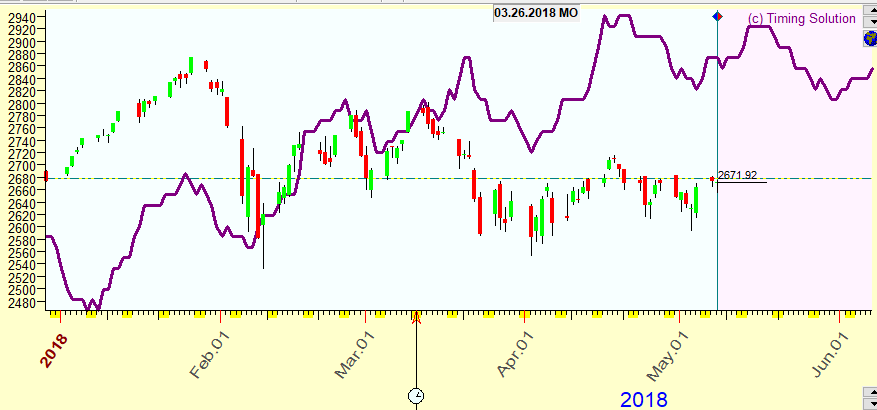
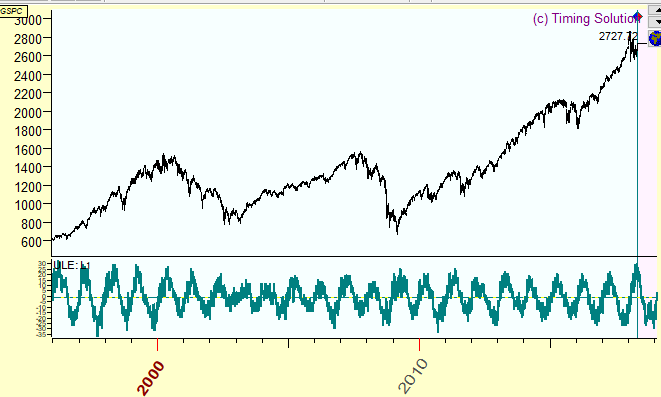
Here is another example: we calculate the index of cyclical vibration; this is a balance of waxing and waning angles between planets (yes, planets also can be waxing and waning, just like the Moon). This is how this index works for S&P500 in 2018 (shown by the purple line in the image below):
The formal statistical analysis shows the correlation between S&P500 (to be exact, its oscillator with a period of 50 TD) and the index of cyclical vibration as 6.69%:
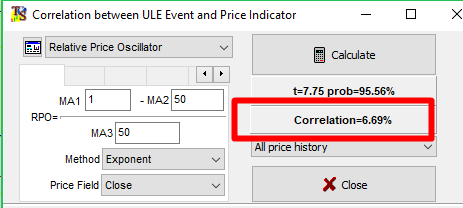
This is not bad. From previous lessons, a positive correlation is generally a good sign for reliatbility of an index, even if it is at 6.69%
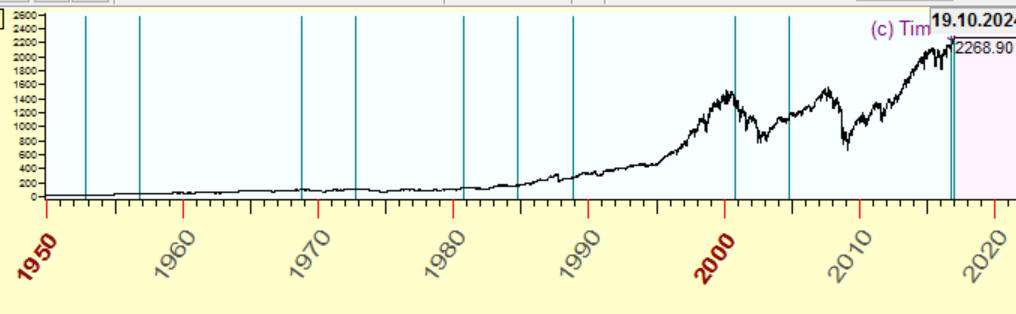
In another example we can calculate the dates when Federal Reserve (Feds) changed the rates and watch when big ups and downs occur around these dates. Efficiency Test, which is discussed later in this tutorial, shows that big ups and downs took place at a maximum of 8 trading days before Federal actions (big ups - red bars, big downs - blue bars, critical price change 4%), and no big ups or downs after that:
The three examples above are just a few things that are possible to analyze using the ULE module. Below are more practical examples that cover the main features of the ULE module.
Creating and combining events
Let us start with the following example: Suppose we have heard about some connection between the stock market and an event called Mercury retrograde. ("We have heard" - it is not the same as "we know". Also, we do not specify here what is that connection. We just have heard that there may be some.) If it is true, it can be used to prepare for possible future market moves. So the first step would be to create an indicator that shows the periods when Mercury is retrograde.
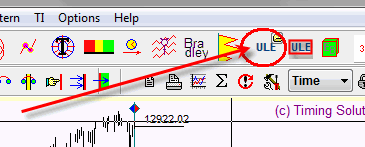
In order to build this indicator, we open ULE Editor module clicking this button:
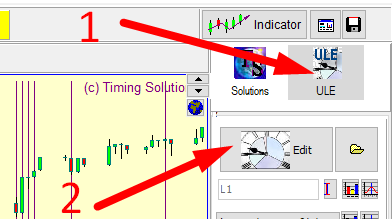
or open ULE panel by clicking ULE icon (step #1) and then clicking the Edit button (step #2):
The ULE editor window appears where we can specify ULE events. Here it is:
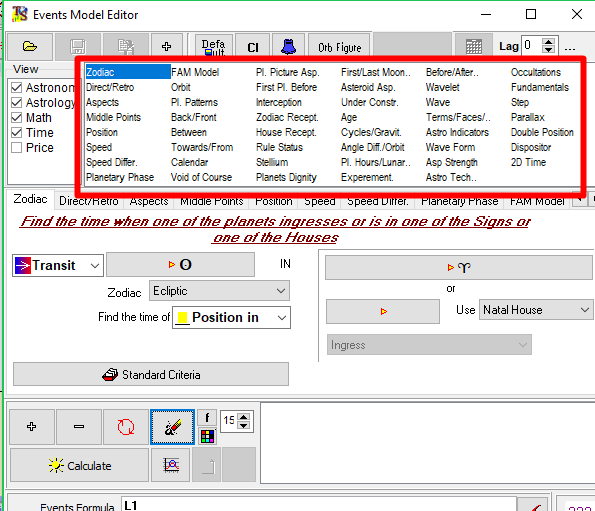
The Events Model Editor has a lot of different pages devoted to different categories of events: planetary positions, planets direct/retrograde, midpoints, planetary speed, planetary phase and many others.
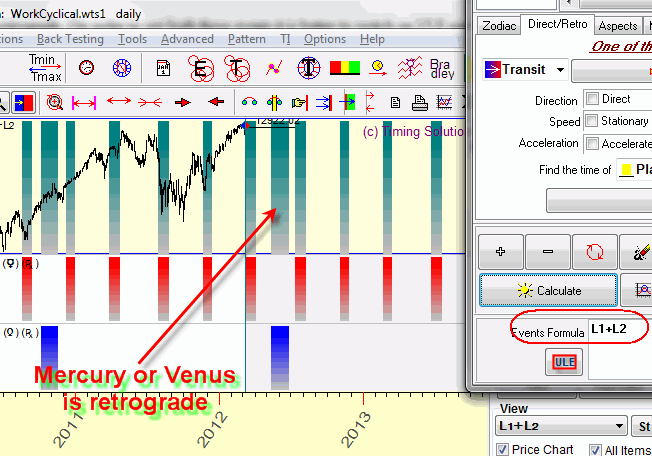
In our particular case we highlight "Direct/Retro" item and fill out the form as it is shown below:
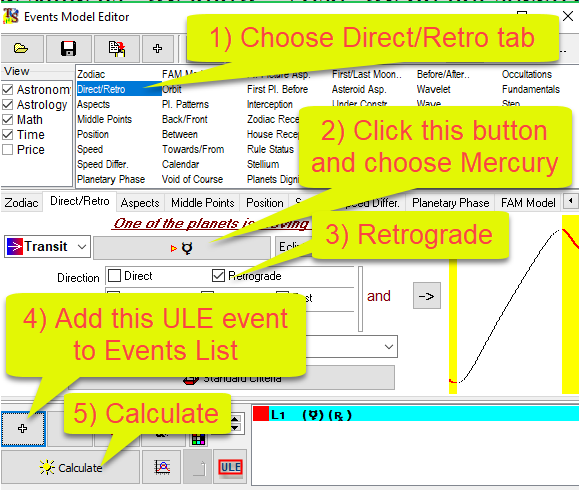
By filling this form, we have defined the ULE event, "Mercury is retrograde". This event is marked as L1 (Logic condition #1). By clicking "Calculate" button we get the chart like this one:
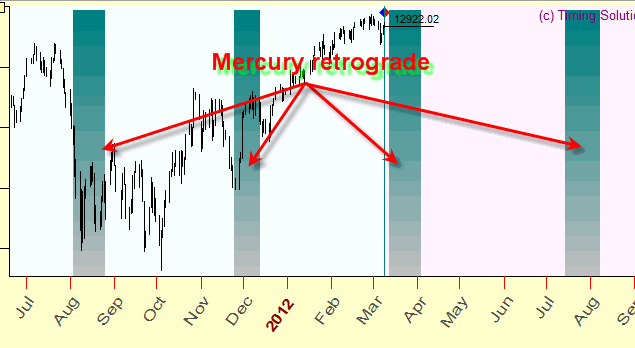
These vertical stripes correspond to the time periods when Mercury is retrograde inside the time interval that we research.
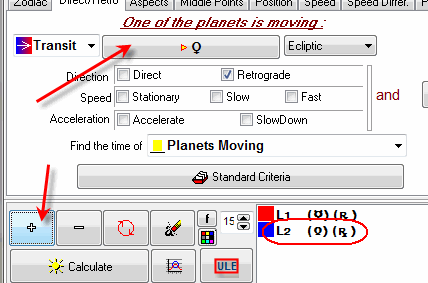
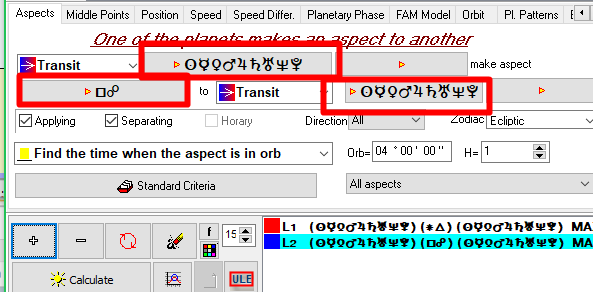
We can stop here and work with just this one event, or we can go further and include more events for our analysis. Let's assume that along with retrograde Mercury, retrograde Venus also affects the market. So, we create one more event: "Venus is retrograde". We deal with the same form as above, but instead of Mercury, we select Venus this time (see the picture below). And, because it is one more event that we add to the previous one, we should click "+" button after filling the form:
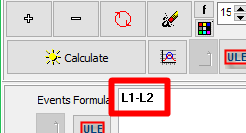
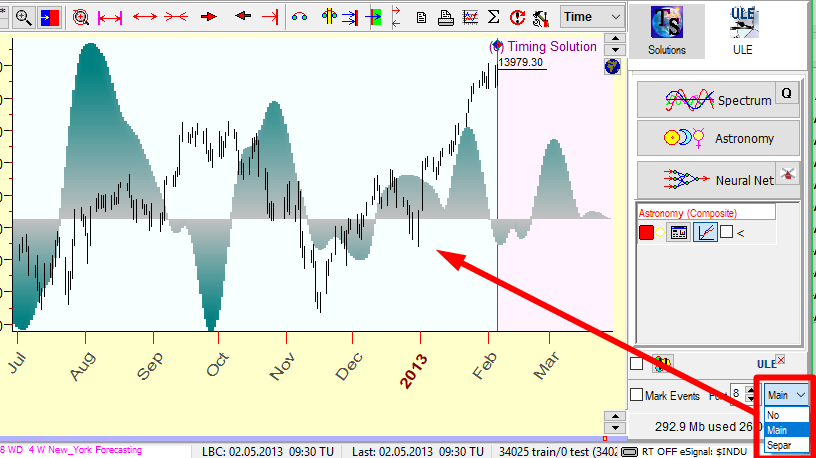
Now we are able to consider two events, two logic conditions, L1 and L2, that we have for Mercury retrograde and Venus retrograde. To see these events on one screen, it is better to switch to ULE panel by clicking the icon shown below:
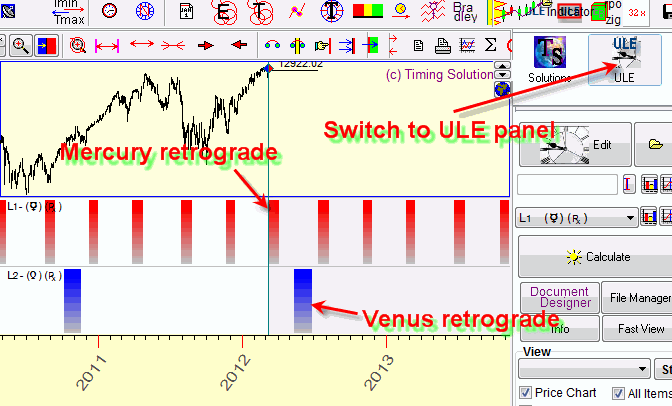
ULE panel shows more detailed information regarding ULE events, while Solutions panel shows the most important information only.
Now we can see how these two events work in time. We can add other events here and see them all on one screen. It is just the price chart and pictures of different individual events. This would be the first step in the analysis: looking at each event separately, to see whether it has any relation to our price chart. This is a visual, not a formal analysis.
Now it is time to create a more advanced indicator. Looking at the diagram above, we may decide that both events have some relation to the price movement. And we may want to see the moments when MERCURY OR VENUS is retrograde, i.e. the moments when at least one planet (of these two) is retrograde. In a language of math logic, we are looking for a situation when at least one of the available logic conditions takes place.
In order to do that, type L1+L2 formula in the "Events Fomula" field and click Calculate button once again. Here are these retrograde zones, the resulting shadowed zone covers the periods when either Mercury or Venus is retrograde:
We may also do the opposite: create a model for the periods when BOTH MERCURY AND VENUS ARE RETROGRADE, i.e. double retrograde zones. To do this, type L1*L2 into the Events formula:
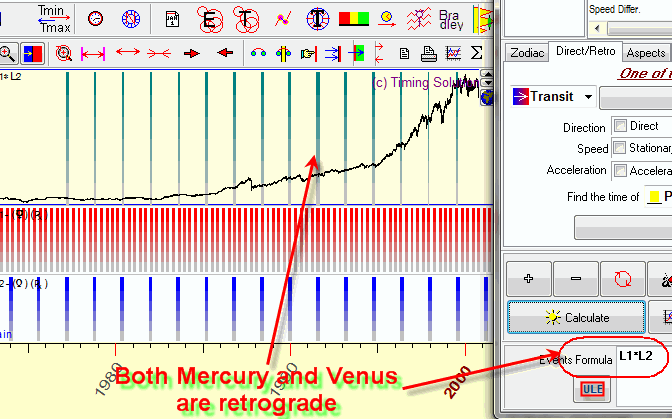
L1+L2 means at least one of these events is active, while L2*L2 means that both these events are active. We use regular logical operators for these formulae.
Following the same logic, we can easily create more complicated formulae. For example, below is an indicator that allows to find a very rare event in history - the moments when Mercury, Venus and Mars are all retrograde:
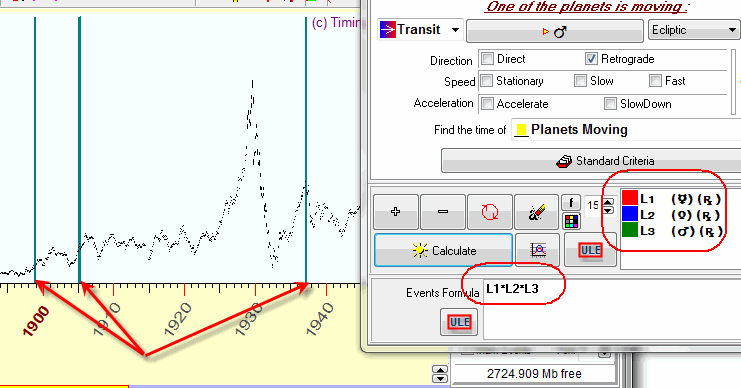
In the last 150 years, from 1885 until 2035, this phenomenon (triple retrograde) has occurred only three times.
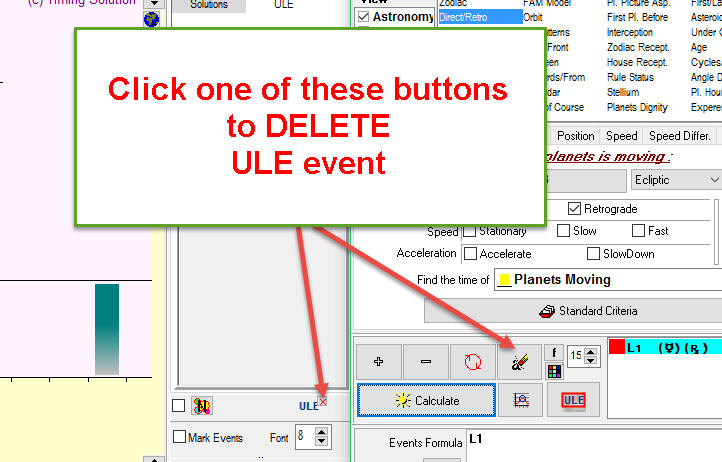
To delete a ULE event/events, click one of these buttons:
Creating events is essential in ULE module. The retrograde event above is just one of many examples. Timing Solution allows for working with a huge variety of events and creating different logical combinations of them. It is a good tool to test virtually any event against a financial instrument to see if there is any correlation between the two. The possibilities are endless here.
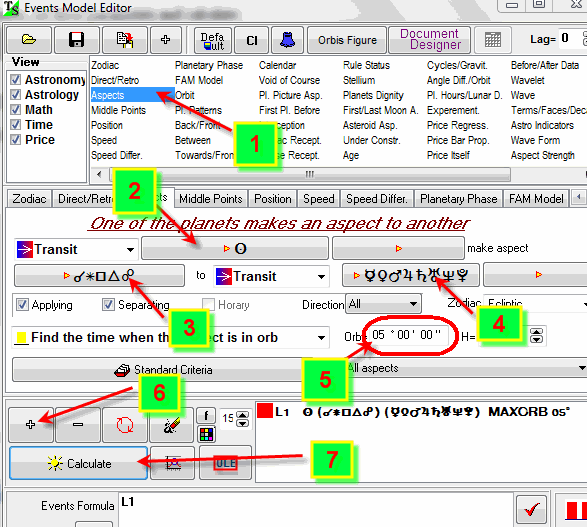
Aspects
Another popular group is "Aspects". There is a lot of talk about aspects, their power and meaning. We deal with the core idea - aspects as angular distances between the planets. Some aspects are more distinguished than others. 0 (360), 30, 45, 60, 90, 120, and 180 (so called Ptolemy aspects) are considered as the most important ones. The exactness of the distance between planets is called the ORB. As an example, consider 125 degree distance between two planets. We say that these planets form a 120 degrees aspect (trine) with Orb=5 degrees. We can say the same if the distance between them is 115 degrees.
There are a lot of things to explore regarding aspects. For example, try to create "Sun aspects index"; it indicates Ptolemy aspects made by the Sun to other planets. It is easy to do in the same ULE window, on the page "Aspects". Set the parameters as shown below and press "Calculate" button:
Immediately after the calculation, this diagram appears (together with Dow Jones Industrial index chart):
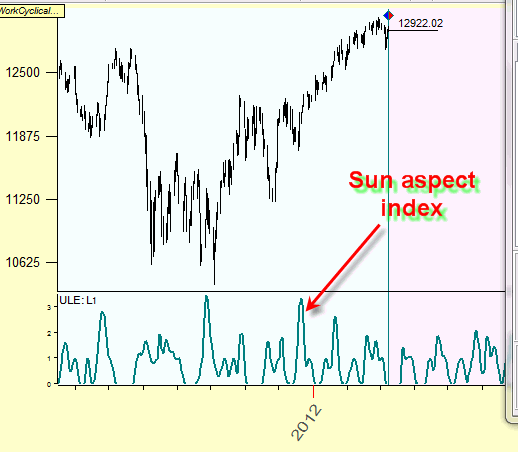
This is the Sun aspects index. Higher values on this diagram mean that more planets make aspects to the Sun and with tighter orb. Combine this index with any market data to see if there is any relation to market behaviour in regards to this index.
ULE information module
Let us continue working with the Sun aspects index. After its calculation, it is possible to know what aspects are active at a specific point in time. Though celestial bodies are always forming some aspect between each other, a certain aspect may or may not be present (or active) at a certain moment of time. In order to see what aspects are active, click on the ULE button as shown in the step 1 in the picture below. After that click on Info button:
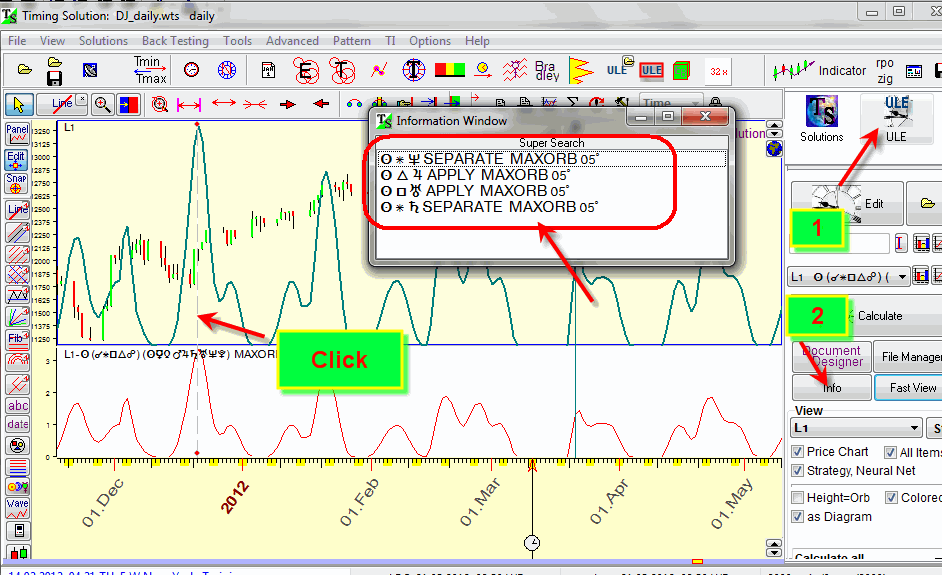
Now click somewhere on the price chart in the Main window. The aspects that are at work at that moment will appear with specific information about each one of them.
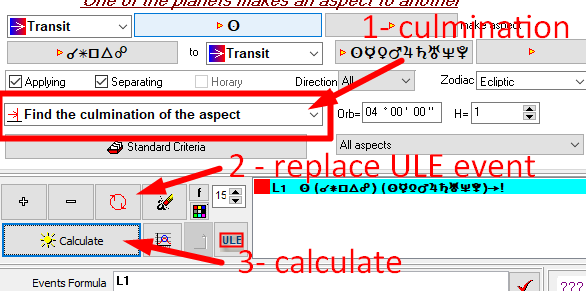
Aspect culminations
It is possible to see the dates when an aspect
culminates, i.e. the moments when the aspect in question reaches the exact angle, i.e. the
angle separation between planets reaches exact values 0, 60, 90, 120, 180 degrees.
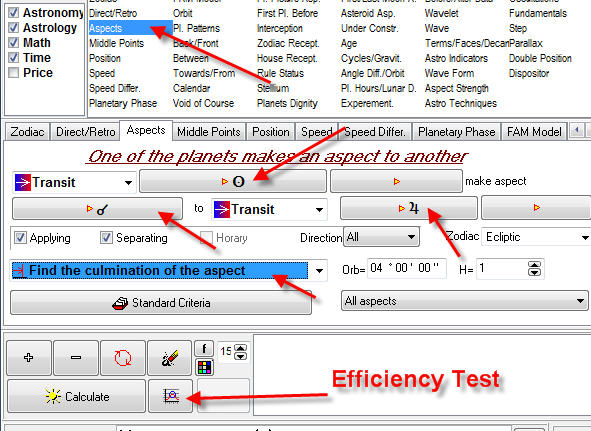
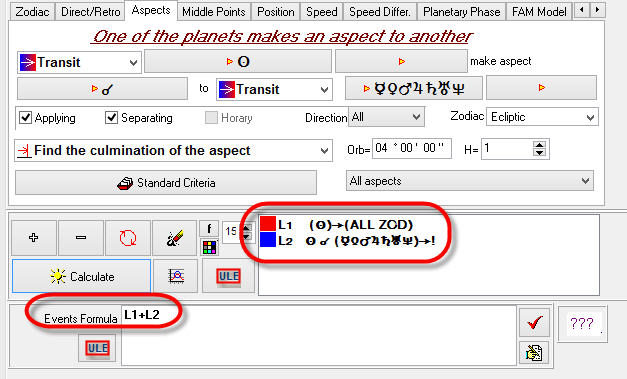
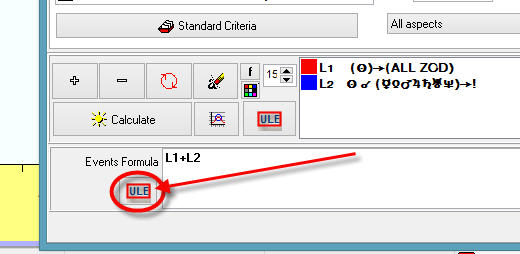
In order to do that, highlight "Find the culmination of the aspect" option
(step #1) in
ULE editor, click  to
replace existing ULE event or if the events box is empty click "+" button (step
#2) and click "Calculate" (step #3):
to
replace existing ULE event or if the events box is empty click "+" button (step
#2) and click "Calculate" (step #3):
The vertical lines show culmination events:
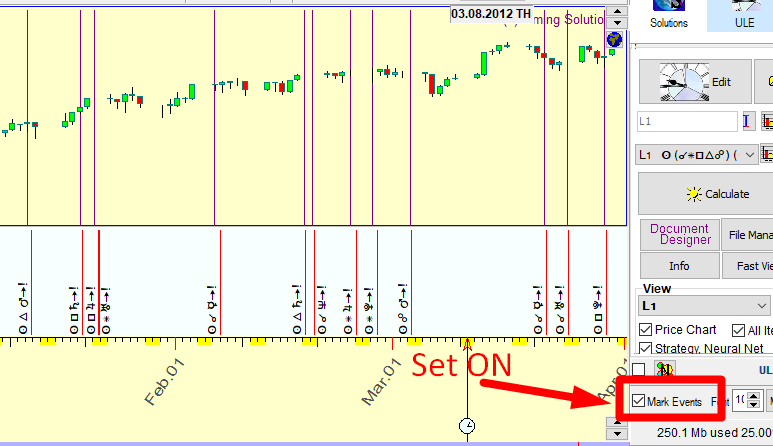
It is recommended to set "Mark Events" option to ON to see the aspects that correspond to these lines.
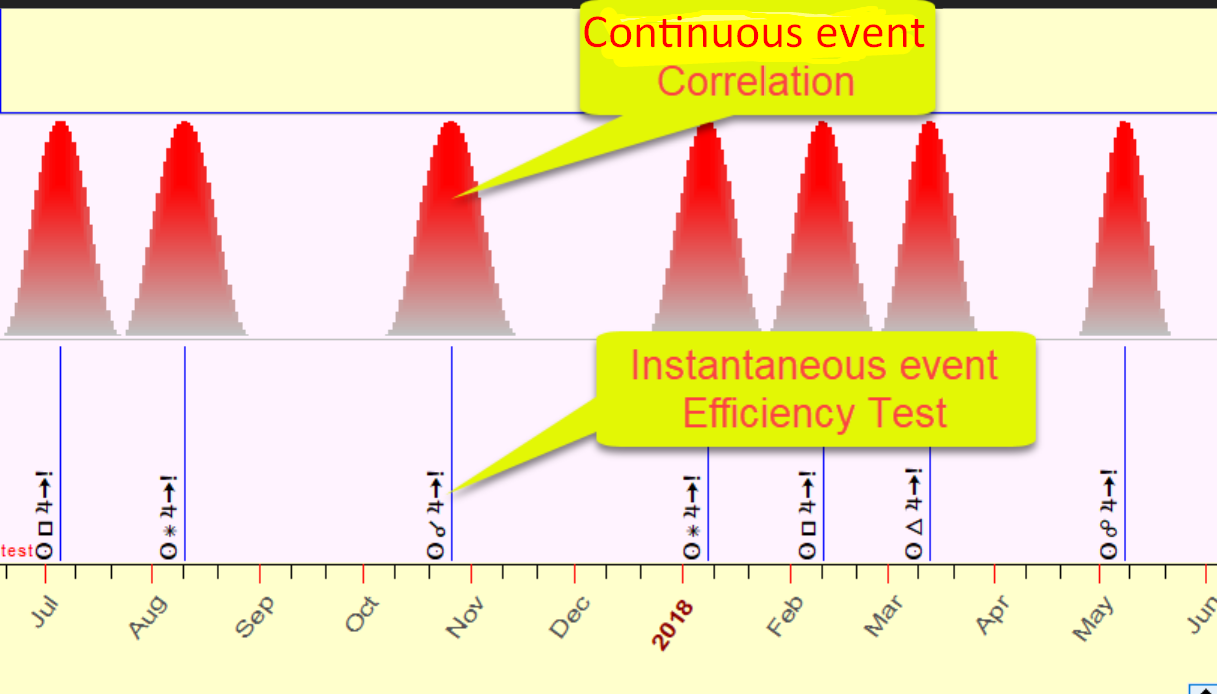
Continuous versus Instantaneous events
When building the Sun aspect index, we worked with CONTINUOUS events, events that have some duration in time. In regards to aspects in general, they form, culminate at a certain moment and then cease to exist. This process takes time. It is different with culminations: these are INSTANTANEOUS events that have no duration; it is just a moment when aspect culminates. To analyze continuous and instantaneous events, we should apply different statistical routines. For continuous events it is a correlation criterion, for instantaneous events - an efficiency test; both will be explained later. It is very important to keep in mind the nature of events that we research whether they are continuous or instantaneous. The picture below should help with that. It shows the way we can treat the same Sun-Jupiter aspect as both types of events. The first diagram looks at it as a continuous event (it is considered as aspect with orb), while the second represents it as instantaneous (dealing with culmination moments only):
Aspect Balance Index
Let us build one more index based on aspects. Astrologers used to distinguish between two groups of aspects: so called "good" aspects (60, 120 degrees) and "bad" aspects (90, 180 degrees). We may create an index that shows the balance between good and bad aspects and explore its effect on the markets. We will analyze continuous events, i.e. aspects with an orb of 4. Because we worked already with some events, the first step is to delete all previously created ULE events:
Next, create ULE event for "good" aspects L1, with all planets included except
for the Moon:
and a similar event L2 for "bad" aspects:
Note that good and bad aspects are indicated by their appropriate symbols rather than wording.
We type the formula L1-L2:
and click "Calculate":
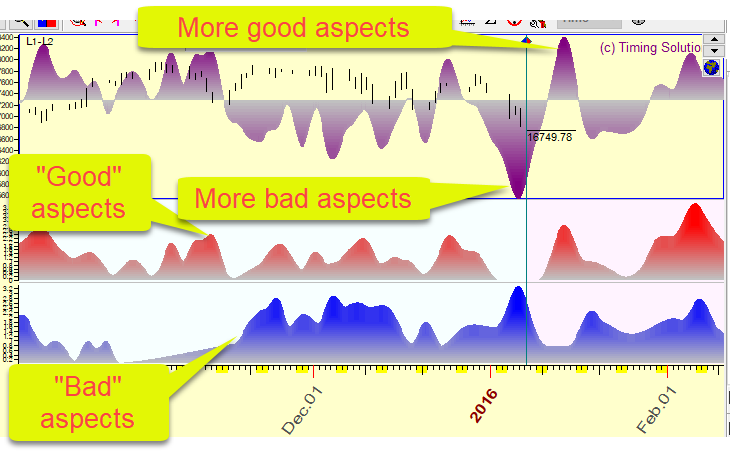
The result is the good-bad aspect balance index: blue diagram represents "bad" aspects, red diagram is for "good" aspects, while the upper purple diagram shows the difference between good and bad aspects. Positive peaks mean that there are more good aspects, negative peaks - more bad aspects. Compare it with any market data to see what is going on the market when there are more good or bad aspects.
Correlation Criterion - Statistics for Continuous Events
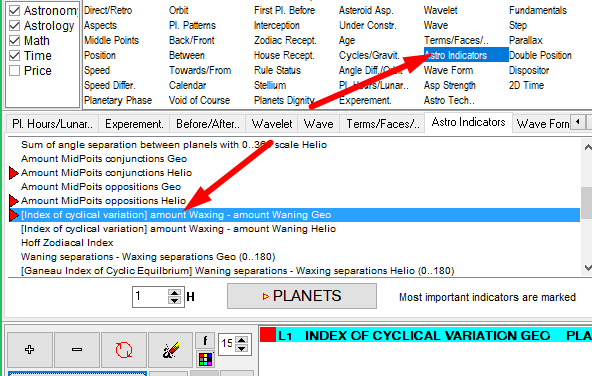
How to estimate the statistical significance of continuous events, like aspect balance index above? Or index of cyclical vibration mentioned earlier?
The first step is to create an event model. Pictured above is the Cyclical Vibration index, and it can be found in "Astro Indicators" as shown below.
We will explore its relation to S&P500. It is always recommended to do a visual analysis first, just to figure out how this index looks in respect to characteristic points in the data:
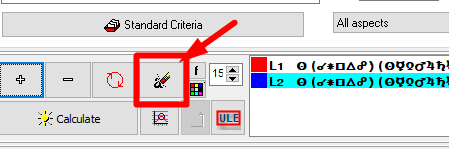
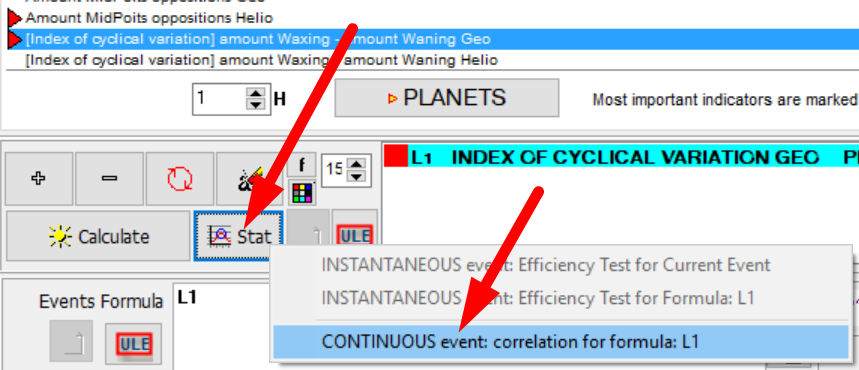
Next, to do the formal analysis, click the Stat button in ULE Editor and choose CONTINUOUS event correlation for formula: L1" item in the pop-up menu:
This information window appears:
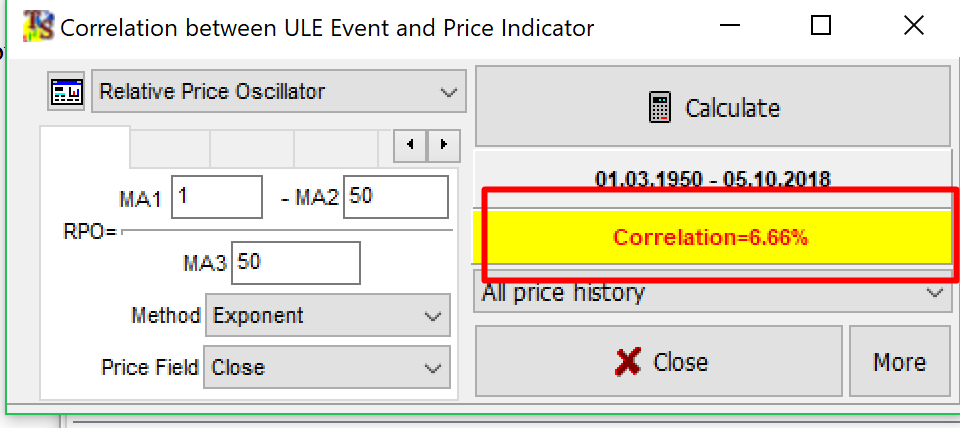
The program calculates Pearson correlation between the index of cyclical vibration and the relative price oscillator (RPO) with the period=50 TD and index of cyclical oscillator. You can read more about correlation here.
The diagram above shows that for the data from 1950 until May 2018, the correlation between the price (RPO) and the index of cyclical vibration is 6.66%.
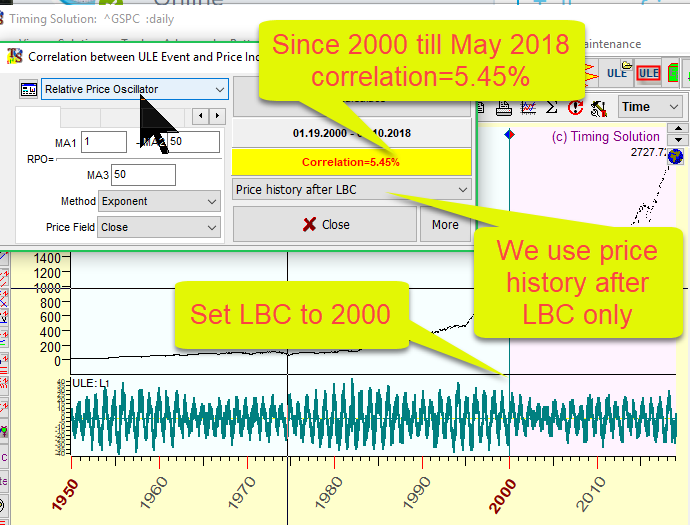
The available data covers more than 60 years of price history. This might not be very useful, we might only be interested in how the index works over a specific period in time. For this example, let's assume we need to know how this index works for the last 8 years, since 2010, not for all available data. To do this, set LBC to 2000 and select "Price history after LBC" in the drop down menu:
Efficiency Test - Statistics for Instantaneous Events
Efficiency test module allows to estimate the effect that any instantaneous phenomenon may have on the stock market.
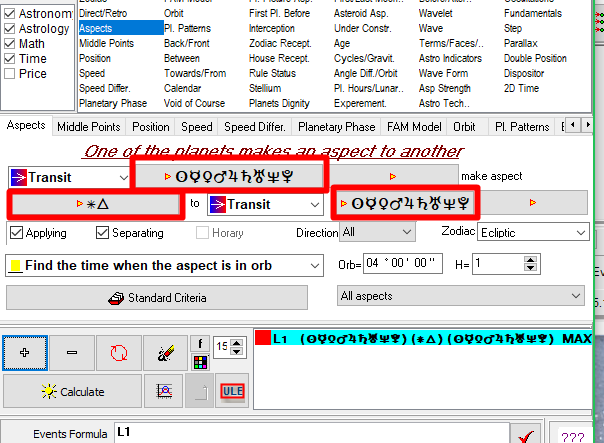
As an example, let us analyze how the aspect Sun - Jupiter conjunction affects Dow Jones index. After downloading the DJI data, fill in the form for this aspect as shown below and click "Efficiency Test" button:
The Efficiency Test diagram appears. It shows the average price movement around the culmination date of this aspect (percentage), including 10 trading days before and 10 trading days after the culmination ("culmination" means the exact moment of the aspect, i.e. the moment when angle separation between planets reaches exactly 0, 60, 90, 120, 180 etc. degrees):
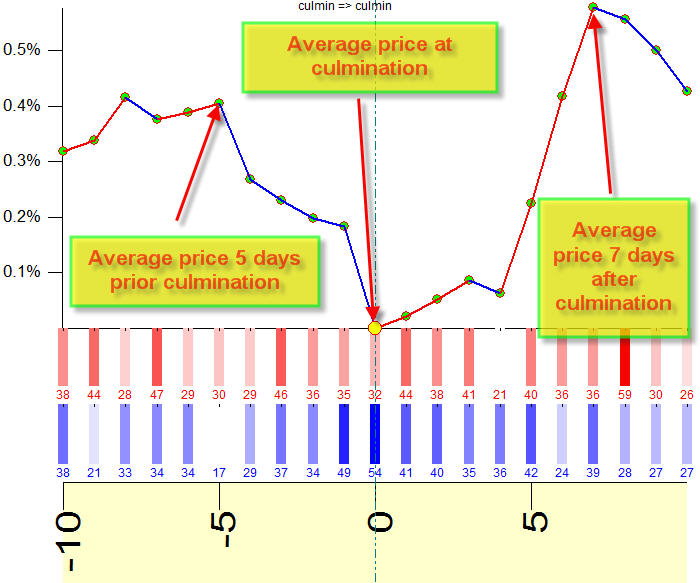
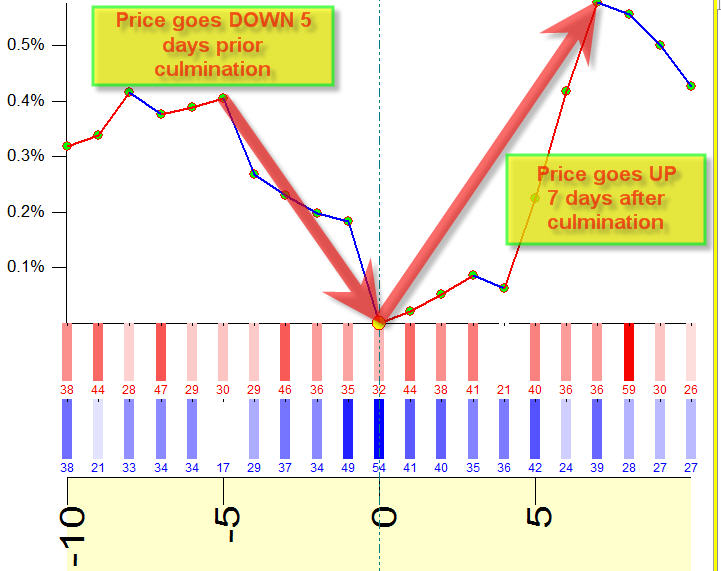
Thus we can see how this aspect affects the stock market on average. For this example, it looks like the price tends to go DOWN 5 days prior the culmination (and the averaged price movement is 0.4% down), and then, after the culmination, it goes UP for another 7 days (the averaged price movement is 0.5% up):
Remember that the averaged diagram does not provide the exact picture ready to be used immediately, it shows the averaged picture only.
To see the details, drag the mouse cursor from one point to another. As an example, we drag the mouse cursor from point A that corresponds to 5 trading days before the culmination to point B that is the day of the culmination. The program creates an arrow that connects these points:
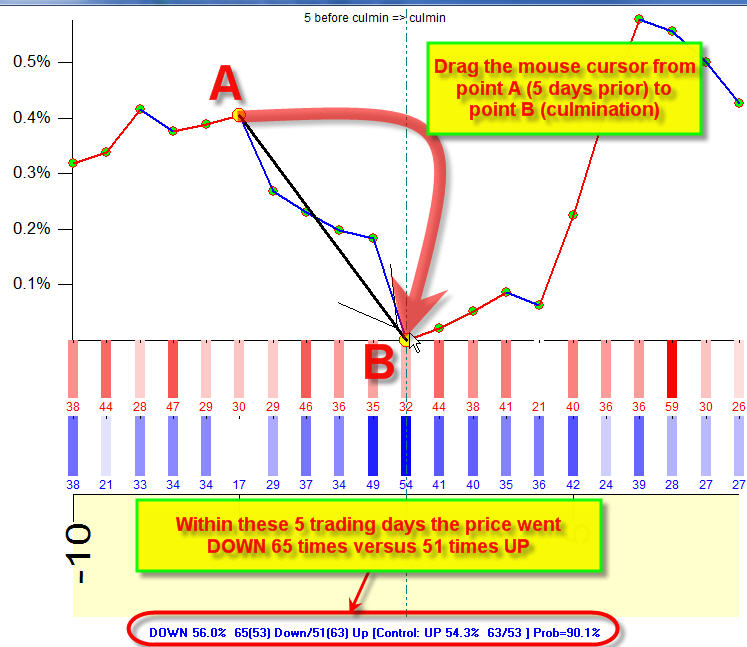
As shown on the picture, the price went DOWN 65 times and UP 51 times. In other words, within the analyzed data set, this aspect took place 116 times and out of those 116 times, the price went DOWN 66 times versus 51 UPs. In this particular case, it is hard to make a conclusion as the effect is not certain. In real life trading, the chance to succeed using only this information (that the price tends to go down 5 days prior Sun - Jupiter conjunction) is not certain as well.
However, that same efficiency test (for the same aspect, and based on the same data set) gives a hint to another strategy. Look at the price movement after the culmination (drag the mouse cursor from the point B (the culmination point) to point C, 7 days after the culmination):
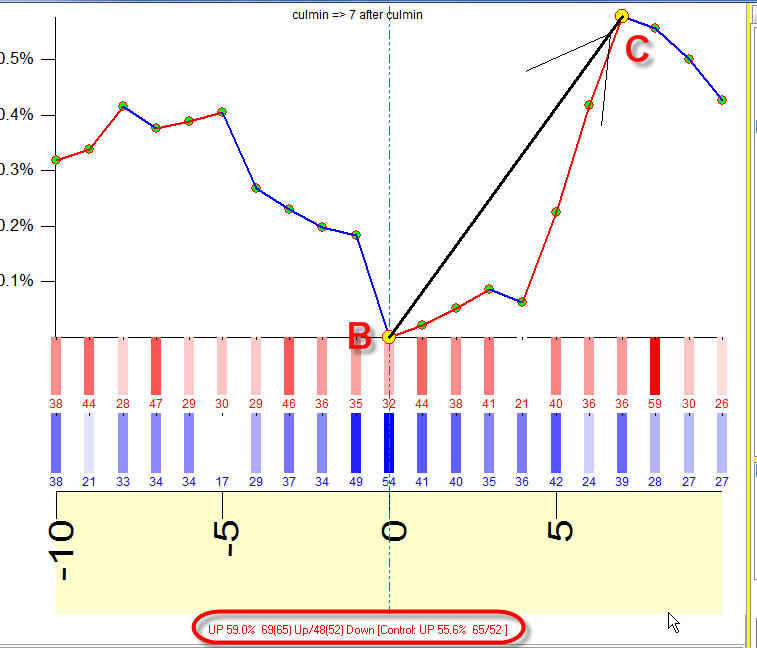
The price went UP 69 times versus 48 times DOWN. This trading strategy looks better than the previous one.
Last %X trades
In the example above we did the Efficiency Test for DJII data. The corresponding diagram shows the averaged picture - it shows how this aspect has affected the price since 1885. Still, we may ask a question: "Ok, maybe this aspect worked in this manner for more than 120 years. Does it work the same way now? It would be good to know how this aspect has worked only for the last ten years, it would give a trader more confidence". In order to do that, set "Last %X trades" option to 10. This is the number of trades to be considered. Then click "Recalculate" button; the chart appears on the screen that represents the Efficiency Test calculated for the last 10 aspects:
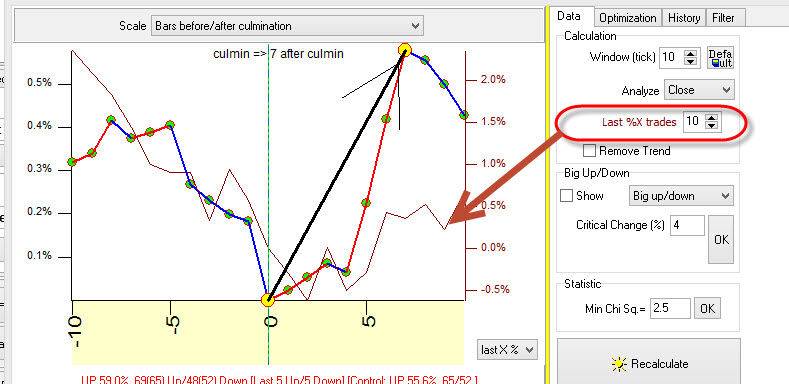
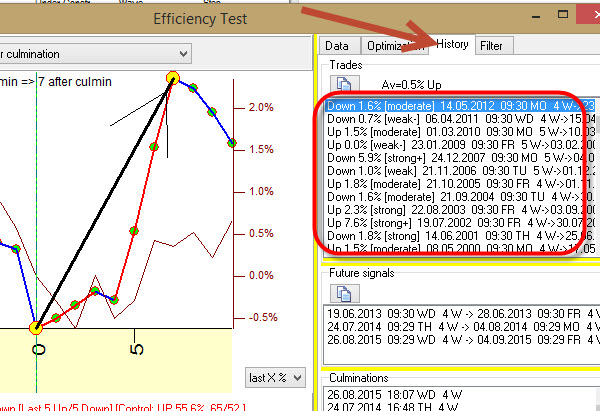
The detailed information regarding the price movement around this aspect is shown in "History" tab:
The best strategy
So far, we have seen that the Efficiency test for only one financial instrument and the data set may suggest several trading strategies. Is it possible to find which one of these strategies is the best? Timing Solution software provides that opportunity.
You can do so by going to the Optimize tab in the Efficiency Test window and clicking Optimize button as shown below:
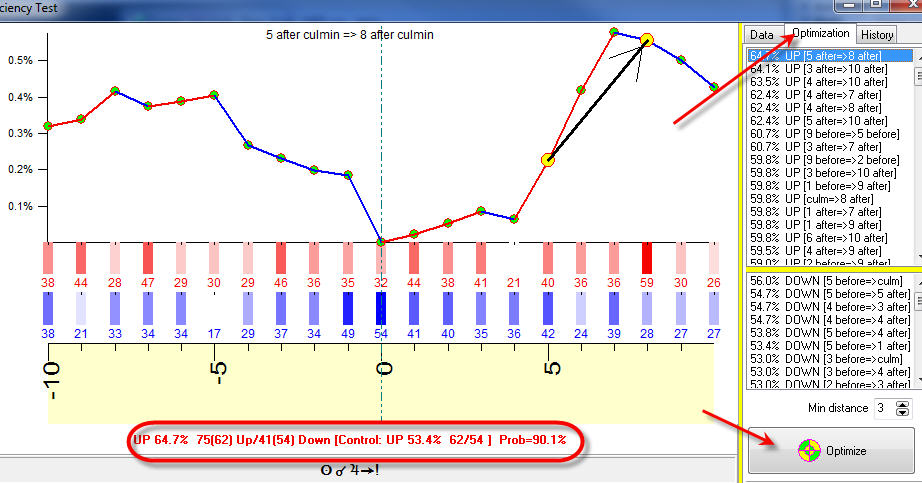
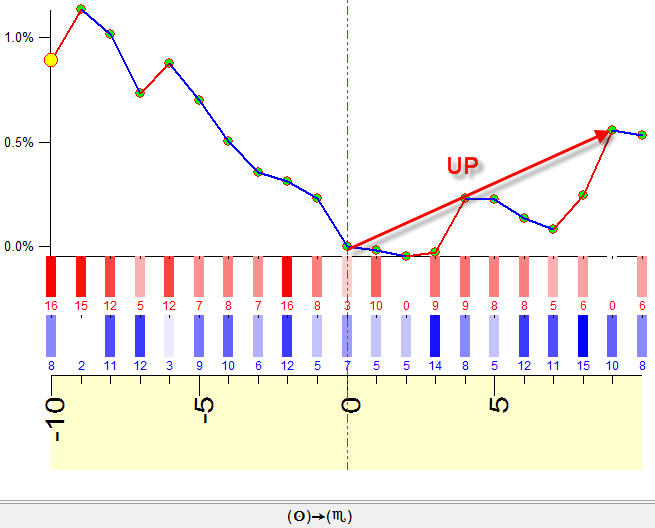
The rated list of strategies appears. The first strategy in the list is suggested by the program as the best one of all available possibilities. The last one is the worst. Highlight any of the strategies from this list to see it on the screen. The picture above shows the first strategy highlighted. It says that the trade could start 5 days after the culmination and end on the 8th day after the culmination. Within this period of 3 trading days the price went up 75 times versus 41 times down. This strategy is better in this case than other previously discussed strategies.
Risky strategy
It is important to always remember that the price movement direction shown by Efficiency test diagram and the real price movement can be different.
Look at the example below. Efficiency test is calculated for Gold price for the moments when the Sun ingresses Scorpio (in other words, the exact moments when Sun enters a zero degree of Scorpio; it is an instantaneous event, while the periods when the Sun is in the sign of Scorpio are continuous events):
This diagram shows an uptrend movement during 9 trading days after the ingress. How many times did the price go UP and how many times did it go DOWN within those 9 trading days after the Sun ingresses Scorpio? To find that, drag the mouse ingress point to the 9th day after the ingress:
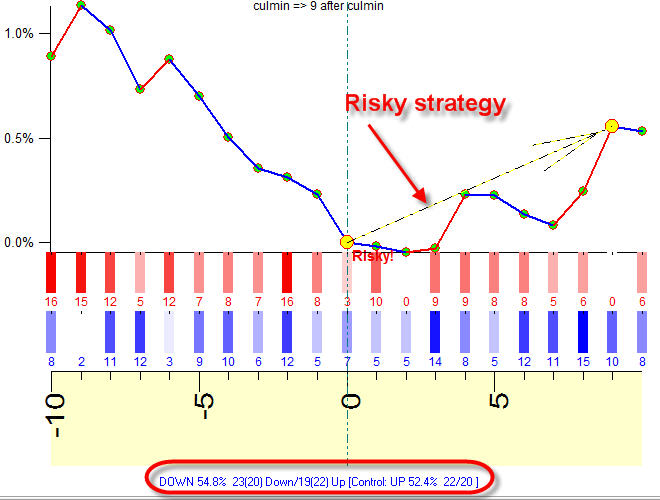
Looking at the results, this is actually a DOWN strategy (23 Down versus 19 Up cases), while the Efficiency test indicates UP movement. It means that, even though a number of cases when the price went down is higher than the number of cases with up movement, some of up movements were really big ones compared to down movements (the actual price chart confirms that). This is a RISKY strategy, and the program marks such strategies with a dotted arrow. Be cautious with risky strategies.
Turning Points/Big Ups and Downs
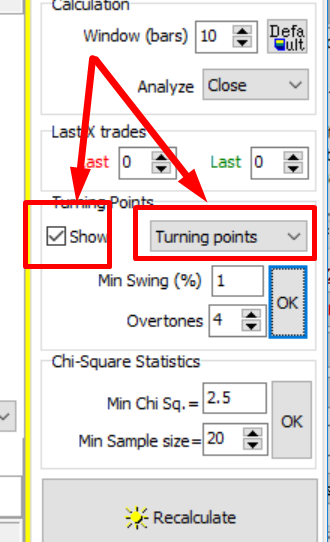
The colored red/blue bars at the bottom of the Efficiency test diagram give some clues regarding the effect of the event on turning points. Turning points can be shown by checking the "Show" box in Data Tab:
The Top turning points are shown as red bars, and Bottom turning points are shown as blue bars for each day around culmination included in Efficiency Test. It gives the possibility to see how turning points are distributed around analyzed instantaneous phenomena:
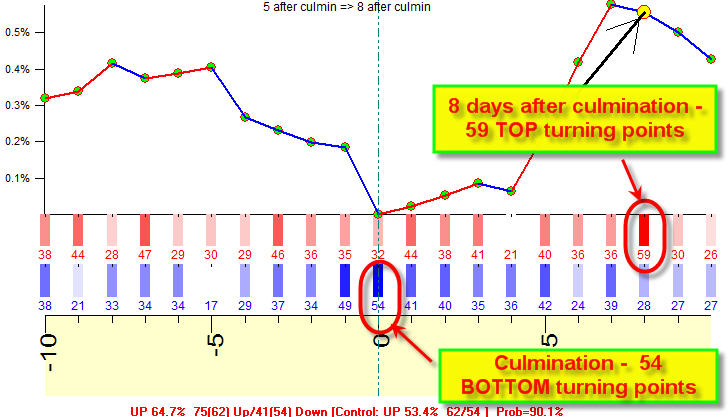
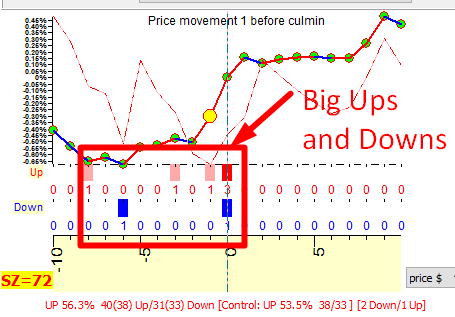
In the example above, the brightest red bar with digits 59 indicates that 8 days after the culmination of this aspect TOP turning point took place 59 times. This is higher than the average value (look at other bars). Therefore, TOP turning point is more probable 8 days after Sun-Jupiter culmination.
In the same manner, the brightest blue bar with digit 54 indicates a probable BOTTOM turning point for the day of the culmination.
In the same manner, Timing Solution can analyze big ups and downs, to see how they are distributed around culminations or other instantaneous events. To do that, choose this option:
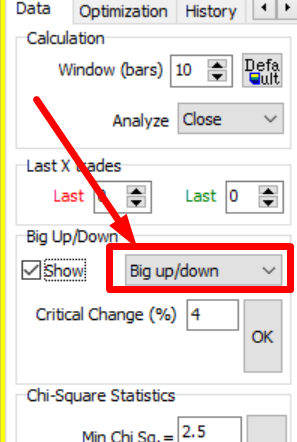
Instantaneous events can be of different nature. Try one of the options in Fundamentals section of ULE module. Let the event be the dates when Federal Reserve Agency (Feds) change the rates. It is possible to calculate the Efficiency Test for this event to see the typical price movement around it. The Efficiency test shows that big ups and downs took place maximum 8 trading days before Fed actions (big ups - red bars, big downs - blue bars, critical price change 4%), and none after that:
Control group
At the bottom of Efficiency Test window there is an information string. Let us take a closer look at it:

In this case, it shows that the price went UP 75 times and 41 times DOWN. There are also digits in brackets, for UP 75(62) and for DOWN 41(54). These are Control Group digits. They mean that on average within the price data set the price moves UP 62 times versus 54 times DOWN regardless of any aspect or any other phenomena. In other words, the price moves UP more often than DOWN, it moves UP 53.4%. And it happens not because of the aspect that we explore but because it is a natural tendency of our financial instrument's price changes within the data set. In statistics this is called "a null hypothesis". In the example, the null hypothesis is that the default/natural movement of the price is 53.4% UP.
When we analyze the actual price movement in regards to the event that we explore, the program shows 75 UPs versus 41 DOWNs; i.e. in 64.7% cases the price goes UP. The percentage of UPs now is bigger than the percentage of UPs in the control group/null hypothesis: 64.7% (the actual price movement with the aspect) versus 53.4% (the control group). Thus this aspect generates more UP movements than occur on average.
This is a very typical mistake to forget about the control group when conducting statistical analysis. If somebody tells you something like this: X aspect generates 66% UPs, immediately ask these two questions:
1) What is the sample size (SZ), or how many cases were analyzed? It is possible that there are 3 ups versus 2 downs among 5 cases in total (Sample Size is 5), therefore these 66.6% ups may be just an accidental result. The bigger the sample size, the better.
2) What does the control group show? As we have already discussed, 66% up movements for this stock on the analyzed interval might be just a regular behaviour regardless the phenomena we analyze.
The same approach can be applied for DOWN strategy:
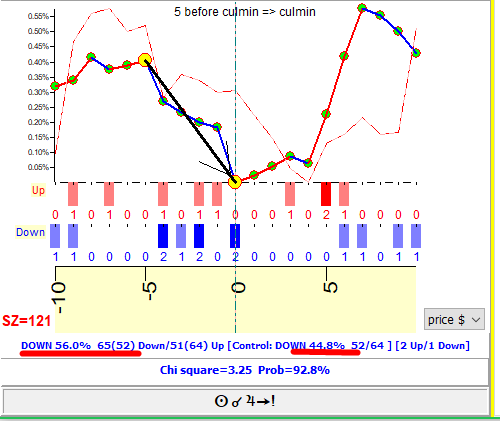
This strategy generates 56% DOWNs ( 65 cases down) while the control group shows 44.8% DOWNs only (52 cases down).
If sample size is large enough, i.e. if there are enough analyzed cases (aspects in this example), Chi Square statistical criterion can be applied to estimate the statistical significance of this phenomenon (This will be explained in detail later). In the example above Chi square is 3.25; it means that with the probability of 92.8% this is not an accidental fact. Do not mix it with the percentage of up or down cases: among 116 cases analyzed, we have 56% down cases in this example, and there is a probability of 92.8% that it is not an accidental fact. It is worth consideration for trading.
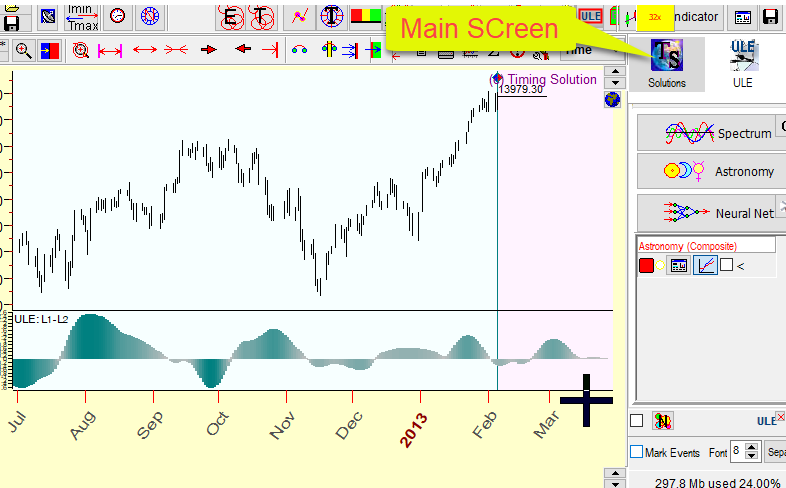
Main screen versus ULE panel
The majority of tasks involving ULE module can be done with the ULE panel. To switch to ULE panel, click "ULE" icon in the top right corner of the Main screen:
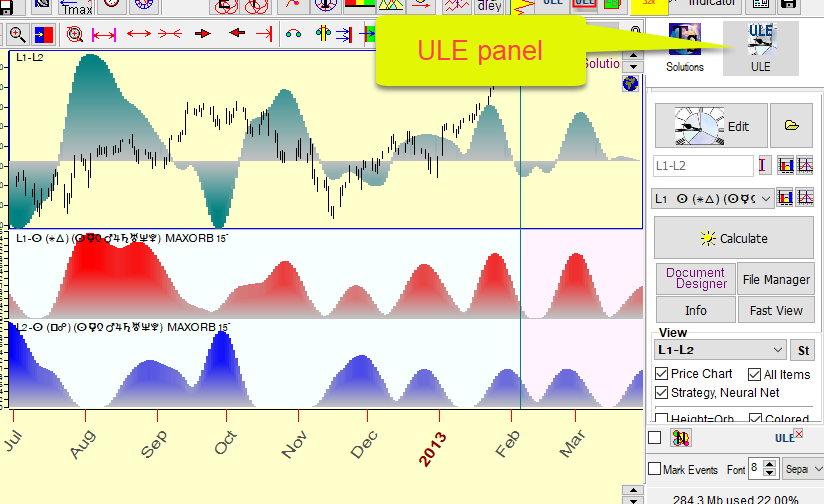
For the example above we have created the aspects balance ULE event. The program shows all related information in the ULE panel. Here L1 represents the event that describes "good" aspects (the red diagram), L2 is the event for "bad" aspects (the blue diagram), and the resulting formula for the aspects balance index is L1-L2 (the teal top diagram).
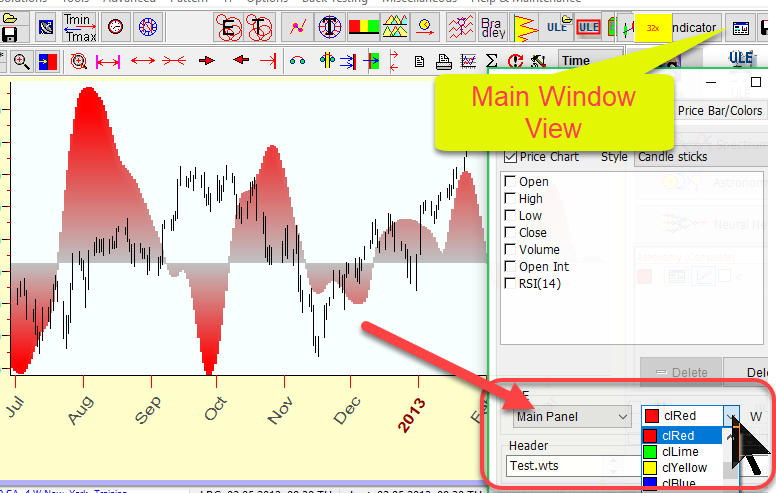
If we switch to the Main Screen by clicking "Solutions" icon, only the resulting diagram of the aspects balance index will be shown. All other information is skipped in the Main Screen:
The resulting ULE diagram may be shown in a separate panel as on the picture above or together with the price chart as shown below. The choice is made by highlighting this option:
To your convenience it is possible to change colors and the thickness of the lines through the Main Window View tab:
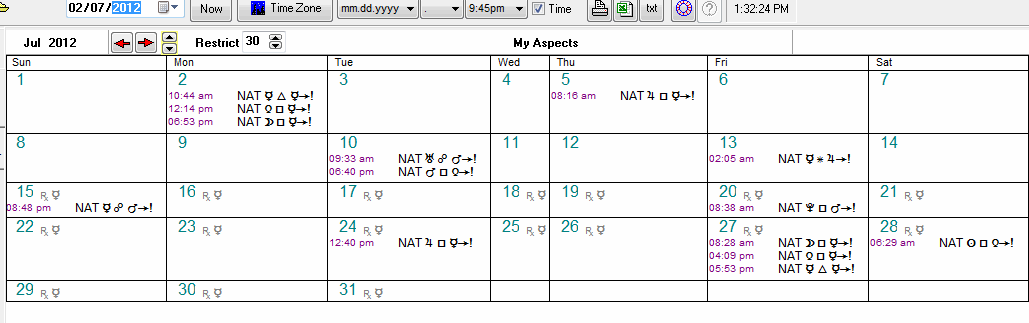
Calendar of your Personal Aspects
There is a possibility in Timing Solution to create a customized calendar. It is a convenient way to monitor ULE events.
Many different types of calendars can be created by the software. We will not discuss all the possibilities here. The purpose is to give an understanding how these things are done with Timing Solution. As an example, let us consider an aspects based calendar.
We have already discussed some models involving planetary aspects. These were so called transit or transiting aspects ("transit" means that they occur due to rules of planetary movement on an everyday basis). It is possible to see them in regards to your Natal chart or any natal chart ("a natal chart" is a snapshot of the mutual position of the planets at the moment of birth of somebody or something).
Let us build together a personalized calendar of transiting aspects to some Natal chart.
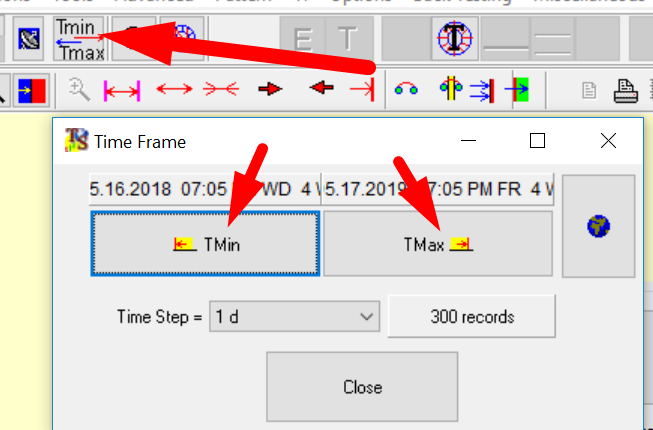
The first step is to define a time interval for the analysis. To do that, click TMin/TMax button and set the beginning and the end of that interval:
After that enter the natal chart information.
Now in ULE module set this ULE event: transiting planets make aspects to Natal planets:
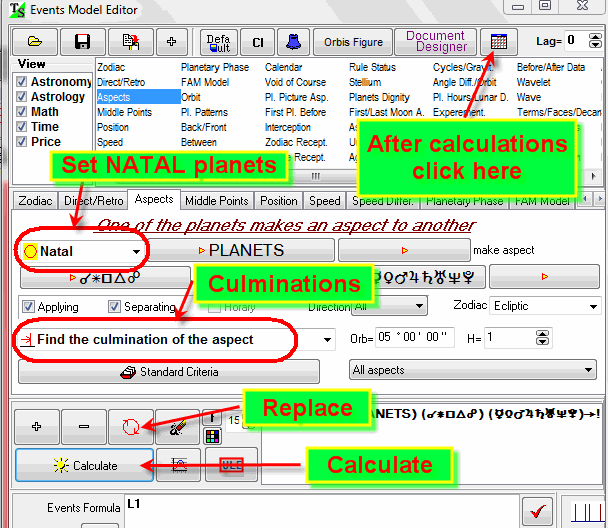
Here we use NATAL-TRANSIT aspects (in the previous examples we used TRANSIT-TRANSIT aspects). Also pay attention that we use CULMINATIONS of the aspects.
After the calculation, click on "Calendar" button to get the calendar similar to this one:
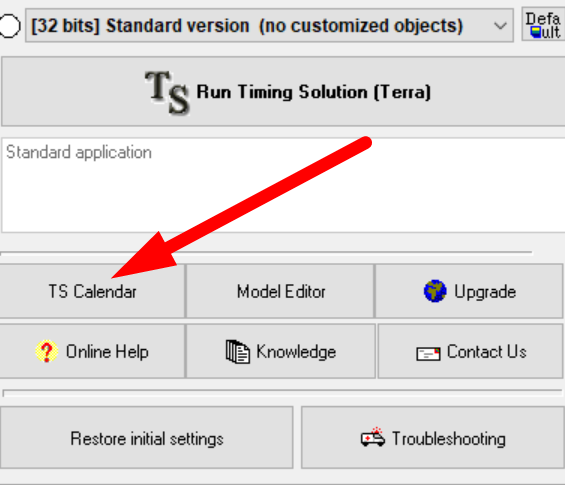
The program saves this calendar into the file, so there is no need to repeat these calculations next time you open the program. You simply run a TS Calendar program and open that file. This program can be started from the first window that you see when you run Timing Solution:
Here you will find detailed video explanation
how to build your personal calendar:
Simple ULE module
We have discussed earlier how to create a ULE model. If you plan to work with several ULE models at the same time, we recommend to use the "Simple ULE" module.
Let us assume we are creating a model to explore the effect of the Sun ingressing any sign of Zodiac and making aspects to other planets. In order to do that, two ULE events need to be created: L1 - the Sun ingress to the signs, and L2 - the Sun making aspects:
Then we usually would click "Calculate" ULE events. Do not do that if you plan to create another model. Instead, click "ULE" button as shown below:
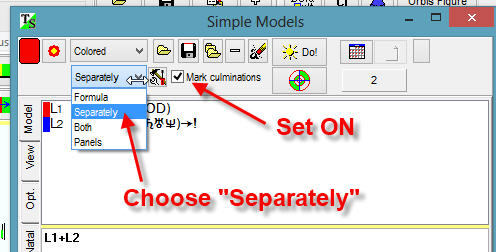
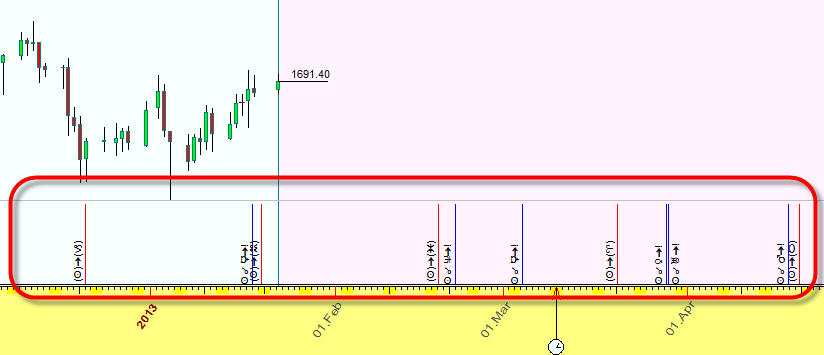
The program opens "Simple ULE" module with these two ULE events. Select "Separately" option from the drop down menu and check the "Mark culminations" option:
The two events that form the model will be displayed in the Main screen on one panel:
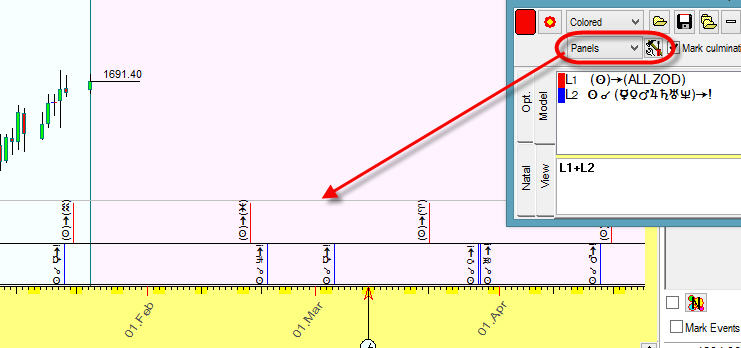
They can also be shown on different panels (one for ingresses and one for culminations) if the "Panels" option was selected:
Thus you can run several "Simple ULE" modules for different models. Each model will be shown on a separate panel of the Main screen. In the screenshot below there are three models: green - declination index, red - tidal force and Sun aspects:
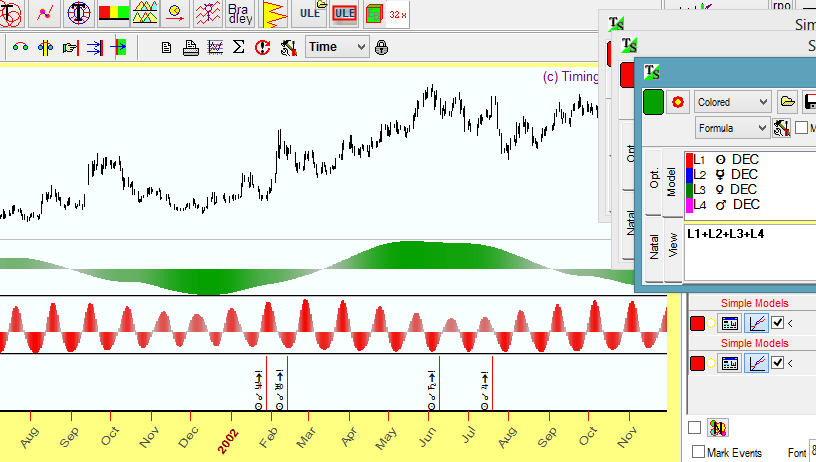
The description of each model is provided in a corresponding Simple ULE module where it can be edited. These are found on the right side of the Main Screen.
Fundamentals events
There is a special category of ULE events - manually defined events that we call Fundamentals. In ULE Editor they are here:
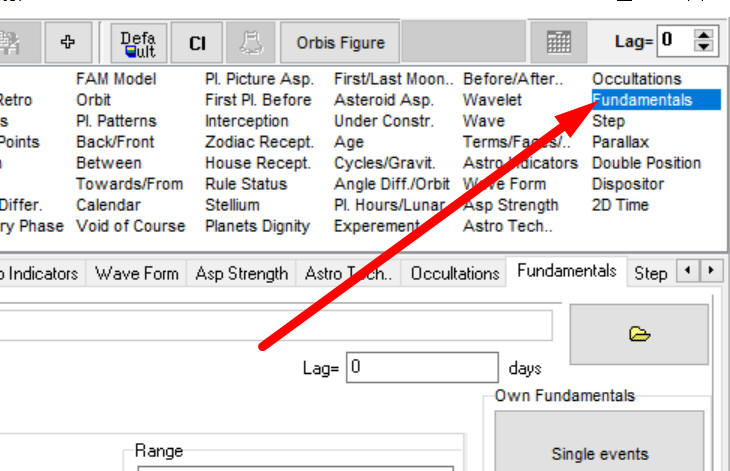
There are two categories of Fundamental ULE events in the program:
1) Time Set: this is data recorded over some time period. As an example, it can be measurements of temperature in Toronto day by day. Another example would be Sunspot activity data. It has been recorded for almost 200 years.
Here is how to build Time Set Fundamentals Event:
Suppose we have a file with tidal force data for Bern, Switzerland calculated twice per hour. This is a part of that file:
12/31/1999 23:59:59 0.002
1/1/2000 0:29:59 -0.014
1/1/2000
1:0:0 -0.030
1/1/2000 1:29:59 -0.044
1/1/2000 1:59:59 -0.056
1/1/2000
2:30:0 -0.066
1/1/2000 2:59:59 -0.074
1/1/2000 3:29:59 -0.079
1/1/2000
4:0:0 -0.082
1/1/2000 4:29:59 -0.082
1/1/2000 4:59:59 -0.082
To create Fundamentals ULE event for this Time Set, run Timing Solution, download and open the file Bern_Tidal.txt in a regular way (i.e. choose this file and click "Load" buton):
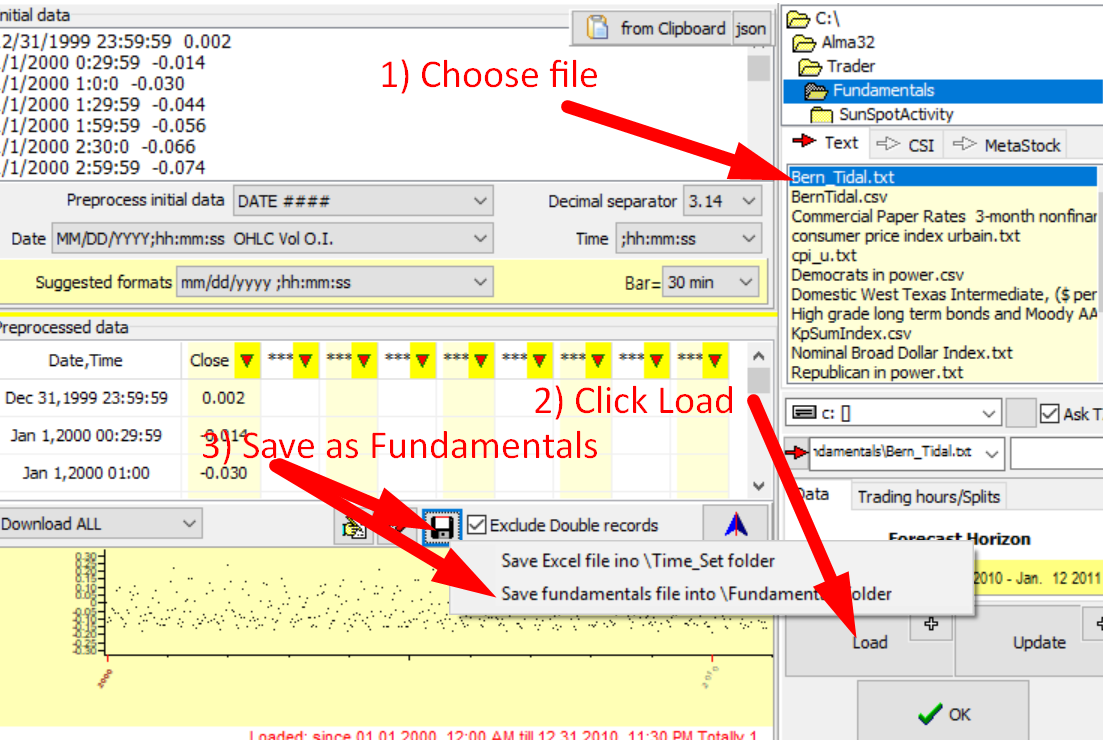
IMPORTANT: make sure that the correct time zone is used in your Time Series and choose that time zone when you download the file. If Universal time is used, choose GMT time zone.
Click "floppy disc" button, and in the popup menu choose "Save fundamentals ..." Let's call it BernTidal.csv file.
Now open that file in ULE Editor:
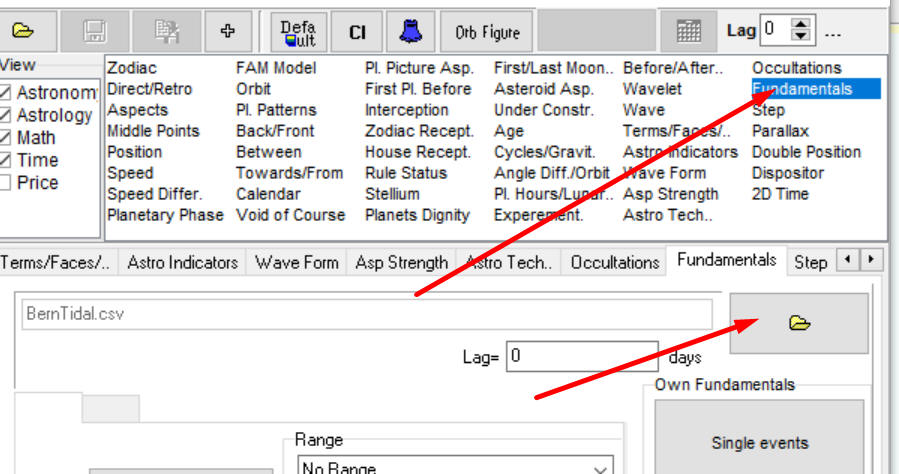
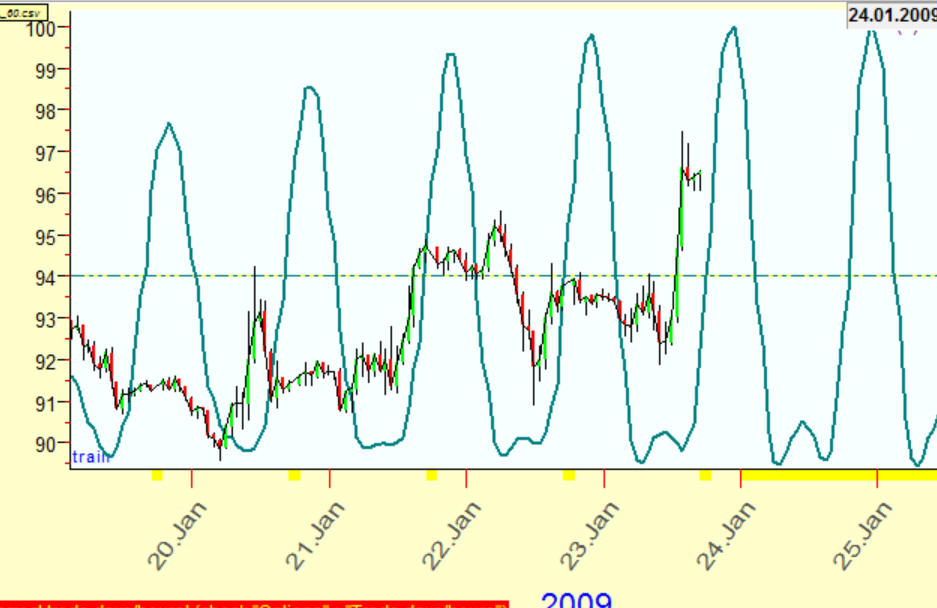
Click "Calculate", and Bern tidal force graph will be shown together with the price chart (crude oil in the example):
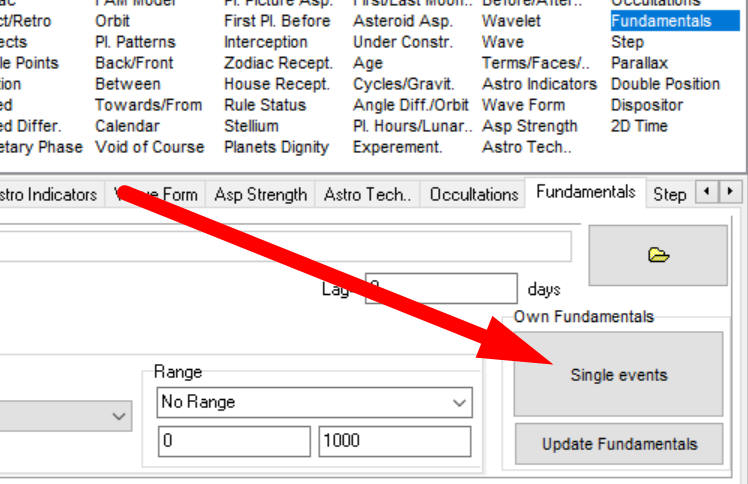
2) Single Instantaneous Event: this is a category of fundamental events that do not occur daily. Some examples are: the dates when Feds announce rate changes or USA election dates. These events affect the stock market somehow, and we can estimate this effect. Let us estimate the effect of USA election, when the Republicans were elected, like at the latest election 11/8/2016. We have downloaded a weekly chart for SNP 500 since the year 1950. Now open ULE editor, and in "Fundamentals" tab click this button:
Enter all the dates since 1950 when Republicans were elected in the new window:
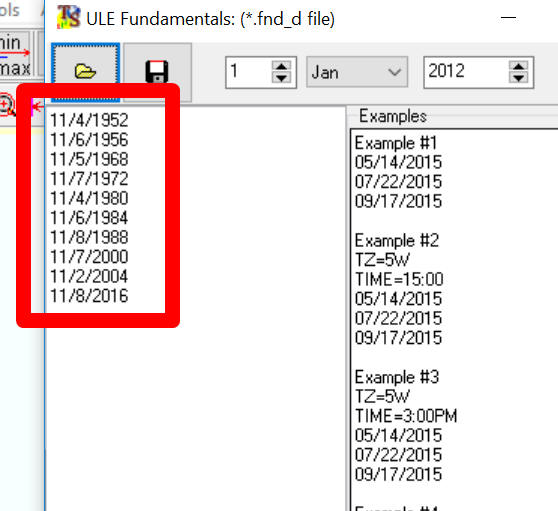
The format MM/DD/YYYY is used here. You can also specify the time as well, like this:
05/14/2015 10:25AM
and point out the time zone for that moment in time:
TZ=5W
05/14/2015 10:25AM
Now click Save button to save these dates into some fundamentals file:
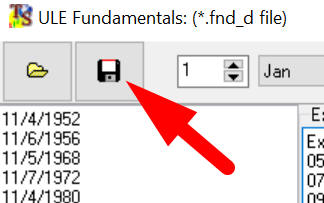
In our case it is the file USARepublicansElected.fnd_d.
Now open this fundamentals file as usual:
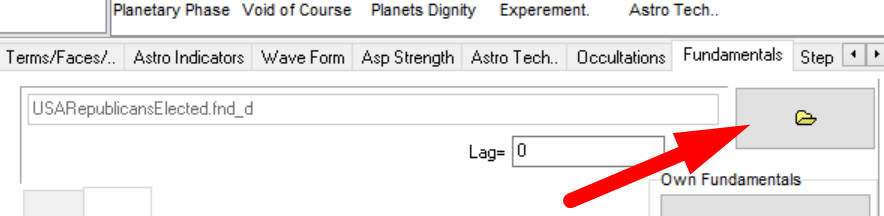
Click "Calculate" button to get the dates when Republicans were elected together with SNP500 chart:
To estimate the effect of this political event, you can use Efficiency Test module as shown below:
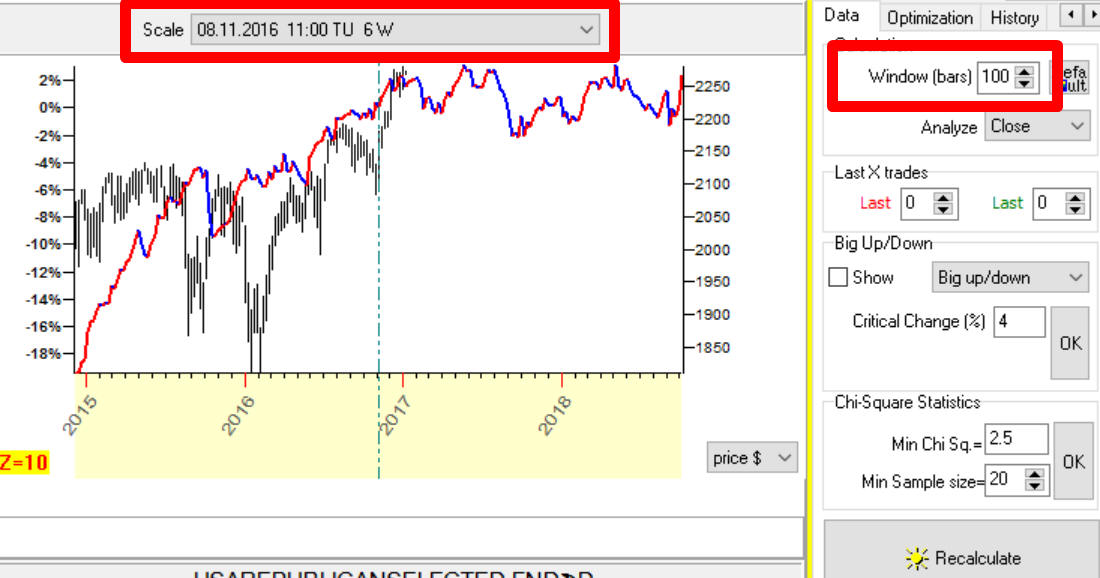
Here the Window parameter is set to 100, i.e. 100 weeks. In other words, this efficiency test shows the price movement plus minus 100 weeks (plus minus two years) around the election dates. Also we set the scale to the last election date (November 8, 2016); in this case the time scale is displayed, Accordingly, the Efficiency Test shows the projection line, averaged movement of SNP 500 around the dates when Republicans were elected.
More advanced ULE formulae
Timing Solution software allows to build more advanced ULE formulae. Let's consider two examples:
Example #1: Suppose we need to find periods when Mercury and Venus are BOTH retrograde OR three planets, Mars, Jupiter and Saturn, are retrograde as well.
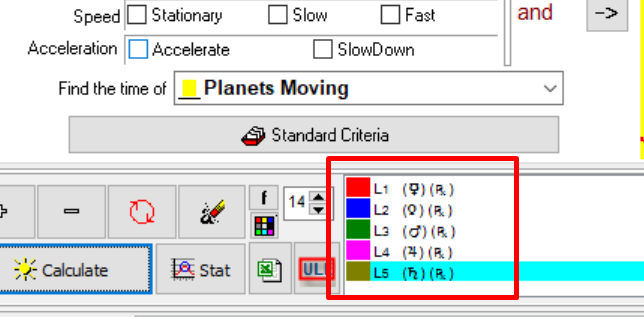
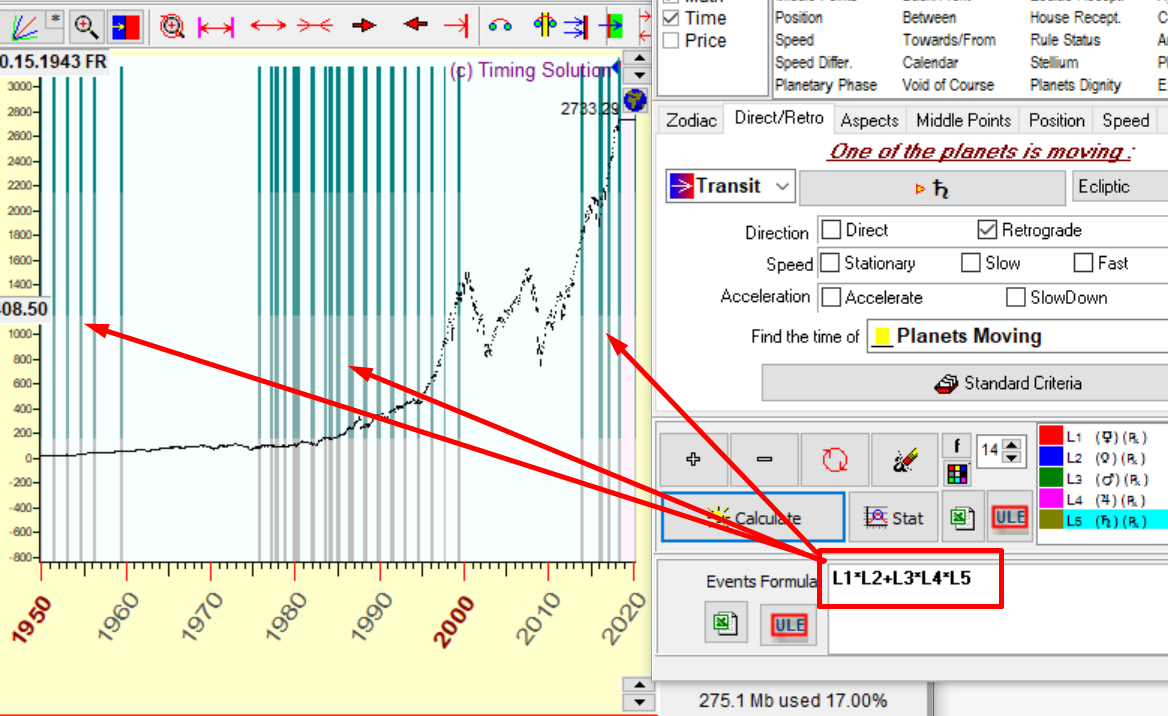
It means that we need to create five ULE events: L1- Mercury retrograde, L2- Venus retrograde, L3- Mars retrograde, L4- Jupiter retrograde and L5 - Saturn retrograde. Here they are:
Now we are ready to build the final formula:
L1*L2 - this is the formula for Mercury and Venus both retrograde;
L3*L4*L5 - all three planets Mars, Jupiter and Saturn are retrograde
This is the final formula; it describes moments when at least one of these two conditions L1*L2 or L3*L4*L5 is taking place:
L1*L2+L3*L4*L5
(Mercury and Venus both retrograde) OR (Mars, Jupiter and Saturn all three planets are retrograde)
Look how this ULE formula works in time:
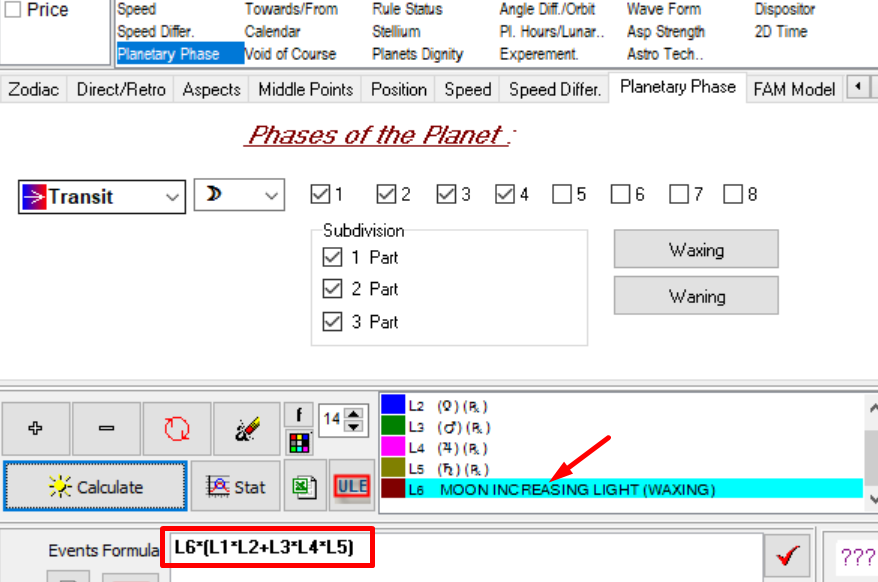
Example #2: Let us add one more condition: we are looking at advanced retrograde zones from Example #1 plus the Moon should be waxing for all these zones.
To do that we add one more event L6- Moon waxing (increasing its light).
The final formula looks:
L6*(L1*L2+L3*L4*L5)
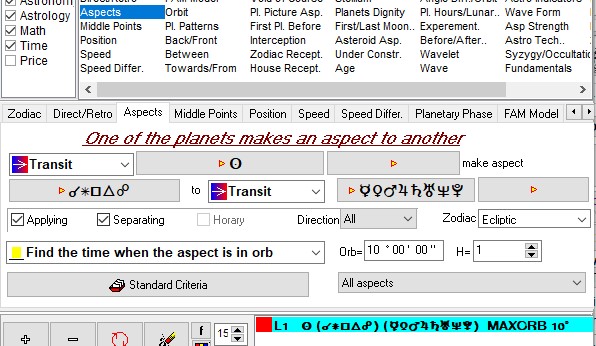
Example #3: It shows how to use NOT function in ULE formula. Suppose you need to find all New Moons when Sun does not make aspect to other planets (from Mercury to Pluto), the orb is 10 degrees. There are two events to consider. The first one, New Moons, is easy. Let us consider the second event,the Sun aspects. Start with creating a regular ULE event, L1="Sun makes aspect to other planets with orb=10 degrees):
To find the periods when Sun does Not make aspect use this formula: Not(L1):
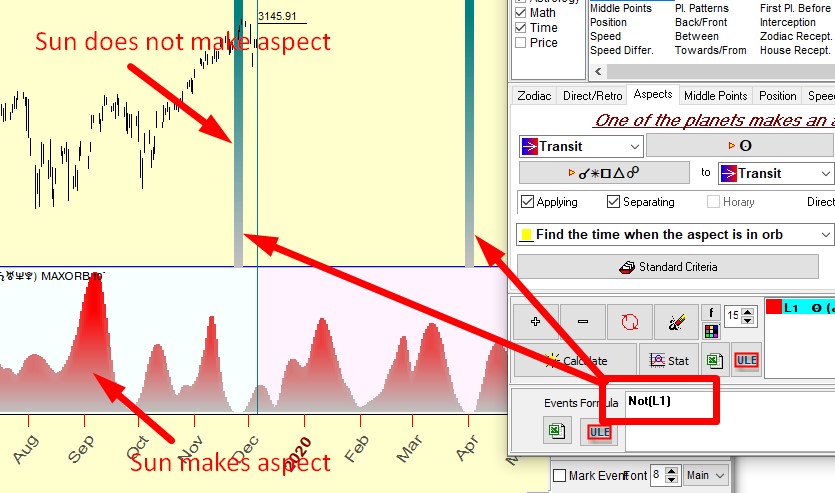
Due to the wide orb, the most of time the Sun makes aspect to some planet. The periods when the Sun does not make any aspect are very rare, taking place once in several months. We got these periods using Not function.
Now create the second ULE event (the first one in the initial request), L2="New Moon". Now the final formula looks this way: Not(L1)*L2 - two these events meet together, "the Sun free of aspects" and "New Moon":
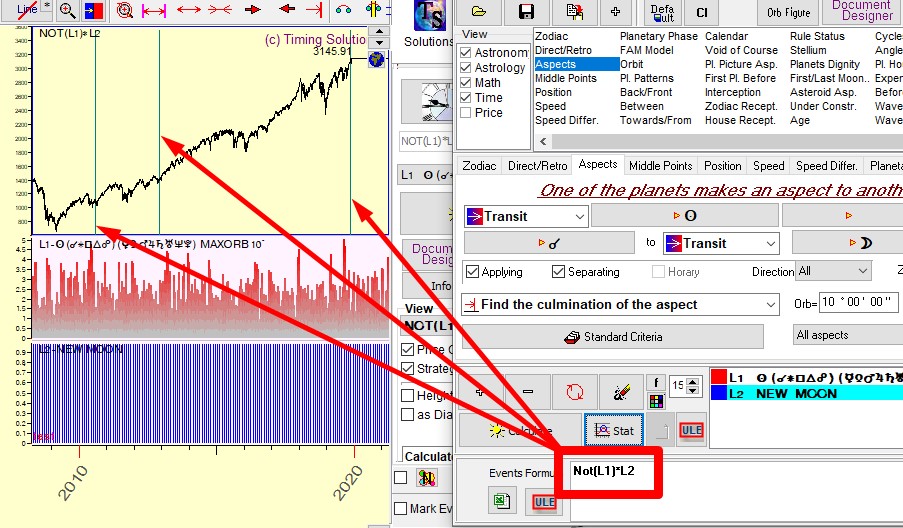
This phenomenon took place recently in November 26, 2019. Prior to that. it occurred in the years 2010 and 2013.
More information about ULE formulae is here.
More ULE events examples
Below are examples of ULE forms for different events. They were created based on questions from Timing Solution users. You may use these samples as references.
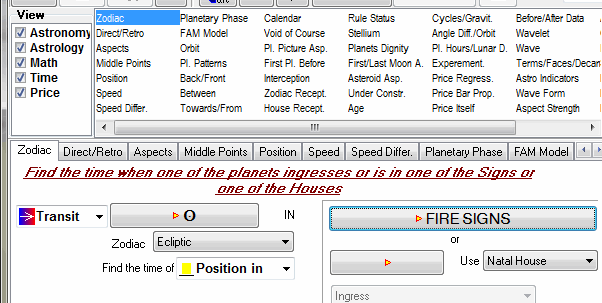
Transit Sun passes Fire signs:
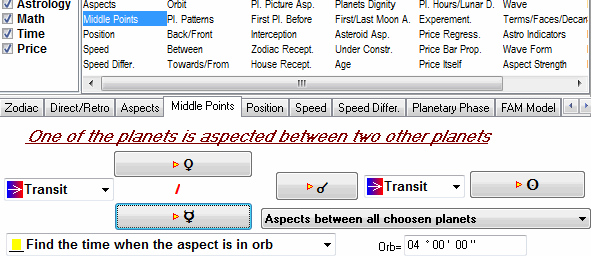
Transit Sun passes the middle point between transit Mercury and Venus:
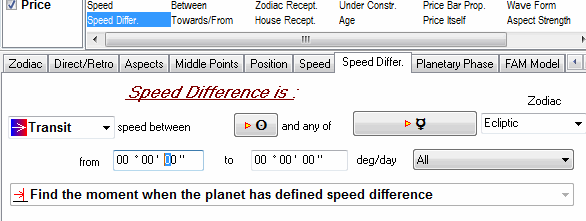
The difference between the speed of the Sun and Mercury is zero (i.e the Sun has the same speed as Mercury):
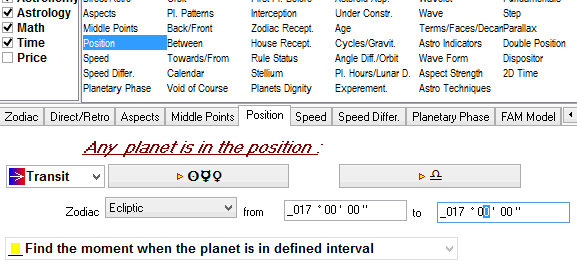
The Sun, Mercury or Venus passes 17th degree of Libra:
The angle separation between the Sun and Jupiter reaches 225 degrees:
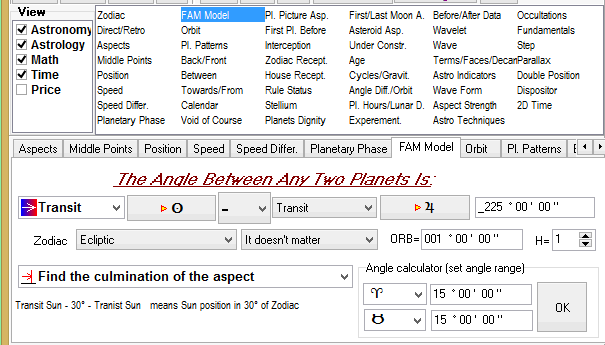
The Sun passes interval 2 degrees Scorpio 13 degrees angle Capricon:
To build this event we recommend to use FAM model. In astro calculator set the interval 2 degrees Scorpio - 13 Capricorn and click "Ok" button there.
.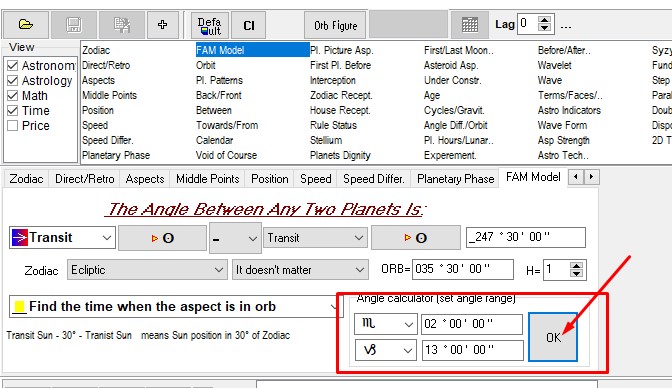
The program calculates this event considered as the Sun hitting the angle of 247degrees 30 Minutes (=4deg30min Sagittarius) with the orb 35 degrees 30 minutes.
This concludes the ULE lesson for Timing Solution. This is a very powerful tool that can be used to test any event and see if it has any effect on any financial instrument.