Q Spectrum
Update April 8, 2016
ã2016 Q Spectrum Timing Solution. All rights reserved.
Why Q Spectrum?: Q Spectrum versus Classical Spectrum
This is a very brave and bold step to introduce the alternative to well known classical math techniques, but I'll do that. Let me explain why. All examples will be explained in detail, so anybody will be able to replicate these calculations.
Example #1:
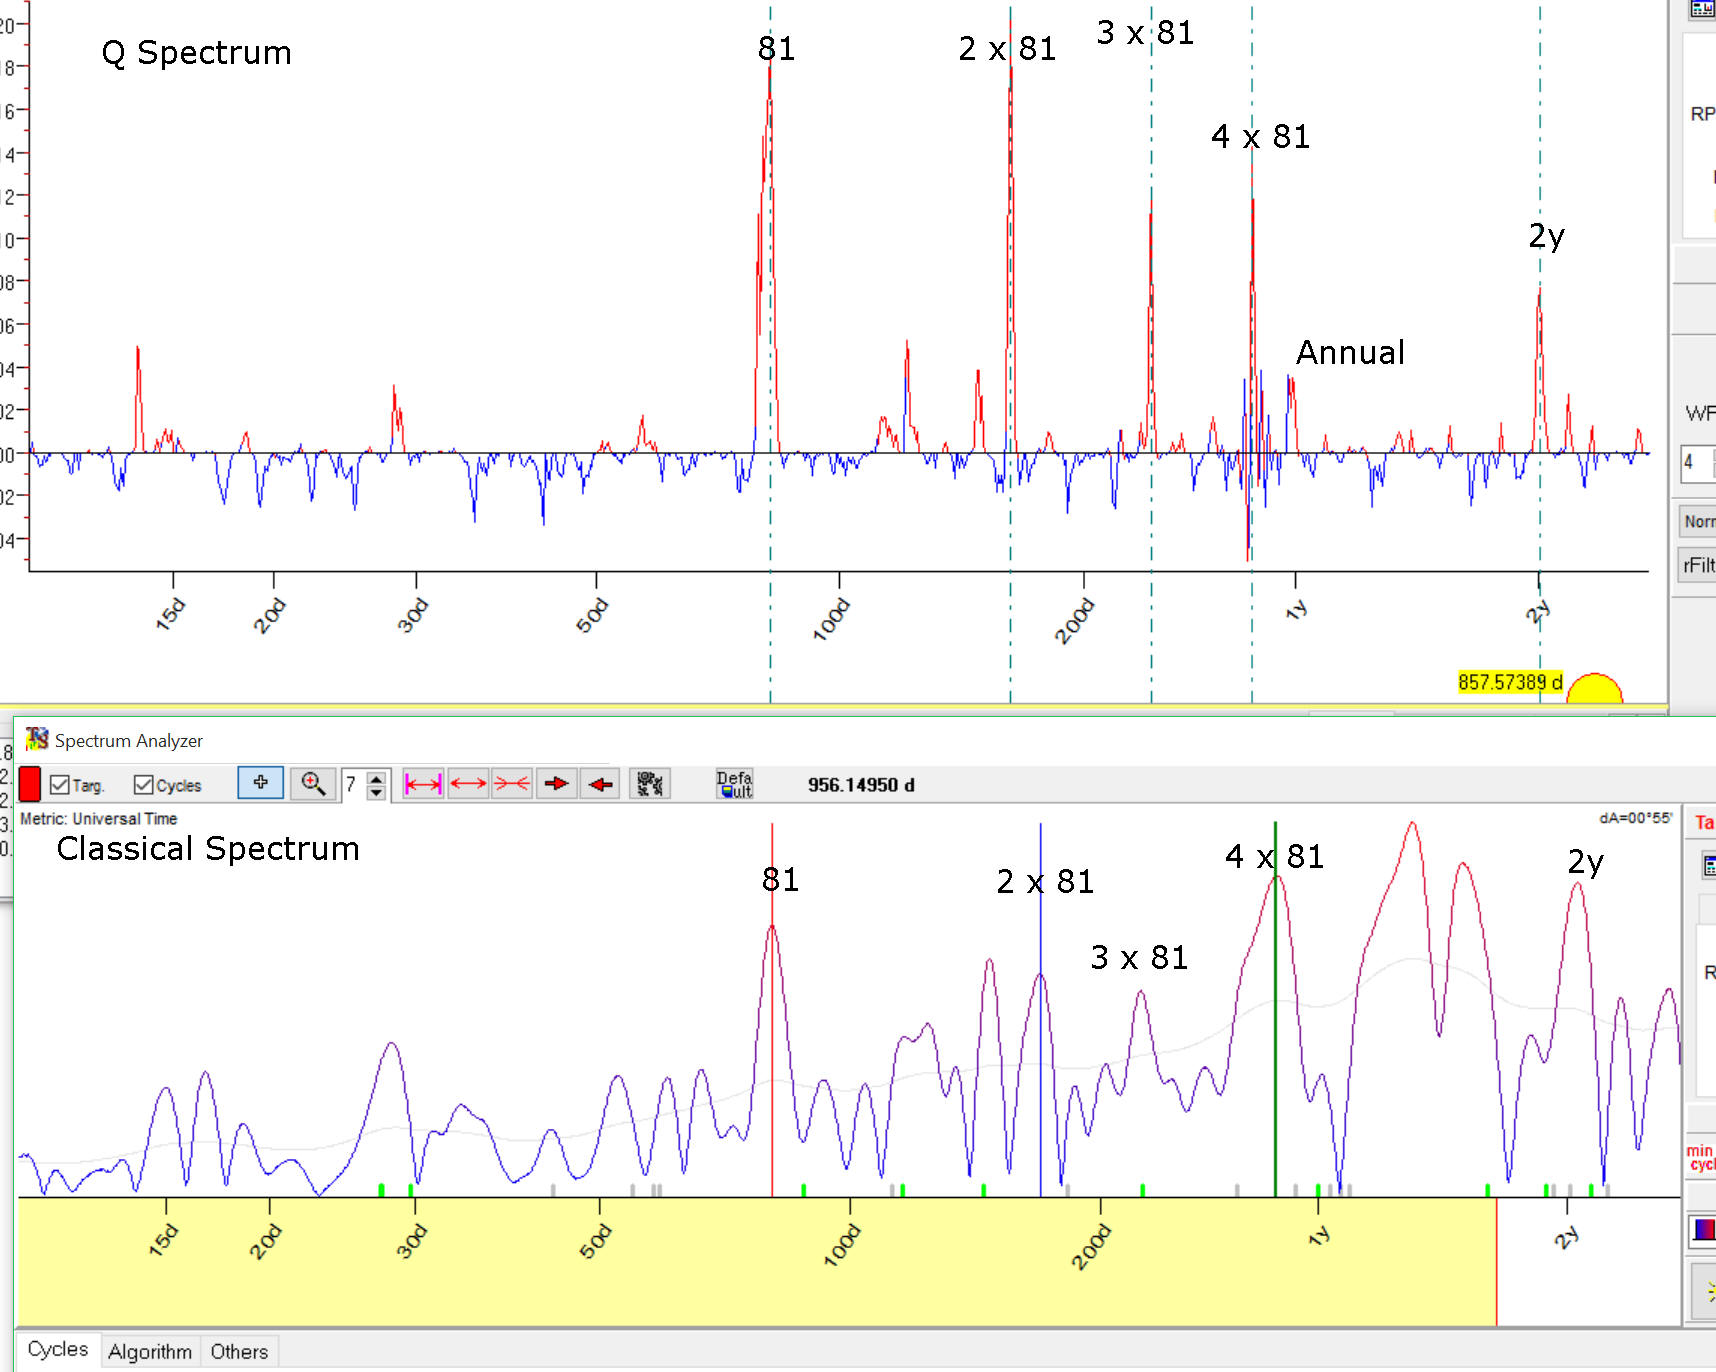
I have downloaded S&P 500 since 1950 and simply added 81 calendar days sinus wave to this data. Techically this price chart looks very similar to S&P 500 chart, though a presence of a cyclical wave is slightly visible. Now I run two modules in Timing Solution software that reveal cyclical waves in data: the top chart - Q spectrum module, the bottom chart - classical spectrum:
As you see, both modules caught that 81 days cycle: there are 81 days peaks there and overtones 2x81, 3x81 and 4x81 days cycles. But Q spectrum peaks are much more sharper, much more certain.
It is much more easy to decide what cycle is important using Q spectrum. Classical cycle is much more fuzzy/uncertain.
Why does it happen? Is it possible that there is some bug in the code that calculates classical spectrum? No, this is not a bug, this is specific of financial data. You see, classical cyclical analysis mostly has been developed for permanent cycles, cycles that work the same manner all the time. In finance we have persistent cycles, the cycles that are not present always, cycles that appear as being born, then living for a while and finally disappear. This is the fact that we cannot ignore while working with financial data. In the example above I set the length of cycles' life as 12 full cycles, in other words I assume that 100 days cycle (just as some example) lives for 12x100=1200 days or our 81 days cycle lives for 12x81=972 days. The main specific of financial data we have to catch the cycle that lives within a certain time span.
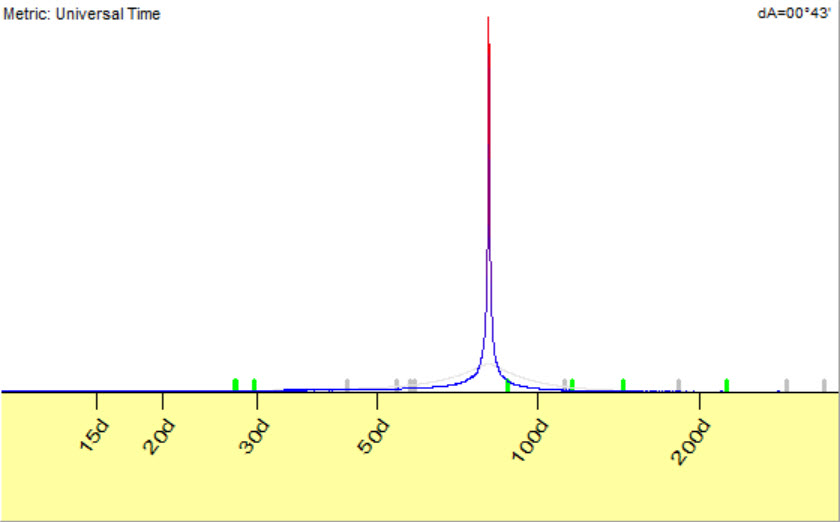
If we assume that this 81 days cycle works the same manner since 1950 and calculate classical spectrum (to calculate spectrum that uses the WHOLE available price history, not last 12 cycles), we get this practically ideal periodogram that reveals 81 days cycle with the highest accuracy:
In finance, we do not have ideal cycles. Moreover, classical cyclical analysis is oriented to interpolation, i.e. we are looking for some sinus wave that fits our data the best. Algorithmically it works this way: we examine 100 days cycle; special algorithms find the best amplitude and phase for this 100 days cycle. We use the amplitude as a measure of importance of this cycle. After that we try 101 days cycle and calculate the amplitude for this cycle. This is a very simplified explanation, but it gives you a general idea how classical spectrum works. The cycles with highest amplitudes are more important, they fit to our price chart the best.
Analysing finance data, we solve a different task: we try to build extrapolation model, we try to find a cycle that forecasts the future the best way. Briefly: in Classical cycle we are looking for the best curve fitting for all available price history while Q spectrum is more concentrated on a forecast ability of the cycle, it looks for the cycles that "see" the future. I am working with financial mathematics more than 20 years already, and I can tell you that this nuance totally changes the math. You can take Q spectrum as a method that incorporates in one box Fourier transform and Walk forward analysis.
Example #2:
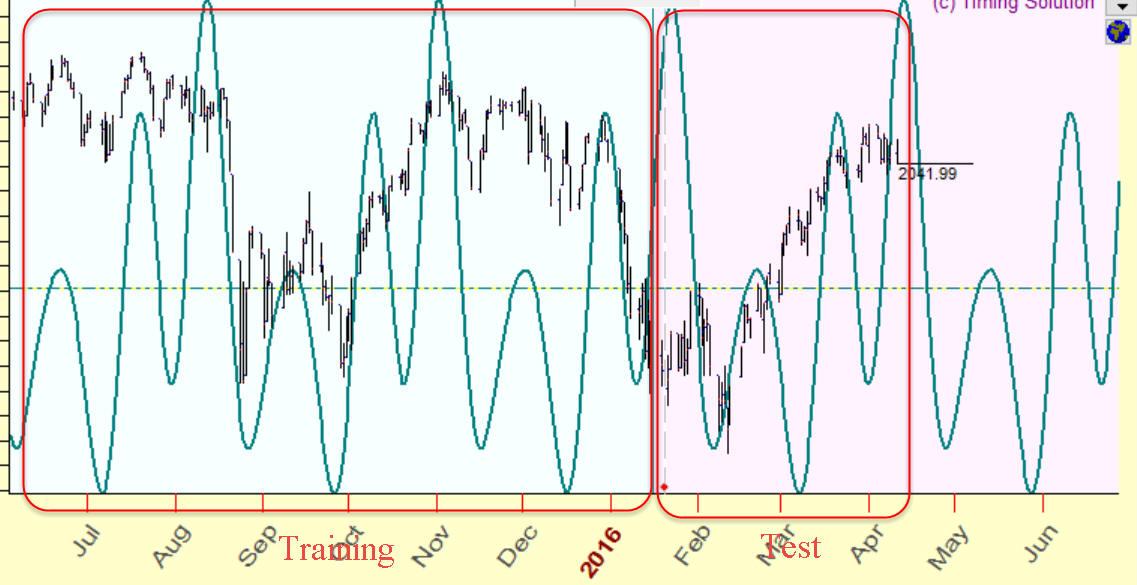
I know for sure that Annual cycle works. Many traders use it, there is a special trading platform based on Annual cycle's idea. For example, this is Walk forward analysis for Annual cycle, it shows how this cycle worked within the last 20 years:
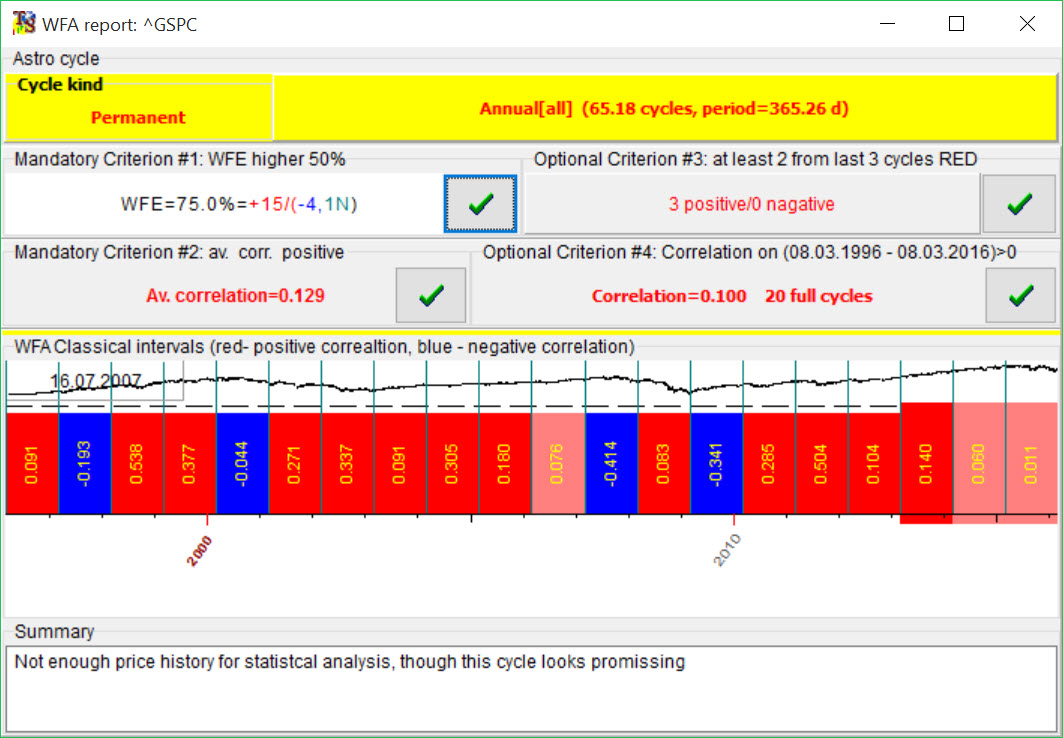
The red bars show the years when Annual cycle worked good enough (positive correlation), blue - not good (negative correlation).
It was a big problem for me for many years, the fact that classical spectrum does not show this cycle at all. With Q spectrum, this problem has been solved. Here are Q and Classical spectrums for S&P500:
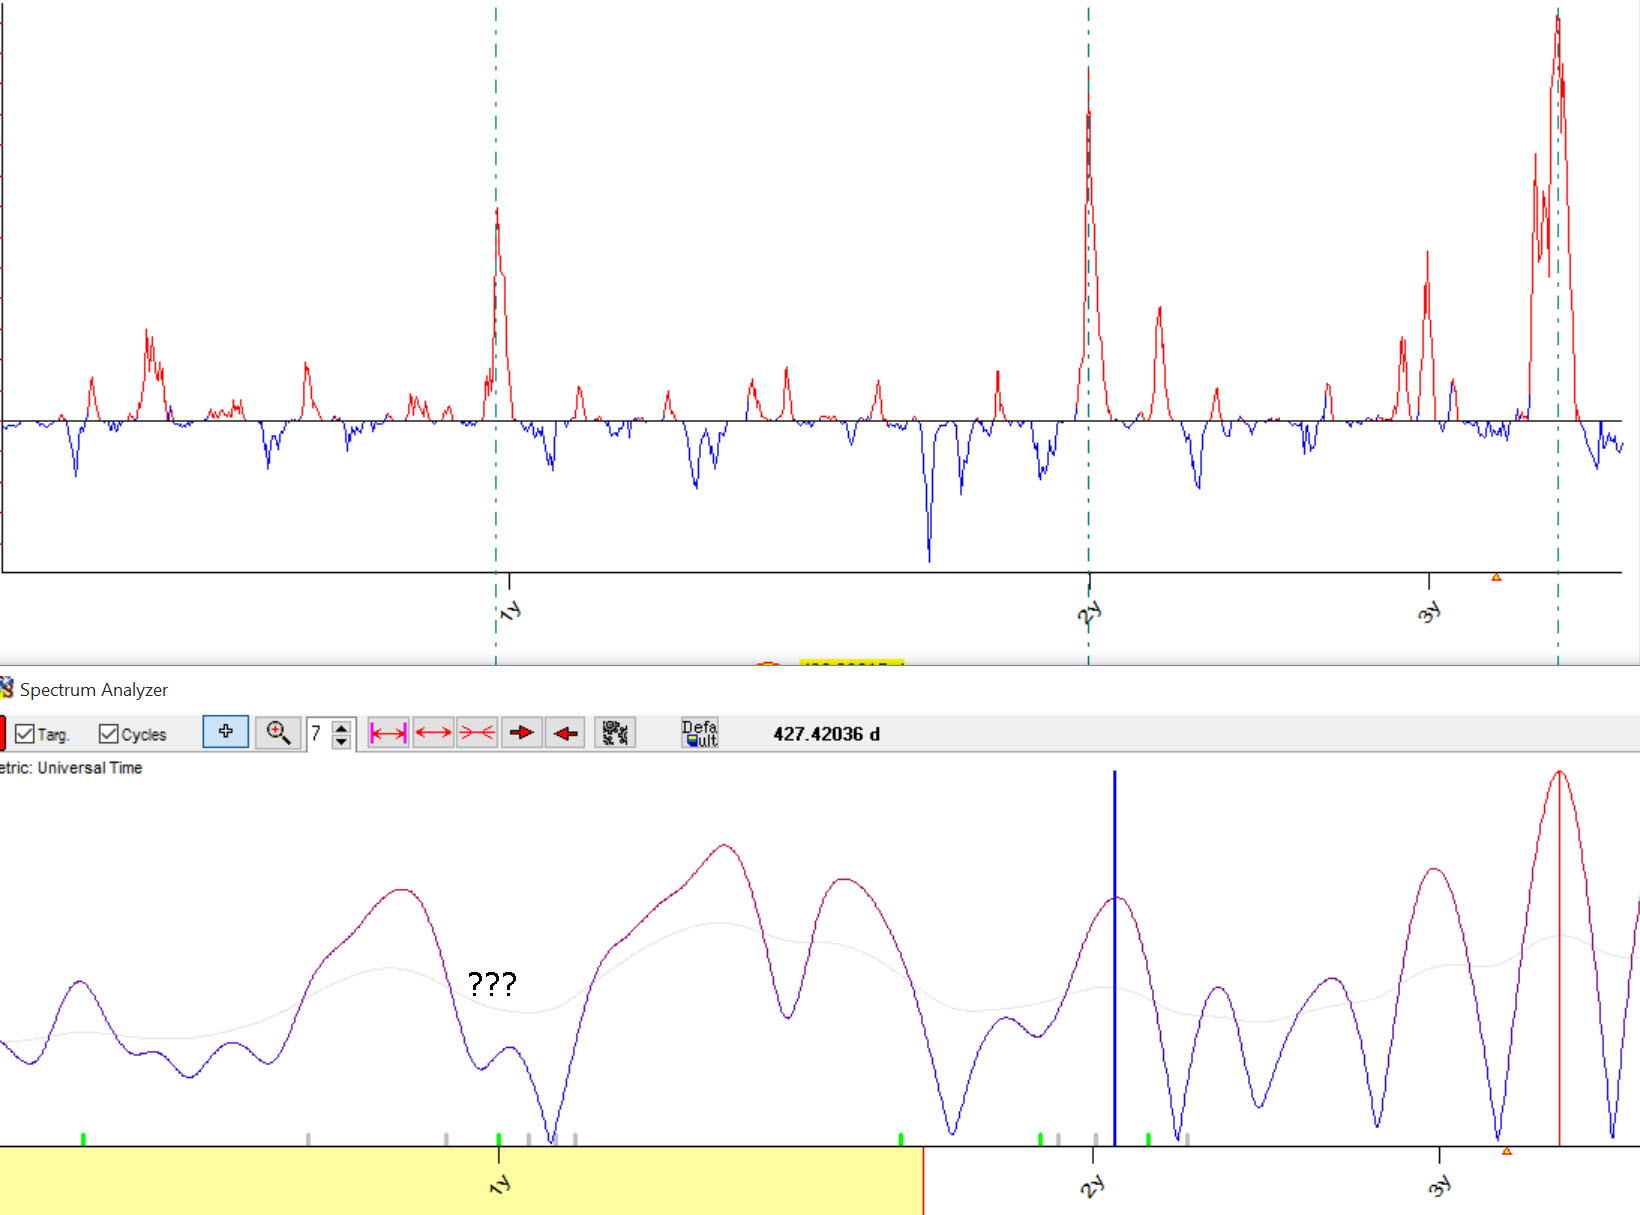
Such a big difference between these charts is caused by different targets that Classical and Q cycles have. If we deal with interpolation (i.e. curve fitting), we get more fuzzy/uncertain spectrogram. Look at the classical spectrum, peak for two years cycle:
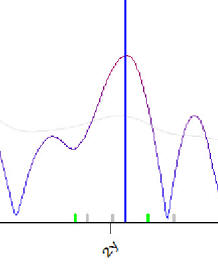
It is very wide. It means that we can increase/decrease the period of this cycle for just one week, nothing drastic is going to happen, This modified cycle will still interpolate the price history good enough as it is not crucial for curve fitting.
Now look at Q spectrum:
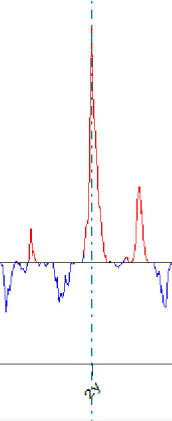
The peak for two-year cycle is very sharp here. It means that if we change its period a little bit, the value of spectrum (Y coordinate) will drastically drop as well. It means that forecasting ability of this cycle will drop drasticaly as well. In other words, extrapolation/forecasting as a target makes spectrum more precise.
Here you can download S&P 500 chart with added 81 days cycle: SNP_plus_81days_wave.csv
What Q spectrum does
Q spectrum module conducts for each cycle Walk Forward Analysis. In other words, it estimates the forecast ability for each cycle. This is not a curve fitting, we are not interested here in finding out how the cycle %X explains some past data (classical spectrum does it), we estimate how this cycle forecasts the future. Comparing to classical spectrum, Q spectrum evaluates revealed cycles with Work Forward Analysis technology.
Technically Q spectrum works this way: suppose we examine 80 days cycle. We break price history in two intervals, training interval (in sample) and testing interval (out of sample). We calculate the projection line based on 81 days cycle using the price history on testing interval. It is something like that, 80 days cycle with 4 overtones:
After that we estimate how this cycle forecasts the future, how it works on testing (out of sample) interval. In case of classical spectrum, we calculate the strength of this cycle on training interval, we watch how 80 days cycle interpolates the price history on training (in sample) interval. In case of Q spectrum we do not care how this cycle works in the past (on the training interval), we are more concentrated on the fact how it works in the future (=extrapolation, testing/out of sample interval).
Sample size parameter:
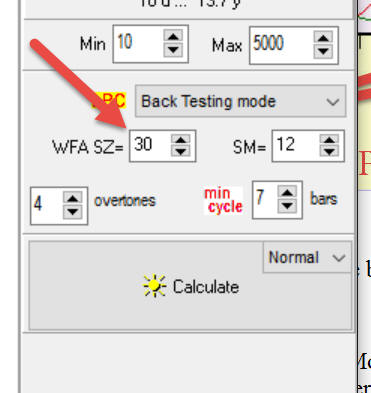
shows how many time we examine cycle this way.
How it works
This module is very similar to what the users already used to. It works pretty much the same as classical well known Spectrum module in Timing Solution. You have to specify "target" that is the index you plan to analyze. This is necessary due to the nature of cyclical analysis that deals with harmonic functions (sinuses and cosines). For that reason we have to preprocess data before analysis. In other words, we have to remove the trend. In most cases we use relative price oscillator (last time known as PPI - percentage price oscillator). After that click "Calculate" button,and your Q spectrum is ready:
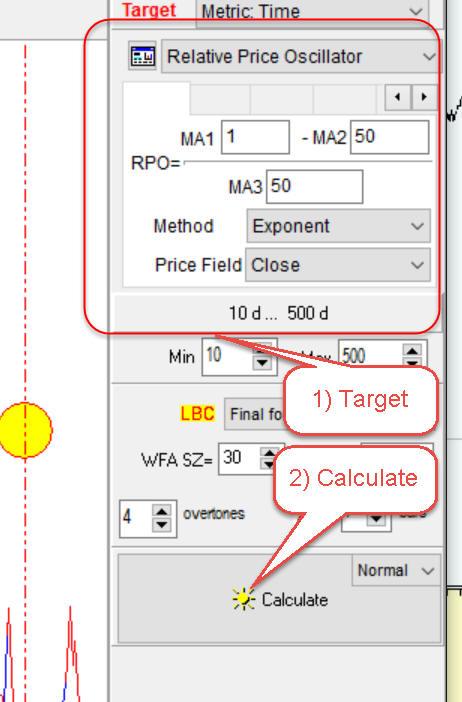
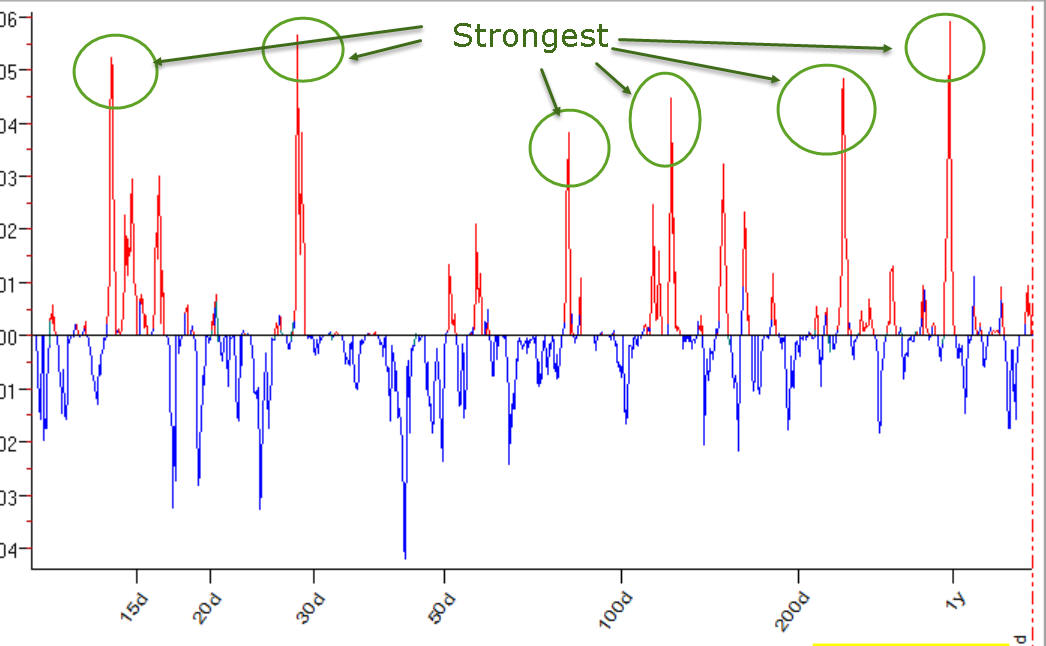
Now (similar to classical cycle analysis) the most important cycles are presented by the highest and narrowest peaks on the periodogram:
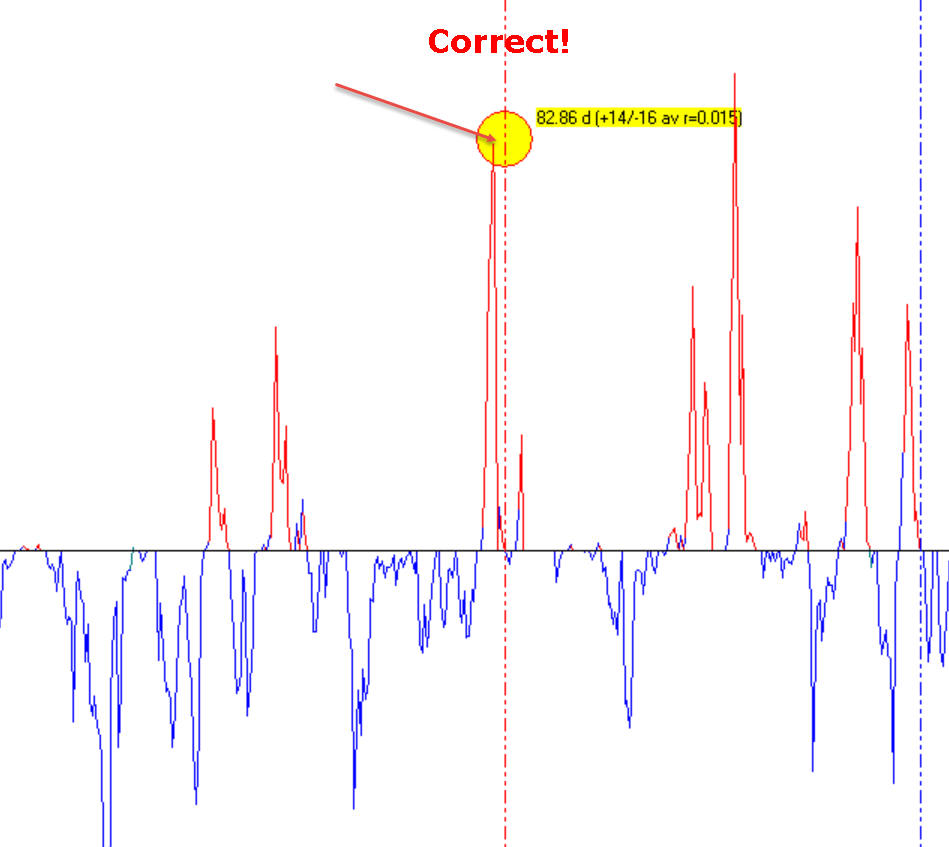
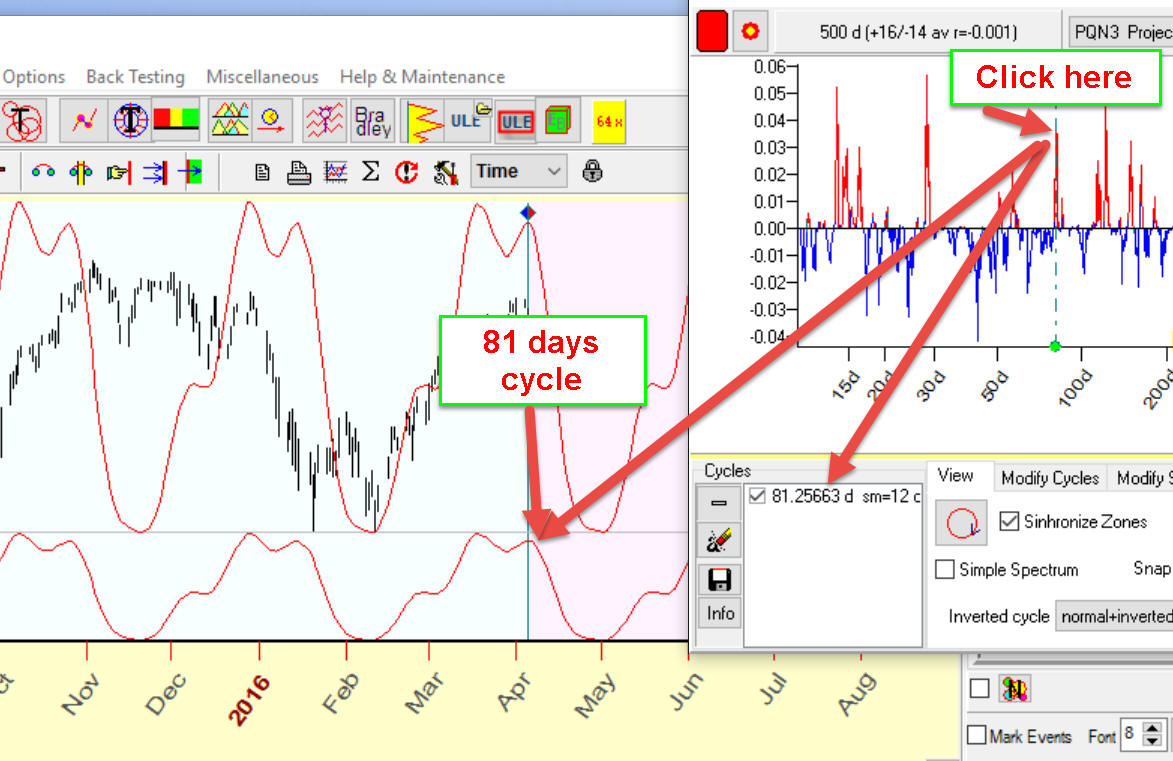
You may choose any cycle making a mouse click around this peak. There are some nuances in picking cycles in Q spectrum:
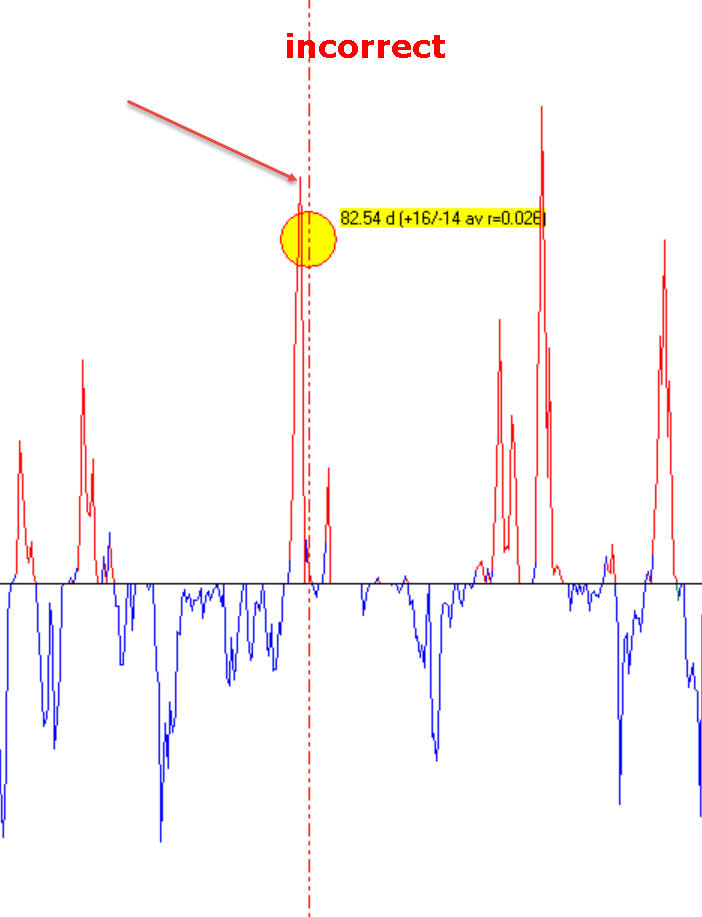
- pay attention while moving the mouse cursor over the spectrum chart; it marks the current cursor's position by a small yellow circle. When you choose any cycle, the cursor should cover this peak, like it is shown here:
not this way:
- another nuance is: while you move the mouse cursor over Q spectrum chart, it also displays the vertical lines that correspond to double, triple etc. periods. Look at this picture below; for 120 days cycle it also shows vertical lines that correspond to 240, 360 and possible 480 days cycles:
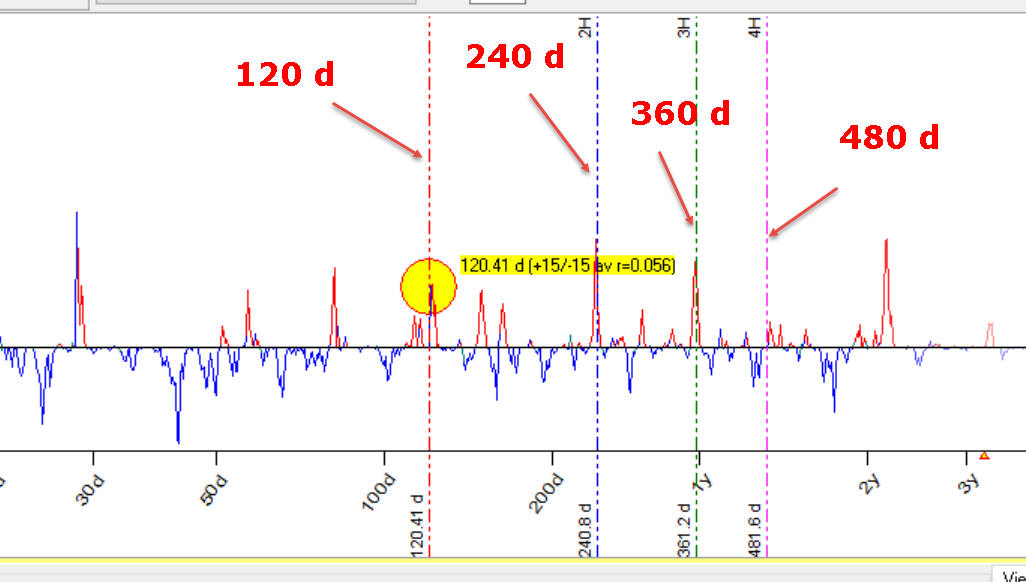
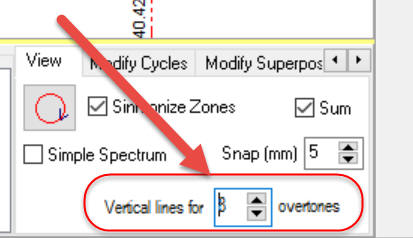
This is a very strong confirmation when the cycle with period X is also confirmed by 2 x X, 3 x X etc. periods cycles as an example above. You can set the amount of displayed overtones here:
As in classical cycle analysis, when you pick up any cycle the program sends this cycle to the cycle box, and in the Main screen you can see how this cycle works. In example below 81 days cycle has been chosen, you can see it in the cycle box, and in the Main screen you see how this 81 days cycle works, timing provided by this 81 days cycle:
When you choose several cycles, the program shows the superposition of these cycles overlay of the price chart:
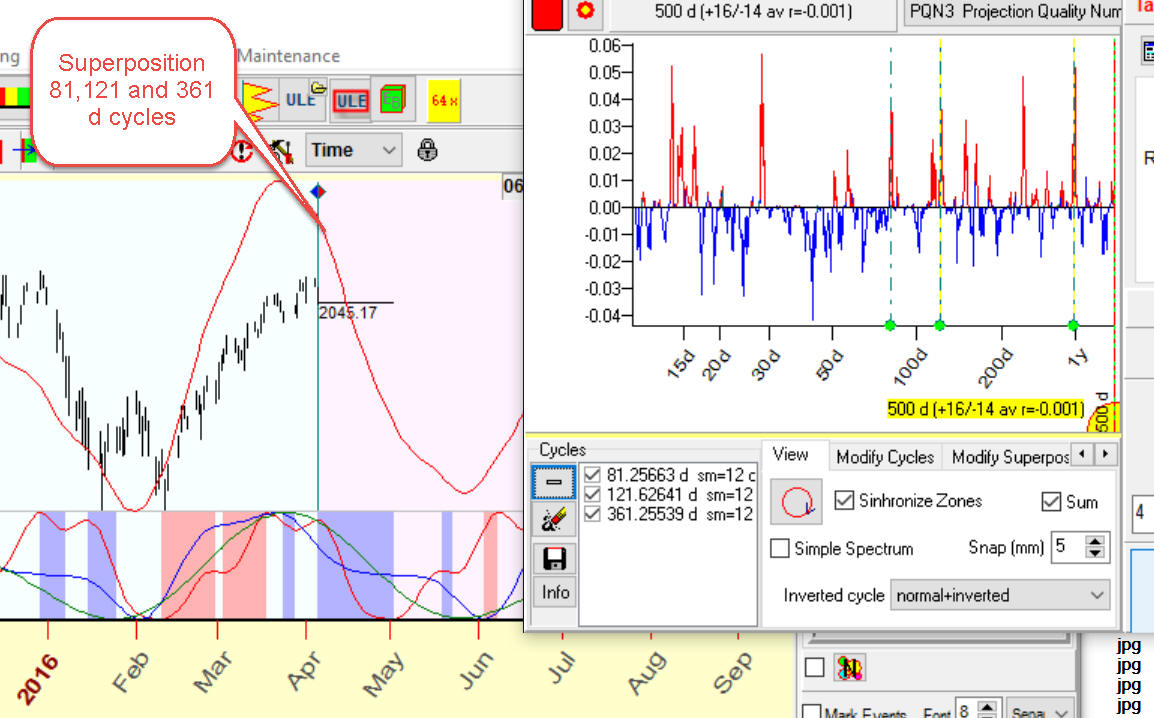
Also it shows synchronize zones. Look at these red and blue zones:
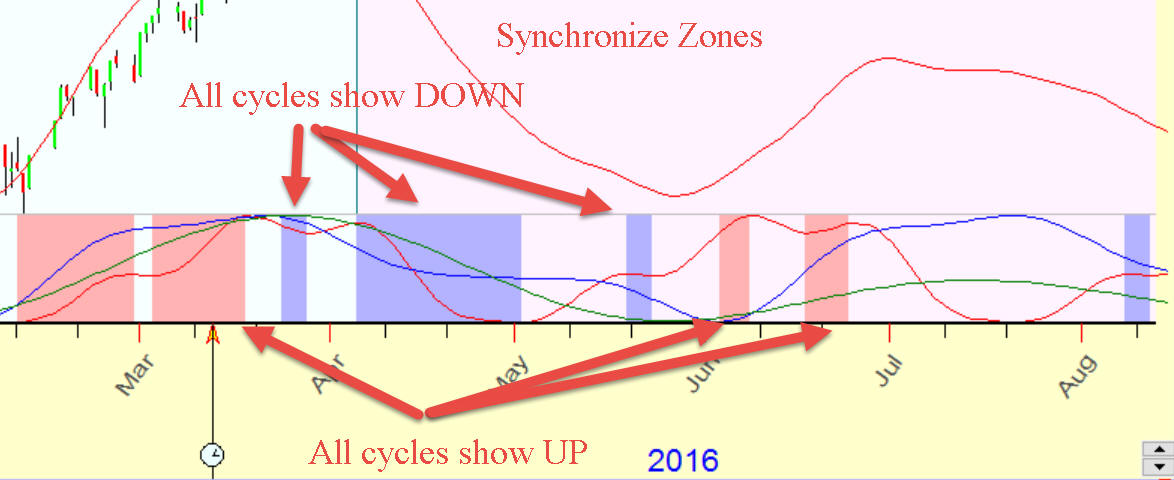
Red zones show the periods when all cycles show up, while blue are the periods when all cycles show down.
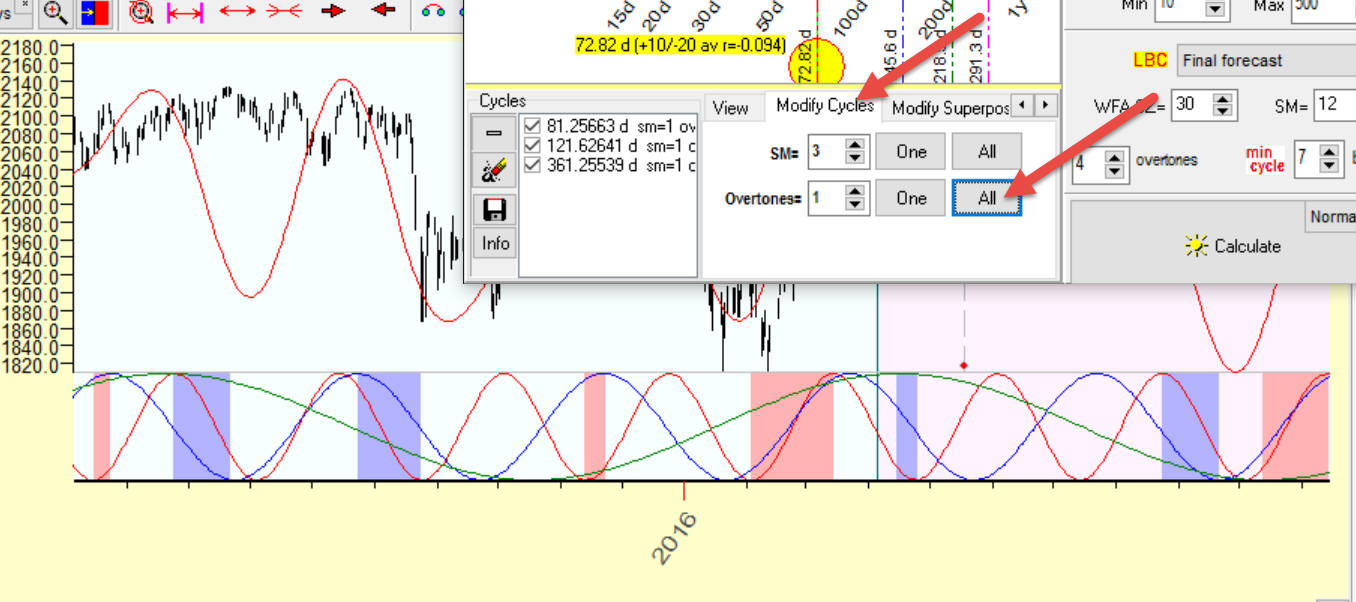
Next step is: we try to play with this/these cycle/s. Open "Modified Cycles|" tab and look at controls there. As an example, we can play with overtones. Let's set amount of overtones to one and click "All" button. The program will recalculate these cycles and provide a summary projection line using one overtone only. One overtone means that the program shows pure sinus wave for this cycle, with the optimized phase to get the best fit to the price. As an example, for 81 days cycle you will get pure 81 days sinus wave, for 121 days cycle - 121 days sinus wave, etc.:
If you set a different amount of overtones (more than one), you will get enriched 81, 121, etc. waves, like these ones:
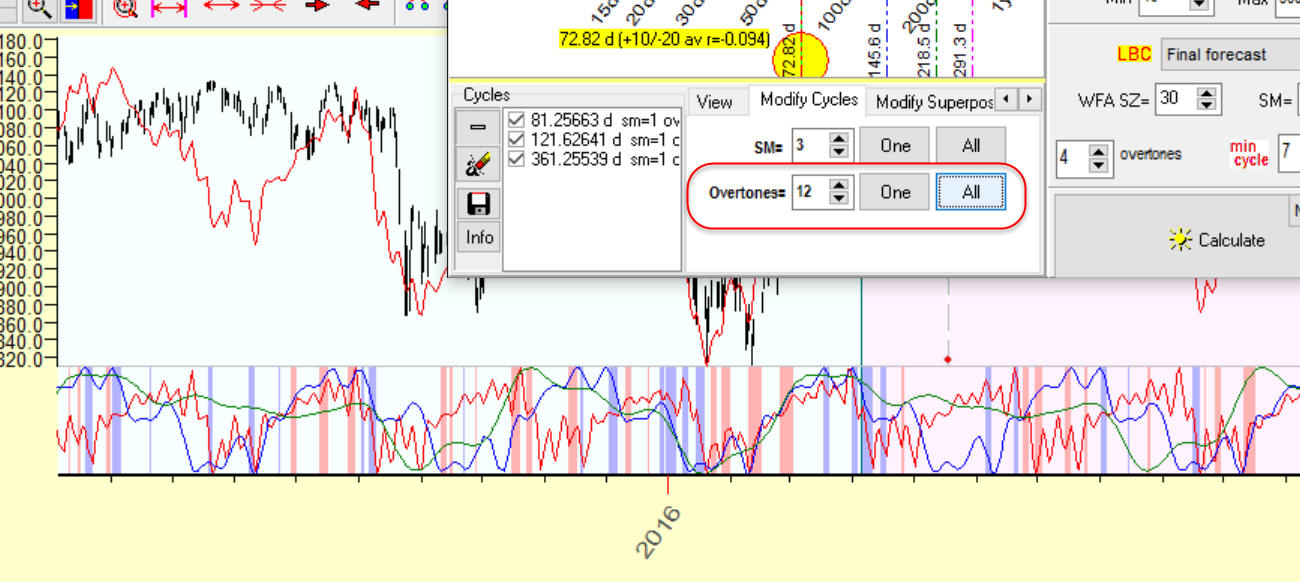
Clicking "All" button, you modify all cycles in the cycle box at the same time, while clicking "One" button you modify one highlighted cycle only.
You can aslo modify a stock memory parameter (SM) for your cycles:

SM corresponds to the amount of full cycles we try to forecast. For example, setting stock memory to 3 for 81 days cycle, we try to make a projection line that forecasts last 3x81=243 days. This is a projection line with the short memory concentrated on the last three full cycles only. If you set SM to 12, you get a projection line that generally works the best way within the last 12 cycles, though the forecast for the last three cycles will be not so good. It is difficult to say what stock memory is better to use, try to set it to 3-5.
Starting December 2017, for any chosen cycle in Q-Spectrum module we provide the additional information - the cycle's tradability. The general idea of this test is applying this cycle for trading. Let me explain how this criterion works.
Suppose we analyze 81.32 days cycle. When you pick a cycle in Q-Spectrum module, the program shows someinformation regarding the tradability of this cycle. It is shown at the end of the information line. Here it is:
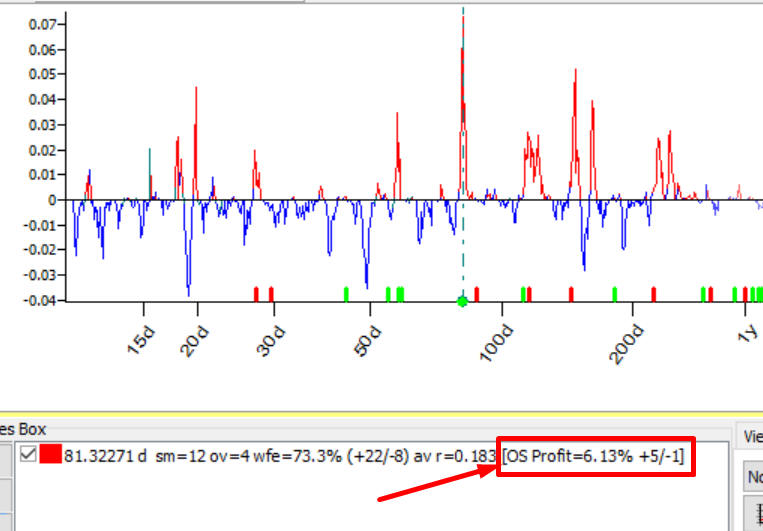
Read this info this way: trading this cycle on Out of Sample (OS) interval, we have got 6.13% profit; the strategy based on this cycle has provided 5 winning trades versus 1 loss (+5/-1).
Now look at some parameters in "Auto Selection" section. You can enable/disable a tradability test there:
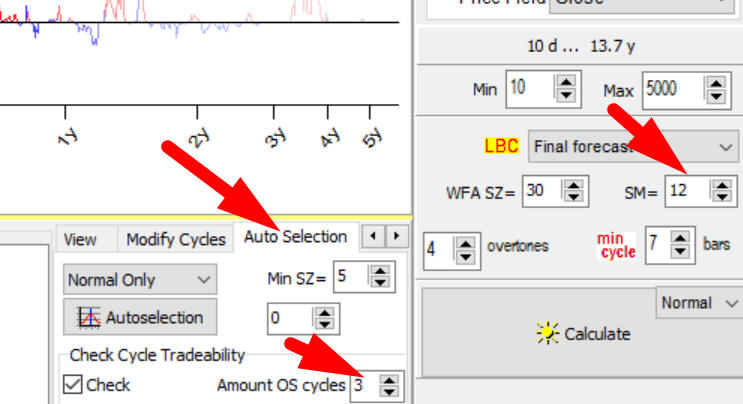
Another important parameter there is "Amount Out of Sample (OS) cycles". By default it is set to 3. The value of stock market memory in this example is 12 cycles.
To analyze this 81.32 days cycle, we have used in total 3+12=15 full cycles, or 15x81.32=1220 days of price history
First 12 cycles i.e. 12x81.32=976 days were used to find predictable zones for this cycle, periods when the price went up or down; we call this interval in sample (IS). The rest of price history i.e. 3x81.32=244 days was used for the verification. We have checked there how this cycle worked on the "unknown" territory; we call this interval out of sample (OS).
Here are these intervals, in sample (IS) and out of sample (OS):
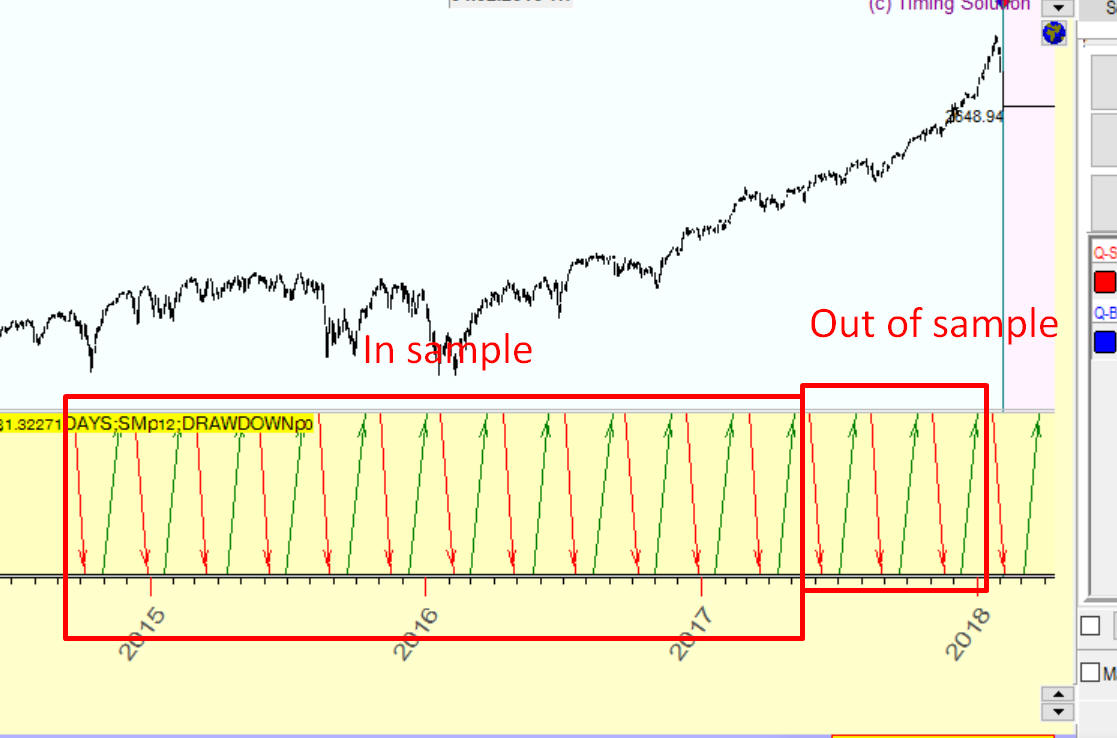
The important fact is: we use here non future leaks technology. It means that to build our trading strategy (i.e. to find tradable zones), we use in sample price history while out of sample price history is used to verify how this strategy works on an unknown price history.
Once again, to check a tradability of any cycle, we do these steps:
- use in sample (IS) price history to find predictable zones for this cycle, where we can trade it;
- after that we check the performance of this cycle on out of sample (OS) interval.