Dynamic model
Update April 20, 2016
A little bit of history...The dynamic model is one of the most interesting and promising forecast models. There is some history behind that model...
It has started in 2004. I did then an explanation how to build a Neural Network model
based on astronomical events. I demonstrated there how to build a projection
line based on different astronomical events, i.e. using aspects,
planetary positions etc. as inputs. It was described in "Towards/From" model. This is
the class I am talking about:
click here
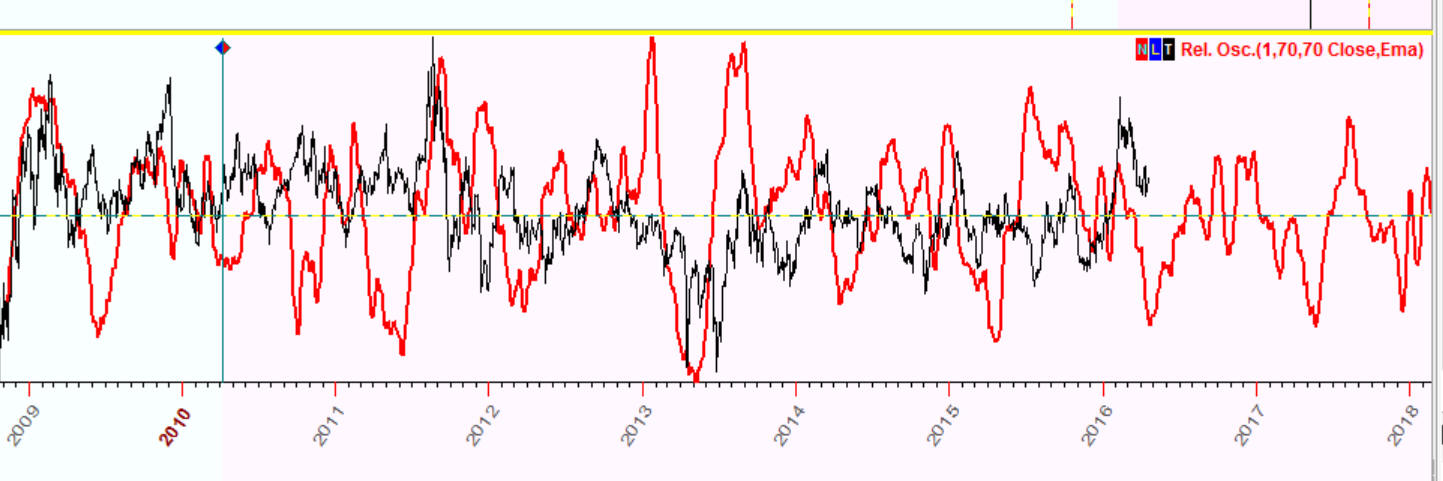
Initially it was just one sample there, nothing else. Later I have found that this sample provides a rather good projection line. So, I have conducted a detailed research of this model applying Walk Forward Analysis. And I have found that this model really works, even better than Annual cycle. However, I put it aside, and later I returned to that dynamic model again. I kept returning to it many times trying to improve it. The problem with the original dynamic model was: it has been too choppy, having too many jumps there, as shown on this picture:
Initially it was just one sample there, nothing else. Later I have found that this sample provides a rather good projection line. So, I have conducted a detailed research of this model applying Walk Forward Analysis. And I have found that this model really works, even better than Annual cycle. However, I put it aside, and later I returned to that dynamic model again. I kept returning to it many times trying to improve it. The problem with the original dynamic model was: it has been too choppy, having too many jumps there, as shown on this picture:
This is the main reason why I have not advertised this model much. Then, for two years already, I began receiving questions from users regarding this model. They sent me screenshots with that jumpy projection line calculated for different financial instruments.
For that reason, in March 2016, I have decided to finalize this model no matter how much time this task takes.
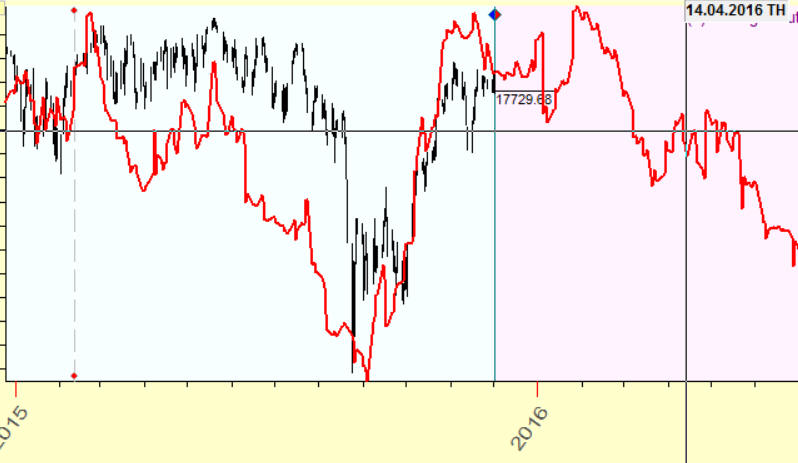
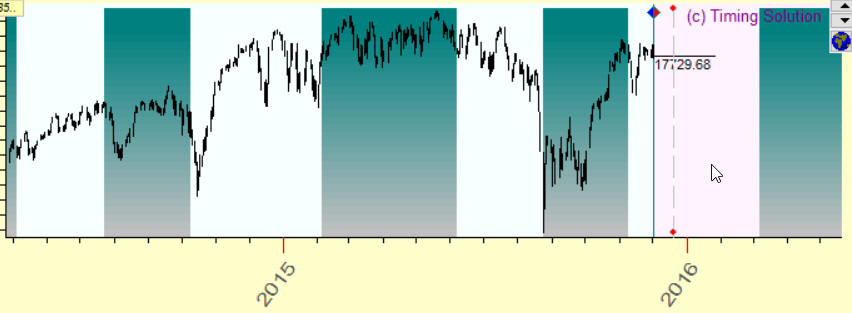
Declination projection line looks like this (this is declination Waxing/Waning for gold). As you see, it is not an ideal, of course. But it still catches many moves:
What is important is the fact that it does not correlate to Annual model. In other words, it deals with independent information.
How dynamic model works - just an idea
Now, 12 years later, I see that the idea that lies behind a dynamic model is very
close to stock market nature/behaviour/reality; it is closer than in other astro models.
After twenty years working with financial data all day along, I can tell that
this model "smells" like the market itself. I will show you why.
This is one of the elements of the dynamic model:
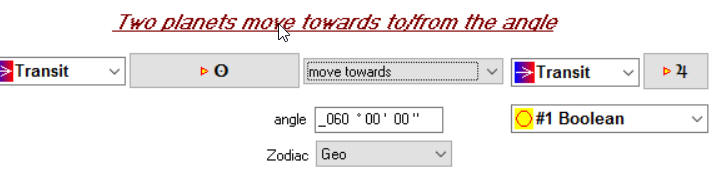
and this is how this element works in time:
This element describes one specific astronomical phenomenon: a situation
when the angle separation
between the Sun and Jupiter is close to 60 degrees (actually forming
that angle, moving to it). It may be this situation:
let say that one day the Sun-Jupiter angle is 90 degrees, the next day it is 89 degees, in two days
it is 88 degrees, and finally in a month this angle separation
reaches 60 degrees. This is not a moment of the exact 60 degrees aspect between
the Sun and Jupiter,
this is just an expectation that in X days this aspect will take place. The current
situation shows that this aspect will take place some day (before making an opposition), sooner
or later. This is a kind of not an actual event itself, but the potential/expected event.
Simply compare two similar events considered in different models of the program:
Simply compare two similar events considered in different models of the program:
FAM model Sun-Jupiter 60 degrees - it means the exact moment when this angle takes
place, an actual event; and
DYNAMIC model Sun-Jupiter 60 degrees - we are expecting this event, it is
coming.
Do you understand now why I state that the dynamic model "smells" like a stock market?
IMHO, very often, when we consider the stock market moves, the expectation of
some event X is much more
important than the actual event itself. Very often, when the actual event
occurs. nothing happens on the stock market - because this event is already
taken into account by the
stock market.
The simplest astronomical analog of a dynamic model is waxing and waning
Moon phenomena, i.e. we are expecting the New Moon (waning) or the Full Moon (waxing).
This
is the simplest dynamic model; for two weeks we anticipate the coming of the New Moon and
then, for another
two weeks, we anticipate the Full Moon.
How it works in Timing Solution
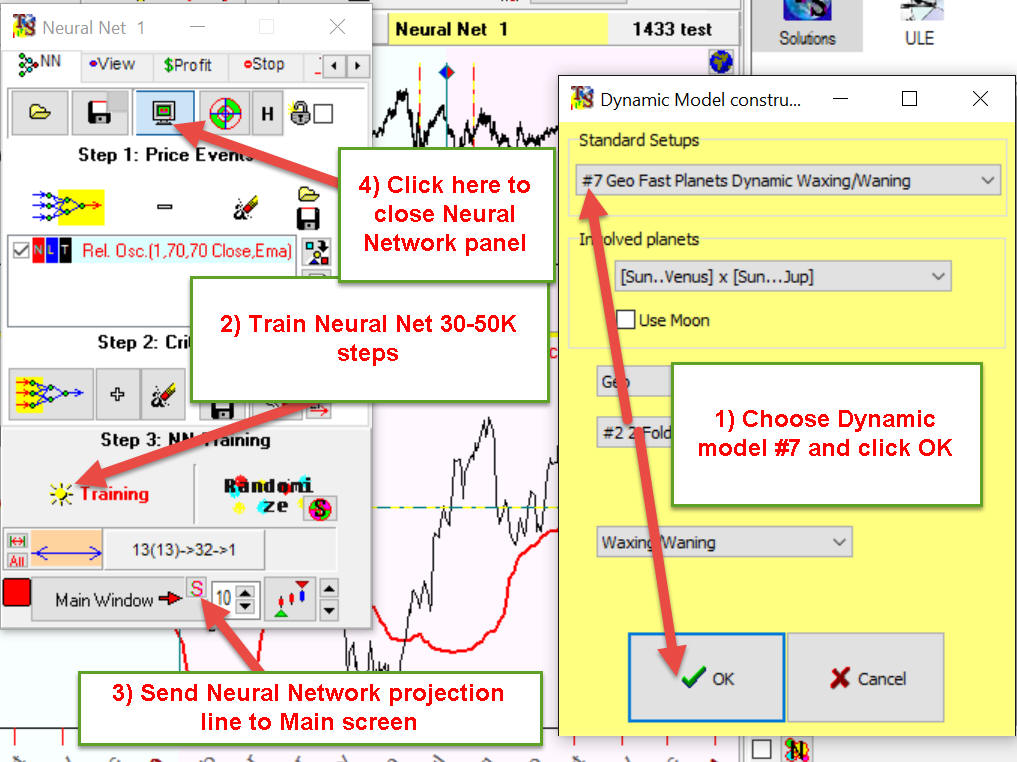
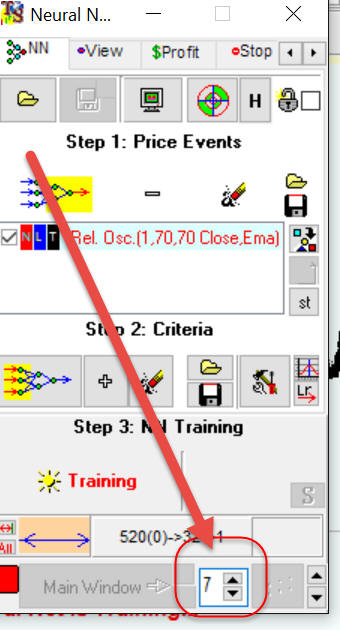
In Neural Net module, when you define inputs clicking "+" button, choose this item:
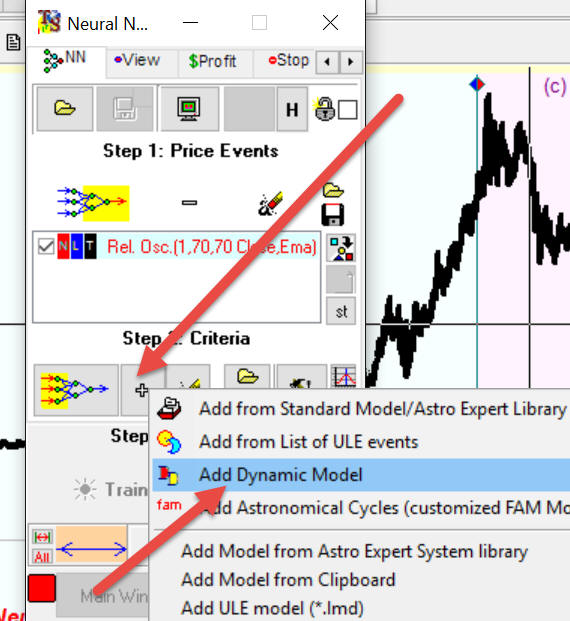
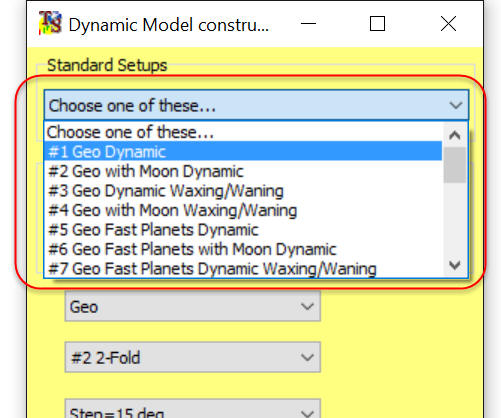
You will get this Dynamic model constructor where you may specify parameters for your
Dynamic model:
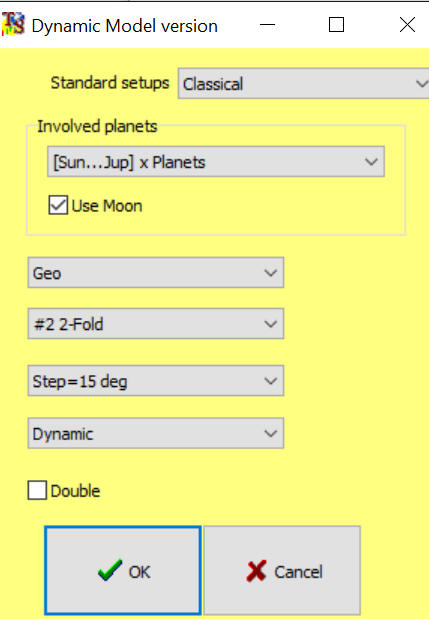
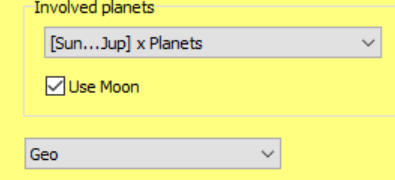
This group of controls allows to set the involved planetary pairs and Zodiac type:
This parameter below helps to specify how dynamic terms are calculated, this is where we can fight those jumps:
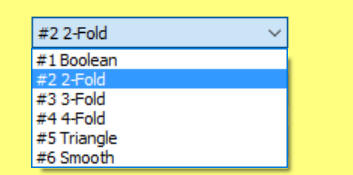
I recommend to use "#2 2-Fold" or "#6 Smooth" options.
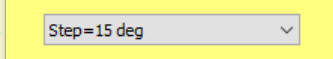
The step parameter: I recommend to keep it as it is, or you may increase it to 30:
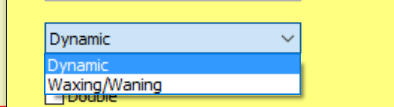
As I said, the dynamic model is similar to a waxing/waning model, this is the extension of the waxing/waning model. Using this option, you can calculate either a pure waxing/waning event by excluding all other dynamic terms or the full dynamic model:
Actually you can simplify your life choosing one of standard the most typical setups for the dynamic model:
And do not forget about smoothing: you can now smooth Neural Network projection line using this option:
I highly recommend to use smoothing for any dynamic model, it improves the forecast ability of the projection line based on the dynamic mode. The importance of smoothing is confirmed by Walk Forward Analysis.
Walk Forward Analysis (WFA) results
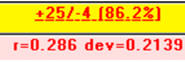
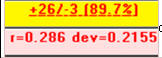
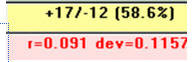
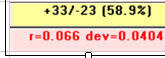
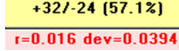
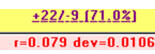
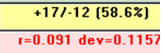
We have conducted WFA for four financial instruments (SNP 500, Gold, Crude Oil and EuroUSD all EOD data) applying for them 20 variants of standard dynamic models which are present in standard setups. Here are results:
| Instrument | The best model | WFA result | ||||||||||||
| S&P 500 index | Model #7 and #15 |
|
|
|||||||||||
| Gold | Model #8 and #20 |
|
|
|||||||||||
| Crude Oil | Model #7 and #8 |
|
|
|||||||||||
| EuroUSD | Model #1, #2 and #20 |
|
|
|
||||||||||
 |
 |
 |
||||||||||||
For all these models, smoothing value of 10 in Neural Network is used:
So you can easily build an appropriate dynamic model this way: as an example for S&P500 we have the best model #7; simply choose the standard setup #7 in Dynamic model constructor and train the Neural Net: