Q Box
Introduction: financial mathematics - Wizards vs. Raptors
The general idea of Q Box module is: we try to find tradable zones using any phenomena. At this point, we can see the difference between standard procedures of statistical analysis and technique we provide. For example, if twenty years ago somebody would ask me to research the effect of the Sunspot activity phenomenon on the stock market behavior, I would follow these steps:
- build Sunspot activity index together with the price chart, just a visual analysis, to get a general idea of how it might work;
- calculate a correlation coefficient between Sunspot activity index and the price (do not forget to normalize the price prior to that, to remove the trend);
- specify big changes in Sunspot activity index and check if these changes correspond to any significant changes of the price.
We have to perform these procedures in any case, just to gather a statistical information. However, very often a trader needs some other information from us. If the scientist is happy to find that the index proposed by him/her with high accuracy correlates to the stock market, the trader is more worried by the state of his/her trading account and needs to know how many successful trades this index provides.
Scientific people and traders think in totally different ways. Their needs/goals are different. For example, when Julius Bartels researched the existence of 27 days cycle (which is the Sun self rotation cycle, or the Moon tropical cycle) studying F2 layer ionization data, his goal was to confirm that this cycle is present; only after that fact was established, we could state that "with the probability of 95%, the self Solar rotation (or the Moon tropical cycle) has some effect on F2 ionization". We, as scientists, do not discuss yet the strength of this effect, we just state that this effect is present and we can continue our further research regarding the mechanics of this effect. This is the academic/scientific point of view; its focus is gathering some knowledge.
Traders' needs are different - "show me the money!". We can apply Bartels significance test and find that, with the probability of 100%, 57 days cycle (just a made-up example) is present in S&P500 data (it would make academic people happy); from the other side, analyzing trading opportunities of this 57 days cycle, we may find (also a made-up example) that we cannot outperform the stock market while trading this cycle (traders are not happy).
My point is: we cannot apply blindly any standard math procedures for the stock market (like Bartels significance test), if we want to give traders some useful tools. Somehow we need to lose our academic virginity; or, in other words, we need to find another math with different axiomatic system where our main focus is not to gather some new knowledge from the Universe; instead, our focus should be in gathering money from the stock market. To move in that direction, I have suggested Terra Incognita project several years ago and developed some modules of Timing solution under that project. As an example, one of those modules is Q Spectrum ( http://www.timingsolution.com/TI/16/index.htm ).
Changing the focus from academic research to traders' needs, we change totally the landscape of math techniques/tools/software/procedures that can be applied to finance and markets. I personally consider the tools that fit for a trader as able to catch market profit pretty much the same way as raptors are catching their prey. One raptor with quick reaction just comes and takes it, exactly as our Q Spectrum (it catches newly born cycles as early as possible); another one may sit in the bushes knowing its prey's patterns and takes it at the river bank (it would be our Q Box module's predictable zones, the short periods when we can actually forecast stock market behavior). Academic wizards may spent all this time looking for one more pattern or cycle while the prey is already gone. "Wizards vs. Raptors"???
To finish this subject, I would like to point at just one fact that tells me that this approach is correct. This is the fact that Q Spectrum module specifies INVERTED cycles, it sees inverted cycles while classical spectrum does not see them.
Fast examples
Example #1: trading with the Sun
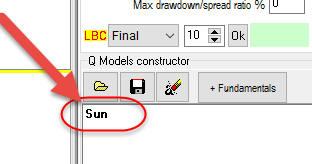
The major definition here is Q-Function (briefly QF). This is a function that we try to trade. Let's create our first QF. I have downloaded SNP500 since 1950 and want to make a trading system based on the Sun position, i.e. QF here is Zodiacal Sun position. We simply type Sun in the script box:
and click calculate.
So there are two processes in the Universe that we consider now: the stock market movement and the Sun movement through different signs of Zodiac, i.e. our QF. The program analyzes whether we can use the Sun position to trade our stock; it shows these colored bars:
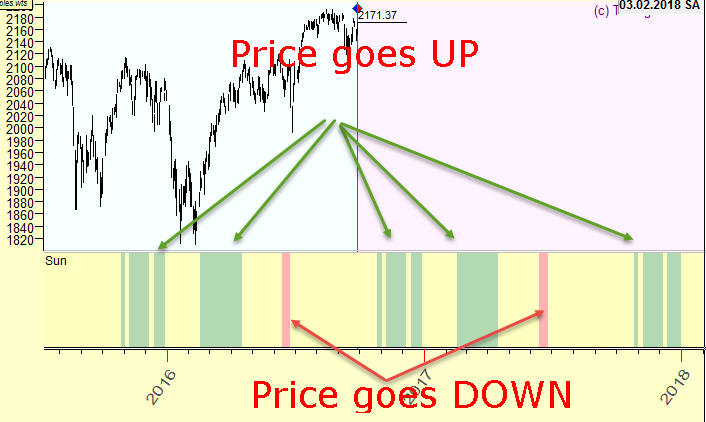
Green regions here correspond to the periods when the price tends to go up, red - when it tends to go down. We can investigate each strategy here, each up/green and down/red bar. Highlight any strategy in "Details" list; you can see when this strategy works (it is selected in the Main screen) and the statistical information about this strategy:
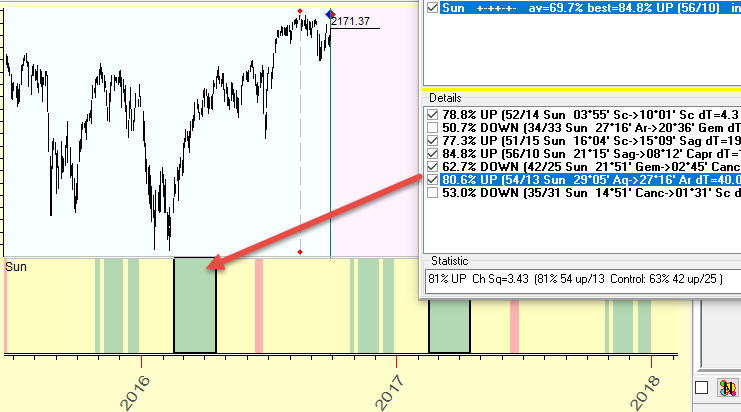
As you see, highlighted 80% accuracy strategy represents these pieces of knowledge gathered by Q Box: when the Sun passes 29 Aquarius - 27 Aries zone of Zodiac, the price tends to go UP. For SNP500, since 1950 the price went UP 54 times versus 13 DOWNS when the Sun was in that area of Zodiac.
Example #2: trading with Moon phases
Now let's add a new strategy that is based on Moon phases. Moon phases means the angle separation between the Moon and the Sun, so simply type one more formula there, Moon-Sun:
After calculations you will get two panels in the Main window: a panel for the Sun and a panel for Moon-Sun "predictable zones", here they are:
and the same way you can see how this Moon phase strategy works:
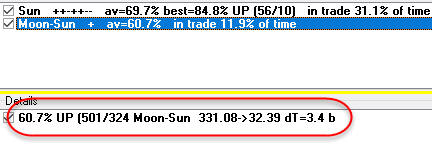
This is 60% (501 ups vs. 324 downs) accuracy model. When the angle separation between the Moon and the Sun varies between 331 and 32 degrees, the price tends to go up: price went UP 500 times tversus 324 times DOWN.
Example #3: trading with Sunspot activity
Let's create something totally different, let's try to trade Sunspot activity index. I will not discuss the question how to forecast Sunspot activity to trade with it. Take it as a model example because instead of Sunspot activity index you can use any dataset. You may try to trade using these datasets as other examples: the Moon tidal force, outside temperature or pressure, Lake Ontario water level, etc.
Click "Fundamentals":
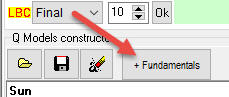
Choose Sunspot activity fundamental feature. Calculate; you will get this: three panels for the Sun, Moon phases and Sunspot activity:
It tells us that when Sunspot index varies in the range of 14-26, the price tends to go UP 58% (467 ups vs. 334 downs).

Examples #4: geo, helio and declination Zodiacs
If you type Mercury, the program will calculate predictable zones for Mercury geocentric position.
If you need to create the strategy based on heliocentric system, type this formula:
Mercury;Helio
These two word are separated by semicolon (;) , remember that. For example, if you need to calculate a trading strategy based on Mercury phases (the angle separation between Mercury and the Earth in helio, type this (because for Helio we use the Sun glyph for the Earth):
Mercury-Sun;Helio
To calculate a strategy based on declination Zodiac, use the tag Dec. For example, this is a strategy based on Moon declination:
Moon;Dec
The difference between the Moon and the Sun declinations:
Moon-Sun;Dec
Examples #5: planetary pictures
You can build trading models based on more complicated formulas. As an example, I have found that very often a fictive planet that represents the sum of the Sun and the Moon positions gives a good result to forecast the stock market. I have no physical idea what this phenomena means (compared to the gravitation, tidal force, etc.), but it works...
So to build this strategy, type this formula:
Moon+Sun
You can use any Zodiac there, like the sum of the Moon and the Sun declination:
Moon+Sun;Dec
or a strategy based on the sum of the Sun, Mercury, Venus, Mars geocentric positions:
Sun+Mercury+Venus+Mars
Example #6: midpoint
There is also a possibility to use midpoints in your analysis, but you should be very cautious with them.
Remember: do not use midpoints that contain 180 degrees jumps. For example: when your calculate Sun/Jupiter midpoint, we may face a 180 jump. It means when the angle separation between the Sun and Jupiter reaches 180 degrees, the midpoint jumps to a smaller arc. In other words, the planets that form some midpoint should not have a 180 degree aspect, Q Box does not work with 180 degrees jumps.
In other words, you should only use these planets (geo) in midpoints: the Sun, Mercury and Venus. These planets do not form an opposition.
So you can use these midpoint formulas (geo only):
Midpoint(Sun,Mercury)
Midpoint(Sun,Venus)
Midpoint(Mercury,Venus)
The list of objects you can use:
| Name | Brief name |
| Sun | |
| Moon | |
| Mercury | Merc |
| Venus | Ven |
| Mars | |
| Jupiter | Jup |
| Saturn | Sat |
| Uranus | Ur |
| Neptune | Nept |
| Pluto | Pl |
| Major asteroids | |
| Chiron | |
| Ceres | |
| Juno | |
| Pallas | |
| Vesta | |
| Cusps (for intraday) | |
| Asc | |
| 2H | |
| 3H | |
| IC | |
| 5H | |
| 6H | |
| Dsc | |
| 8H | |
| 9H | |
| MC | |
| 11H | |
| 12H | |
| Special points | |
| North Node | N Node |
| White Moon | |
For example, for the intraday chart you can use angles like this;
N Node-Asc
which is the angle separation between the North Node and the Ascendant.
You can use cusps for INTRADAY chart only.
Cusps, the North Node and White Moon can be used for geocentric chart only.
For example, you cannot use angles like this:
N Node-Asc;Helio
Custom cycles
You can specify custom cycles, like cycle with period 100 calendar days:
Cycle:100days
The program will find predictable zones for this cycle, they can look like this:
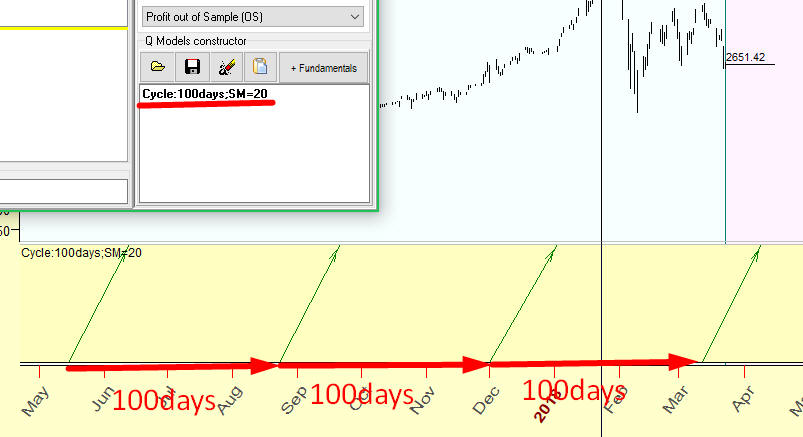
Here I set stock memory for this cycle, SM=20 for, i.e. program analyses last 20*100=2000 calendar days of price history.
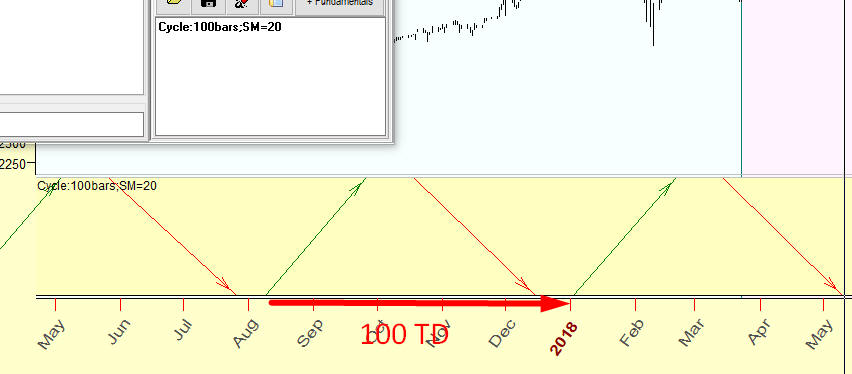
To calculate trading days cycles use BARS metric i.e. type this:
Cycle:100bars
and program will find predictable zones for 100 TRADING DAYS cycle, like this:
Options
SM (stock memory) - you can take it as an amount of analyzed cycles. For example, if you analyze the Moon (QF=Moon position) and set SM to 12:
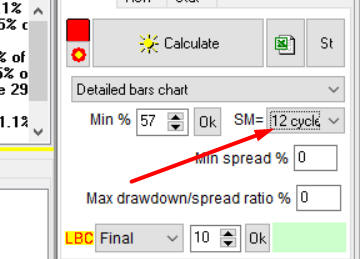
In this case, to find predictable zones for the Moon position, the program will use the price history that corresponds to the last 12 full Moon cycles, i.e. about one year of the price history.
Or you may like to specify the amount of years; let it be 4 years:
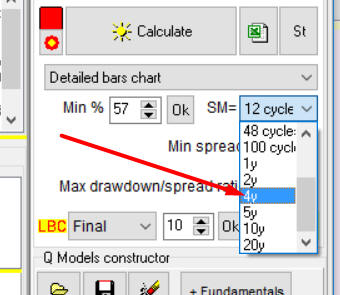
In this case, to calculate Moon Q-box module, the program will use last 4 years of the price history. This is the most important option, it helps to handle the situation when some cycle does not work all the time the same way. Usually I analyze SM=All first; this way I try to catch permanent cycles (cycles that work all the time the same way); after that set SM=12 to catch cycles that work for the last 12 full Moon cycles.
You can also specify SM directly in the formula:
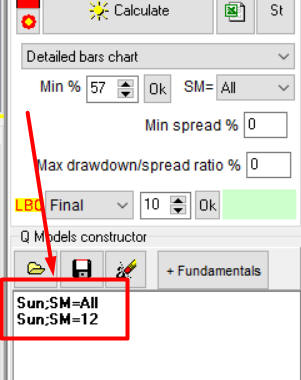
Type this:
Sun;SM=All
Sun;SM=12
The program will calculate predictable zones based on all downloaded price history and on the last 12 years. Pay attention to the periods when both cycles show the same direction:
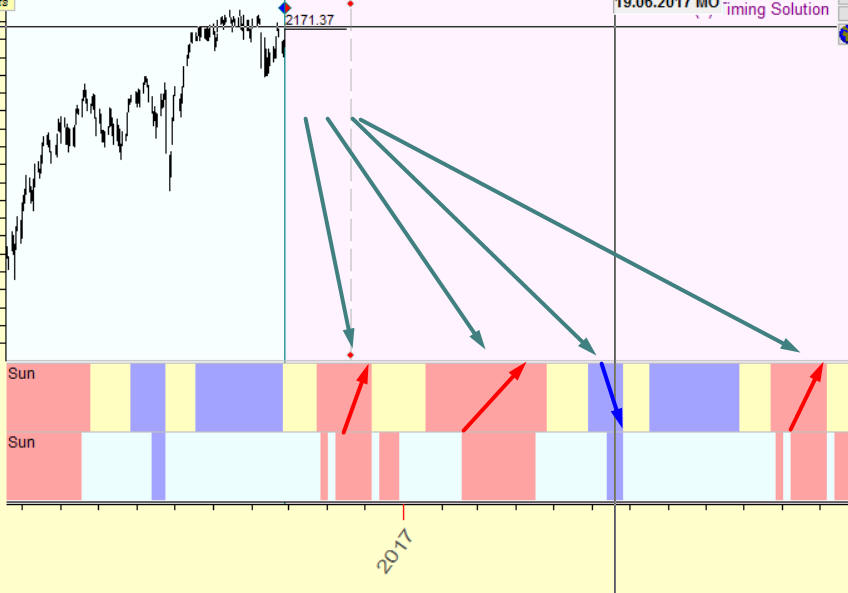
Here we have calculated predictable zones that are confirmed by all available price history and the last 12 years.
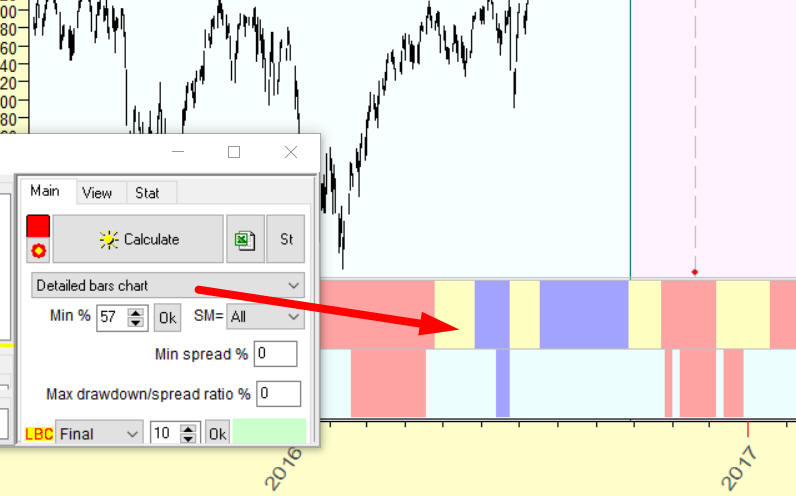
Min accuracy- it is this option, the minimal accuracy of a strategy:
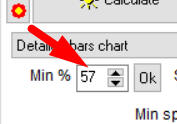
I recommend setting it to 50%, then click "Calculate" and after that increase the accuracy value (increase % and click "Ok") and watch how the strategy changes in the Main screen.
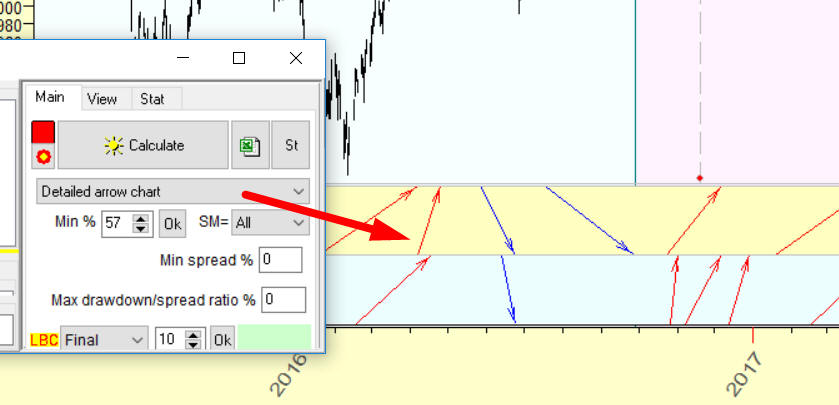
Different views- this option provides several opportunities to display predictable zones.
You can display predictable zones as colored bars:
or as arrows:
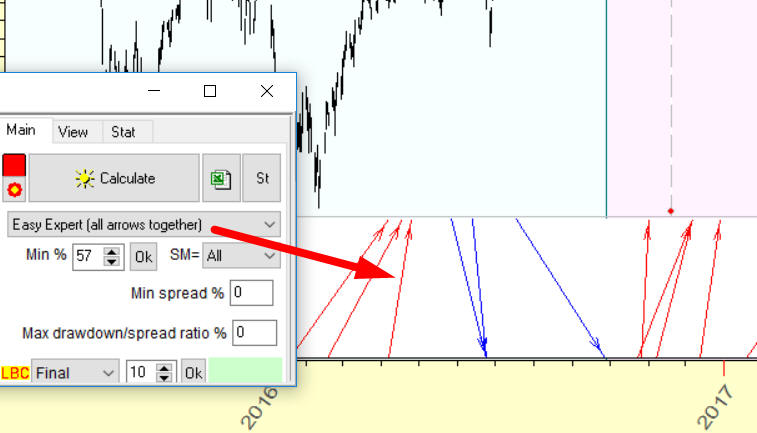
or as arrows in Easy Expert style (all arrows are shown on one panel):
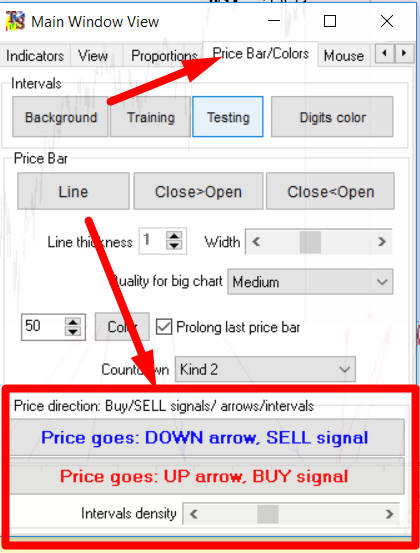
To change the color of zones/arrows, open Main Window View (in the Main window, click RIGHT button and in the popup menu highlight "Main Window View") and choose there "Price Bar/Color" tab. Use these buttons to set the color; the scroll box serves to adjust the density of colored bars:
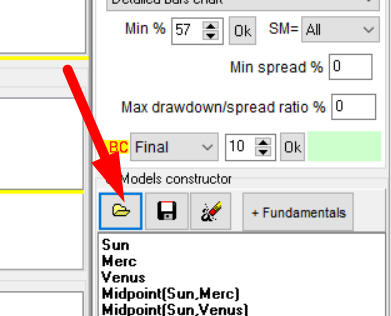
Ready templates
Clicking this button you can download ready templates, i.e. prepared Q-Box cycles:
After that click "Calculate" button to calculate Q-Box model for your financial instrument. The result can look like this ("Big Annual" model with different variants of Annual model is chosen):
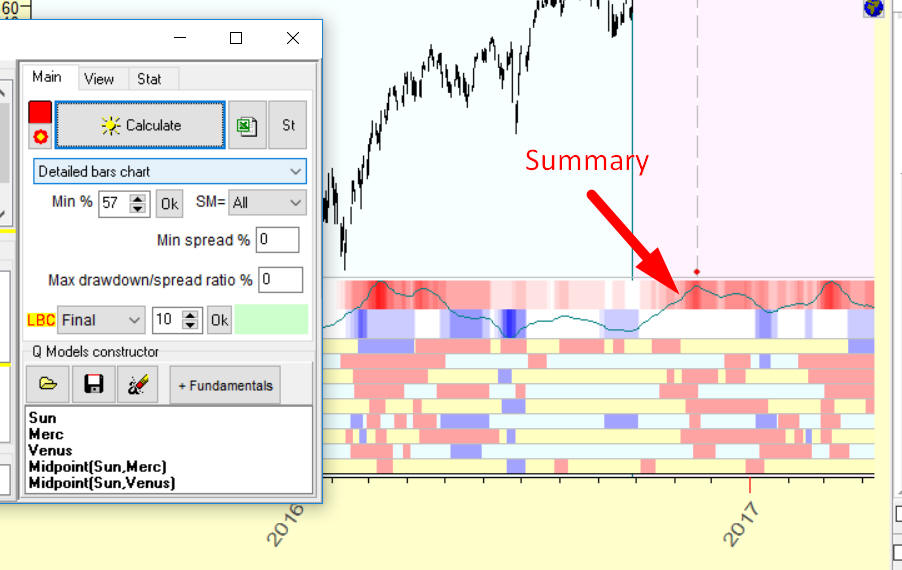
For that chosen model, the program has calculated 10 Annual, kind of Annual and a-la Annual cycles and display predictable zones for these 10 cycles. Also it shows a summary line that represent summary results. This feature is explained in the next section.
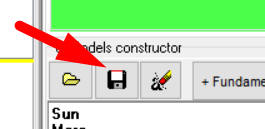
Clicking this button as shown below, you can also save your model as a template for further usage:
Summary projection line
I highly recommend to work with the summary projection line. I have conducted a lot of tests and have found that this projection line is one of the most reliable. Plus this projection line is built on totally different principles than suggested by other existing modules (Composite, Neural Network, etc).
Highlighting this item, you can display the summary projection line only:
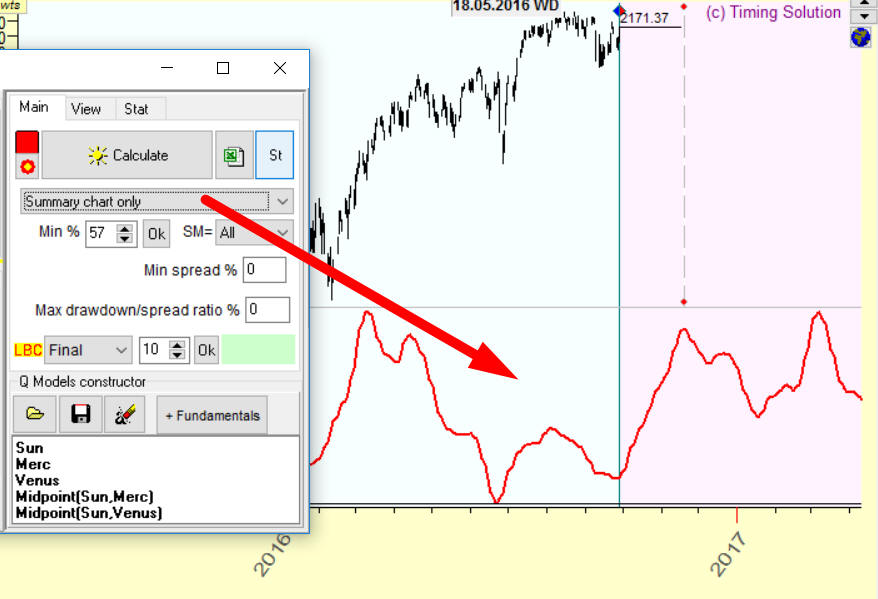
I would also recommend this algorithm of building a summary projection line:
- choose several strongest Q-Box cycles. Let it be Annual (Sun) and Venus synodic (Venus-Sun;Helio) cycles:
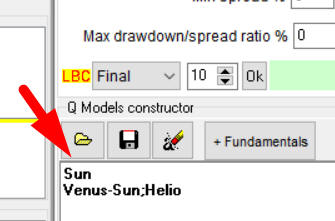
- add to these cycles several harmonics simply multiplying Q function. For example, instead of that:
Sun
Venus-Sun;Helio
type this:
Sun
Venus-Sun;Helio
2*Sun
2*(Venus-Sun);Helio
3*Sun
3*(Venus-Sun);Helio
4*Sun
4*(Venus-Sun);Helio
or (pay attention!) you can simplify the process of typing to this:
Sun;H4
Venus-Sun;Helio;H4
Thus we analyze 1H, 2H, 3H and 4H harmonics as well;
- click "Calculate" to get the summary projection line based on these cycles. This way we conduct more detailed analysis for our cycles.
November 3, 2016
Sergey Tarasov
Canada.
-