TS Terra Incognita Project #7: Wavelet Cycle Hunter
Fast Introduction
This module is designed for early revealing of cyclic phenomena in financial data and making the forecast based on these revealed cycles. Research shows that it is not so important how many cycles you have found in the financial data (like as 55 or 100, or 200 trading days cycle), tit is much more important to find the strongest cycle NOW - the dominant cycle Therefore, the most important issue is to reveal the appearance of the new dominant cycle/cycles as early as possible. This is why this module has been designed.
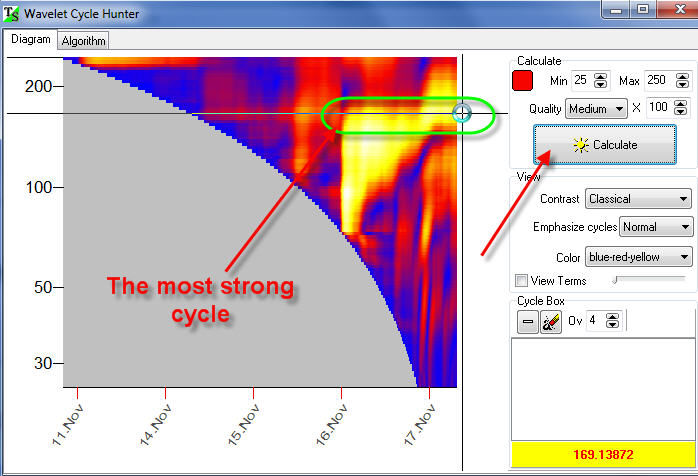
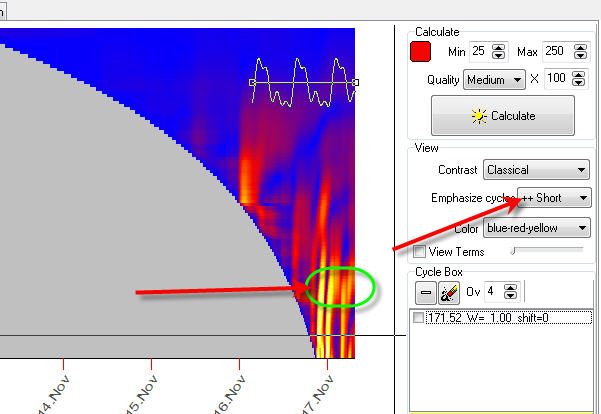
Let's start. Open Wavelet Cycle Hunter module and click "Calculate" button. In a matter of seconds you get this wavelet diagram:
The bright yellow zones correspond to the periods when some cycle is active. In our example, within two days, November 16 and 17, 171-bars cycle is active.
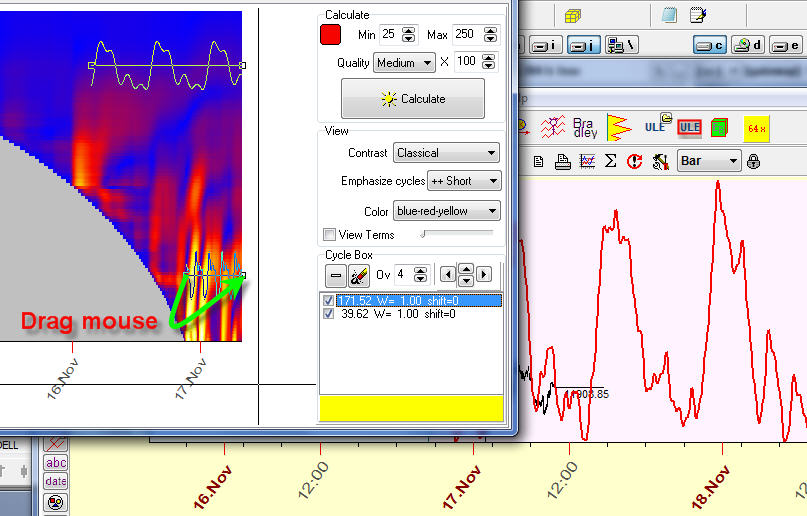
Now let create a wavelet, a wave form that is based on our 171 bars cycle. It is very simple to do in this program; just drag the mouse over this yellow region - the region where our cycle is active:
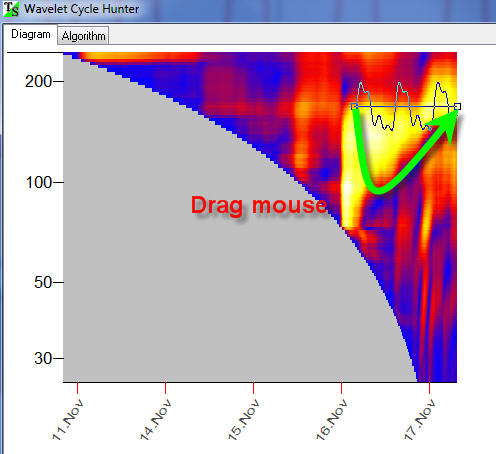
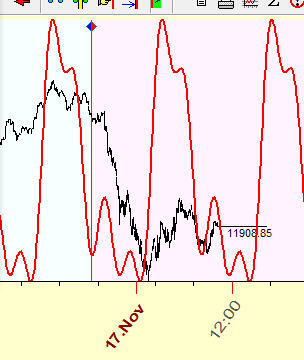
Immediately you get in the Main screen the projection line based on this cycle:
Now let's try to analyze some short term cycle. To do that, highlight "Emphasize Short" cycle. You will see a detailed wavelet diagram for short term cycles:
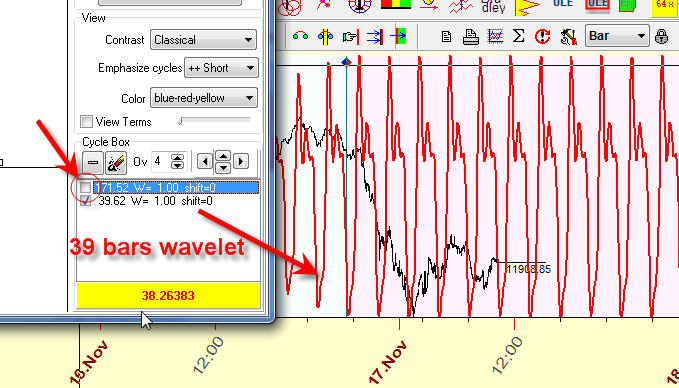
Drag the mouse cursor over another bright yellow zone that corresponds to 39-bars cycle:
Again, on the Main screen, immediately you will see the projection line which is based on the superposition of these two cycles, 171 and 39 bars cycles.
You can enable/disable any of these cycle:
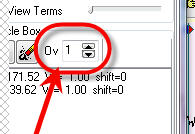
Try to vary the amount of overtones to calculate the more/less detailed projection line:
Cycles Validation
Cycles in financial data are very tricky phenomena. Research shows that presence of bright zones in the wavelet diagram can be caused by random oscillations of the price. This is a specific feature of financial data.
We recommend to perform an additional procedure to verify the importance of some cycle %X.
Suppose we have created a wavelet that is formed by two points on the wavelet diagram, A and B:
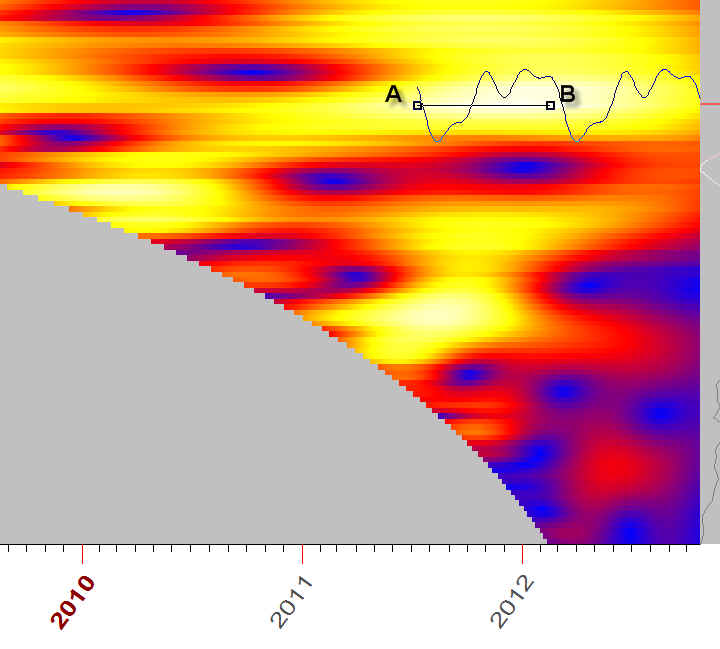
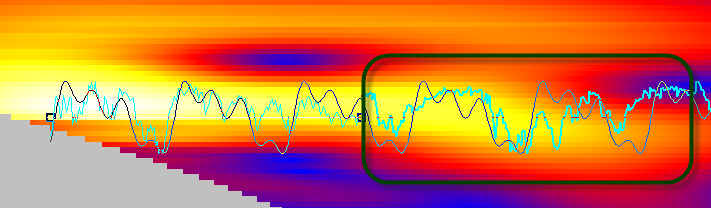
How will this wavelet forecast the future? We can see it. To do that, just set the "Target" option ON, - and you will see the price together with the wavelet projection line (aqua line):
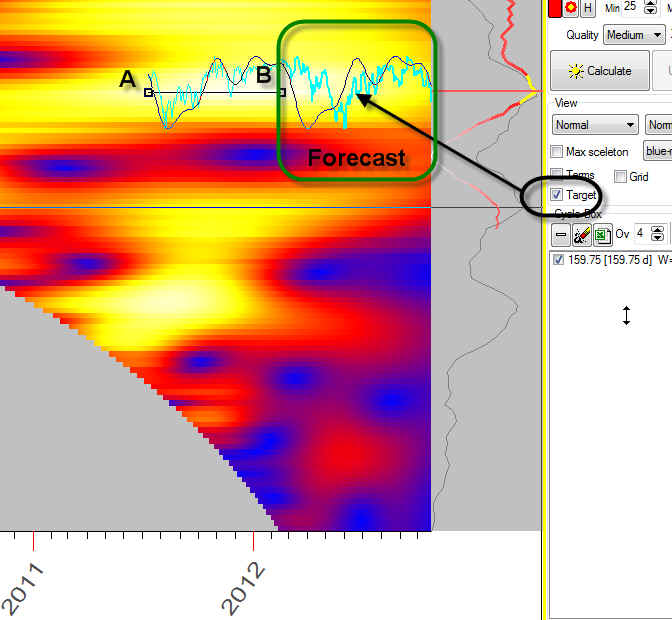
The projection line after point B shows how this wavelet forecasts the future; here it is:
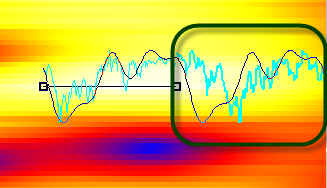
And we can see that there is no coincidence between the wavelet diagram (the black line) and the price (aqua line). It means that this cycle is not working.
Here is another example, an example of the wavelet that works: