Declinations: how they affect the stock market
Case study
written by Sergey Tarassov
The declination is in fashion nowadays.
It is a necessary item of many Internet group discussions. And most of the
software that touches astro base in any way uses the declination calculation at
some point. In this small article,
I would like to introduce the way of conducting research on
declinations using Market Trader and/or Timing Solution software.
First of all, let me make some notes on declinations in general. Declinations are used by anyone who takes the planetary movements into consideration. Our interest is in the forecasting of stock market behavior. It is a common belief nowadays that stock market behavior is strongly connected to mass psychology. There are many ways to work with mass psychology phenomena. One of the possible ways is to consider the findings of old astrology, so called astro indicators. There is a documented evidence of the usefulness of such indicators (especially of those that can be calculated and are described and confirmed by methods of modern astronomy and mathematics). There is no proven theory yet that explains the mechanics of the relationship between the Universe and Man (though there are some attempts to it). From this point of view, declinations are one of the many factors that we might be willing to consider. Our task now is to realize to what extent and how they are useful in market forecasting.
What are declinations? The declination is related with Equatorial Coordinates.
Equatorial coordinates describe a plane
defined by the daily rotation of the Earth around its axis; it is inclined to
Ecliptic approximately at 23 degrees. This is a very important angle as it is a
reason of hot summers and cold winters on our planet. If this angle would be equal
to zero degrees, we would never have the
summer and winter. All year around we would experience the same temperature; to
me, it is too boring. If this angle would be very big (like 90 degrees for
Uranus), we would have extremely
hot North (especially around the Pole) and extremely cold South.
The 23 degrees is the best angle, at least for those who like skiing in winter and swimming in
summer.
Now, the declination. The declination is nothing more than a parameter that shows how far the planets and objects in the sky are located relative to the celestial Equator plane. There is nothing mystic in calculating declinations, the modern astronomy and mathematics do it well, and you can find the declination points info in ephemeris.
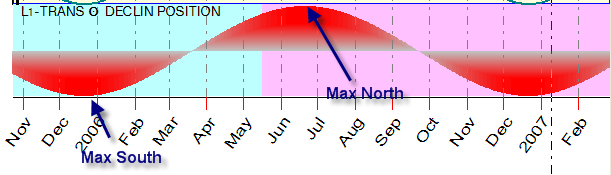
See how the Sun declination is changing within the year:
The Sun reaches the maximum South declination of 23 degrees 27 minutes around Christmas time (December 20th, Winter Solstice) and the maximum North declination in the end of June (June 20th, Summer Solstice).
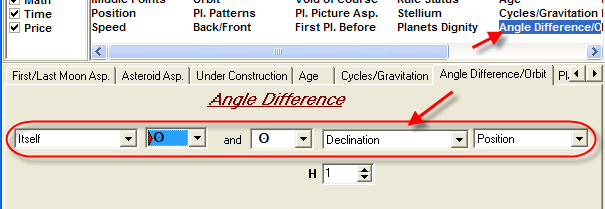
I have created this model using these settings in SuperSearch/ULE module of the program:
Now, let us consider the Moon declination (a blue diagram, added to the previous one):
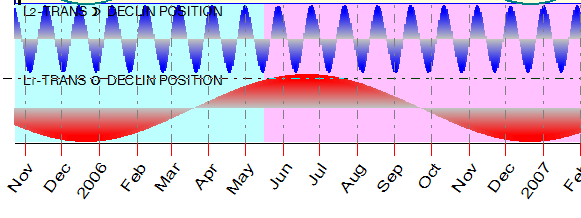
The Sun and the Moon paint on the Equatorial sky the regular sinus waves. It is not so nice with the planets. See this picture painted by Venus:
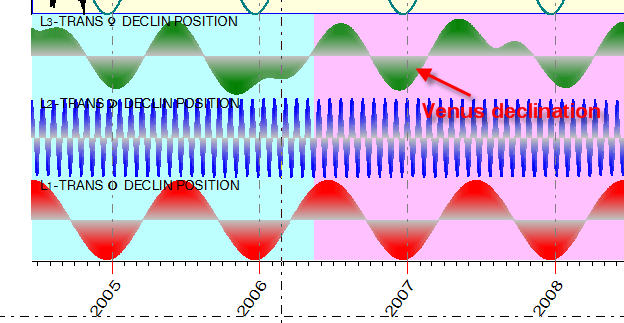
The Venus declination line is not so regular as the Sun's or the Moon's. The reason is so called retrograde movement of Venus sometimes. However, this fact makes the Venus declination cycle (and the declination cycles of other planets) very suitable for stock market prediction.
Let us go back for a minute to the Sun declination picture (see above). The star Sun creates the most regular pictures in the sky thus setting the legal bands for other planets' movement as 23degrees 27 minutes to both sides. Usually, the planets move inside this band (as to paying their respect to the most important person in the Solar system; immediately all ancient legends come to mind, with the Solar god in the middle). However, sometimes they are able to break these rules and spend some time outside these legitimate 23.27 degrees. These zones are called "Out of Bounds". Actually, these zones are very interesting. See this diagram for the Moon breaking the rules stated by the Sun in 2006:
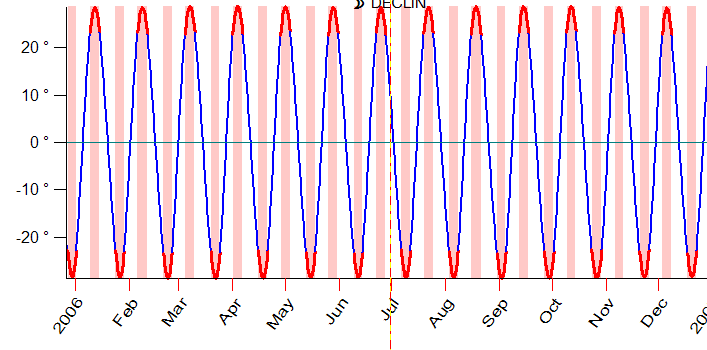
In 2006, it happens to the Moon two times a month for 5 days each time. These zones are marked by red stripes.
Look at the same picture for a wider time span, from the year 2000 for 30 years ahead:
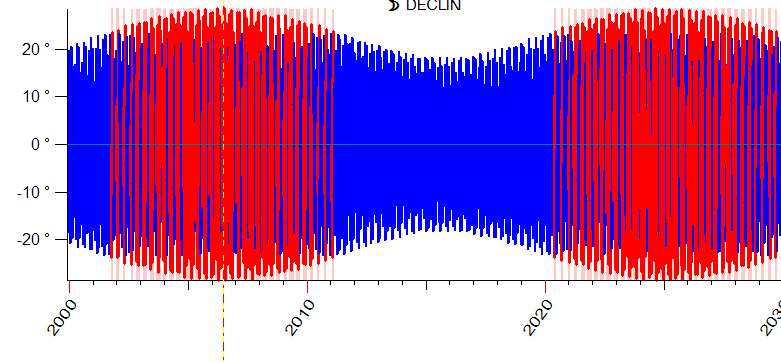
The red zones correspond to the Moon "Out of Bounds". You see there 9-year periods when the Moon is allowed to move out of border, and then there is 9-year period when the Moon does not break these borders. Together, they make an 18-year Lunar cycle (so called Saros cycle).
The current period of the rebel Moon has started in 2001 and will finish in 2011.
See these dates and compare them to the recent history:
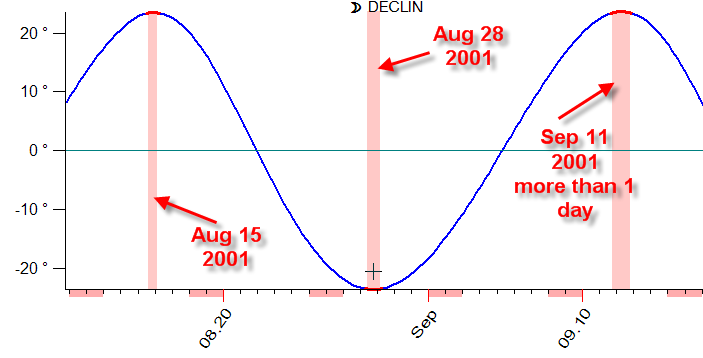
The Moon left the legitimate borders for several hours on August 15, 2001, then for a little bit more time on August 28, 2001, and on September 11, 2001 the Moon spent outside these Borders more than one day. I do not want you to take this as the explanation of the great tragedy that has happened that day; I only state that at that day the Moon (our emotions) was for more than a day out of the Sun's boundaries.
This red zone will finish on April 20, 2011. Now (June 30, 2006) we live in the highest point - the Moon is Out of Bounds 10-12 days a month. It was a situation of the years 2004, 2005, and 2006. Next year, 2007, it will be out 9-11 days a month; in 2008 - 7-8 days; in 2009 and 2010, about 6 days a month. So, if these zones affect our lives in any way, now we are on the way to more proper position of the Moon and, probably, to more "quiet" period of our history. (Everywhere, when I refer to "legitimate", "proper", "rebellious" or similar terms in regards to the planets, it reflects the lack of our knowledge and research of this very complex matter - interrelationship between humans and the Universe.)
Now, let us return to financial astrology needs in the light of the declination.
We need to find the answer to this question: Do the declinations of different planets have any impact on a chosen market? The only way is to conduct a research on every financial instrument in regards to the declination of every planet. It sounds like a lot of work to do. However, we are in a much better position than the researchers of the past: we have computers now and necessary tools to conduct this research. Manually, it would be impossible to do this job (only some random examples, as George Bayer did). With a computer and without a proper tool, it will take too much time, machine and human as well. With our software, it is quite easy and definitely fast.
I did the following examples for Dow Jones Industrial Index data. My purpose was to show you how this research can be done and what things are worth to consider. Though I did the comparison of declinations of several planets, I provide here the example of the research for one planet declination only. I do it using two different techniques. Two other examples show the research of compounded models. You can try to do the same research yourself (or explore any other financial instrument). For me, it is easier to make examples as the answers to some questions.
Question #1. What is going on with Dow Jones Industrial index (DJI) in respect to Mars declination?
There are several ways how to deal with Mars declination in the program. We could do it exactly as we did before for the Sun and the Moon and Venus: create a SuperSearch/ULE event and see the dates when it actually had happened. Then we could do a statistical analysis for these dates, for turning points of DJI price history diagram, including specific amounts of increase/decrease for 2%, 5%, etc. The program can do that. However, it would not be a smart solution if we analyze the DJI data from 1885 to 2006 (practically 120 years of price history). One of the reasons is that we cannot state that Mars declination was the only cause for all these moves. What we can do is to evaluate the Mars declination input. This is how we do it.
Run the Composite module and set these parameters:
You will get this diagram:
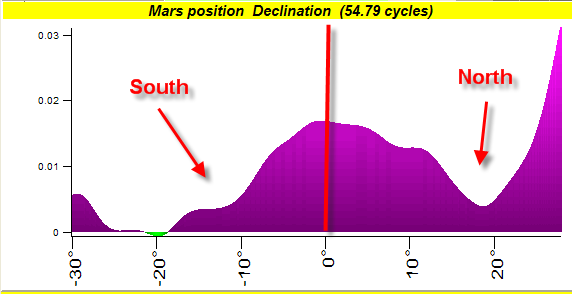
This diagram is divided on two zones, North and South semi spheres.
You see that in general the values are higher for the North part, especially when Mars reaches 23 degrees of its North declination; in this case, the DJI is pretty high.
The Composite model gives us the general idea only; to get more detailed answer to our question, we need to use Efficiency Test module. It is shown in the next example.
Question #2. What does happen to DJI when Venus declination reaches its maximum South value?
In comparison to the Question #1 (where we were exploring the impact of the planet's declination in general), here we consider a specific value of the declination. It means that prior to this we have to explore the impact of Venus declination on DJI in general.
Set these options in the Model Editor:
and calculate the Efficiency Test for this event. Here it is:
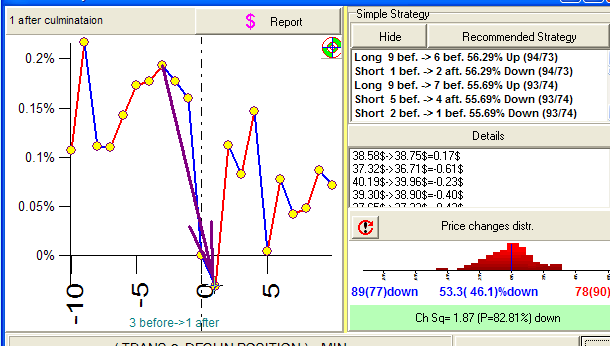
It shows a drop in DJI value, though not a significant one (89 down against 78 up).
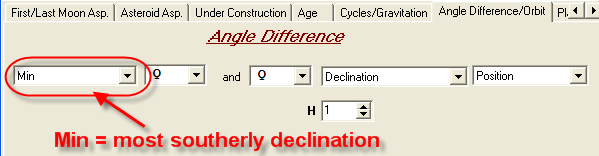
The same way you can calculate the Maximum North Declination (choose Max option) or find the moment when the planet crosses Equator, i.e. has zero declination (choose Value=0 option).
Question #3. What does happen when Venus declination is higher/lower than Mars declination?
In this example, we do not explore the declinations of each planet separately, we are trying to understand the impact from their mutual position (there is an idea that the planets and heavenly bodies might work as filters or lenses to some kind of cosmic energy). As we are looking for a general evaluation, we go to Composite module again.
Set these options in the Composite window described above:
You will get this diagram:
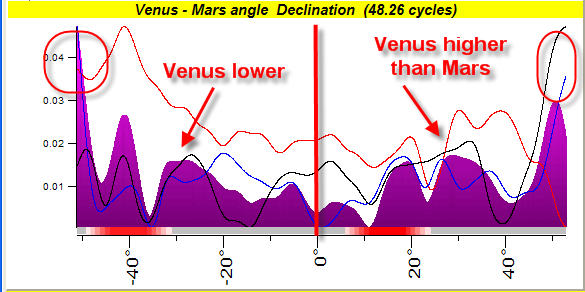
This diagram presents two regions: the right side is for Venus declination higher than Mars's, while the left side is for Venus lower than Mars.
The diagram shows that DJI is high when the difference between Venus and Mars declination reaches the extreme values, especially when Venus is lower than Mars.
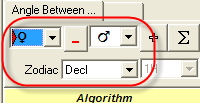
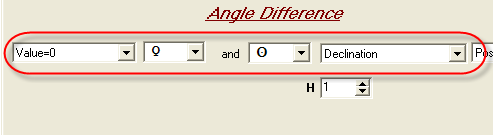
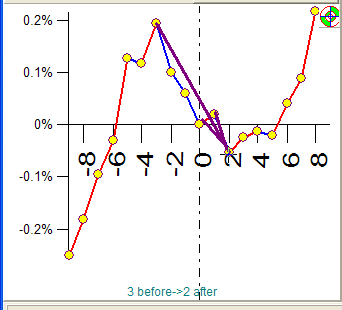
Question #4. What does happen when Venus and the Sun have the same declination?
As we are discussing a specific value, we will work with Efficiency Test. So, set these options in the Model Editor and run the Efficiency Test:
The Efficiency Test looks like this:
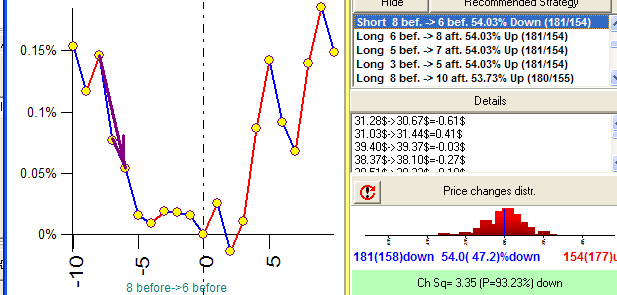
The Efficiency Test indicates the significant drop a week before this event (181 down against 154 up).
In this example above, we have analyzed the aspect of parallel between Venus and the Sun. It occurs when two planets have the same declination. There is another possibility as well: when two planets have an opposite declinations (like Mercury's declination is 15 degrees South and Jupiter's declination is 15 degrees North). It is called a contraparallel aspect.
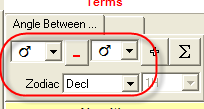
This kind of aspects can be defined in the "Aspects" tab as well:
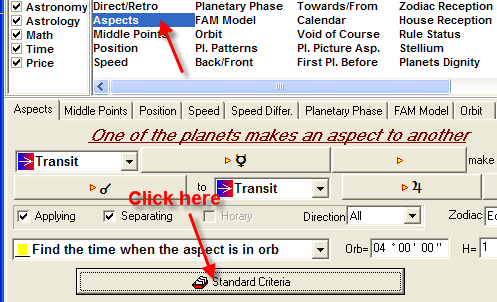
Choose the planets to be analyzed and click "Standard Criteria" button. You will get this:
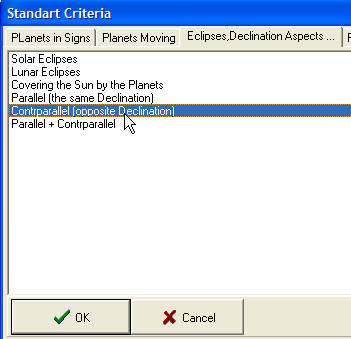
Then you can work with this event as usual. For example, see this Efficiency Test for the event Mercury-ContraParallel-Jupiter:
Again, my intention here was only to show how to do the research on declinations with this software. I believe that now you can easily analyze any planetary combination and different phenomena that involve a declination.