"Fat tails" in finance
"Fat
tails" is a statistical phenomenon,�
it appears in financial data tas well as in�
other fields�that involve human activity.
You should understand that this
phenomenon has no mathematical solution, i.e. �we cannot eliminate this phenomenon using some
smart or very smart algorithms. Take it as "Memento mori" - the fact
we have to accept whether�we like it or not.
This is the environment we live in.
Briefly "fat tails" phenomena may be
formed
this way: the power of accidental factor (or we think that this factor is
accidental) is�
much more higher� than your common
sense says you.
Here are some
examples:
#1 impossible big
drop: I would like to start with a classical example, example that
is responsible (as I understand) for the name "fat tails".
Let's imagine that it is not the year 2016 now, but the year 1987. on
October 19, 1987 S&P500 dropped more than 20%, the largest
one-day percentage decline. The last drop in 1929 was much more
smoother: though within a month Dow lost 45%, it was a gradually distributed
decline (the biggest drop of 12.82% has occurred on October 28).
We ask ourselves: how often this huge drop may happen in the future, from
statistical point of view?
I tell you how I would think then, in 1987, being a young
scientist recently graduated from my University. From my point of view,
it would be an elementary task, an easy one: we need to calculate a standard deviation for
the percentage of
one-day price change. Here it is, 0.8%
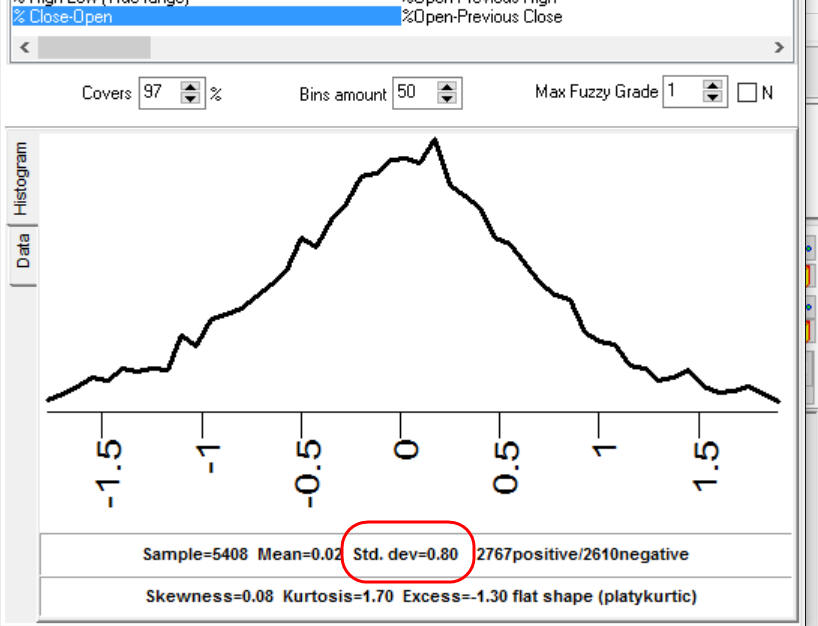
Then we need to calculate sigma for this drop. The
sigma for 20% price drop is: sigma=20%/0.8%=25. Ooops!
25 is a huge value of sigma. For a recent graduate studied the
classical statistics, it says that 20% drop is
practically impossible. There is simply no tables for sigma's value as 25. The biggest
sigma in the tables I have is 6, and from the point of view of the classical statistics it means that 4.8% drop happens
once in 4,000,000 years.
From the point of view of a trader, the situation looks differently:
he/she has seen 4.8%+ drops before (1946, 1962). It means that something is
wrong with our calculations. Technically it means that we cannot apply
standard statistical formulas that were used to calculate that probability.
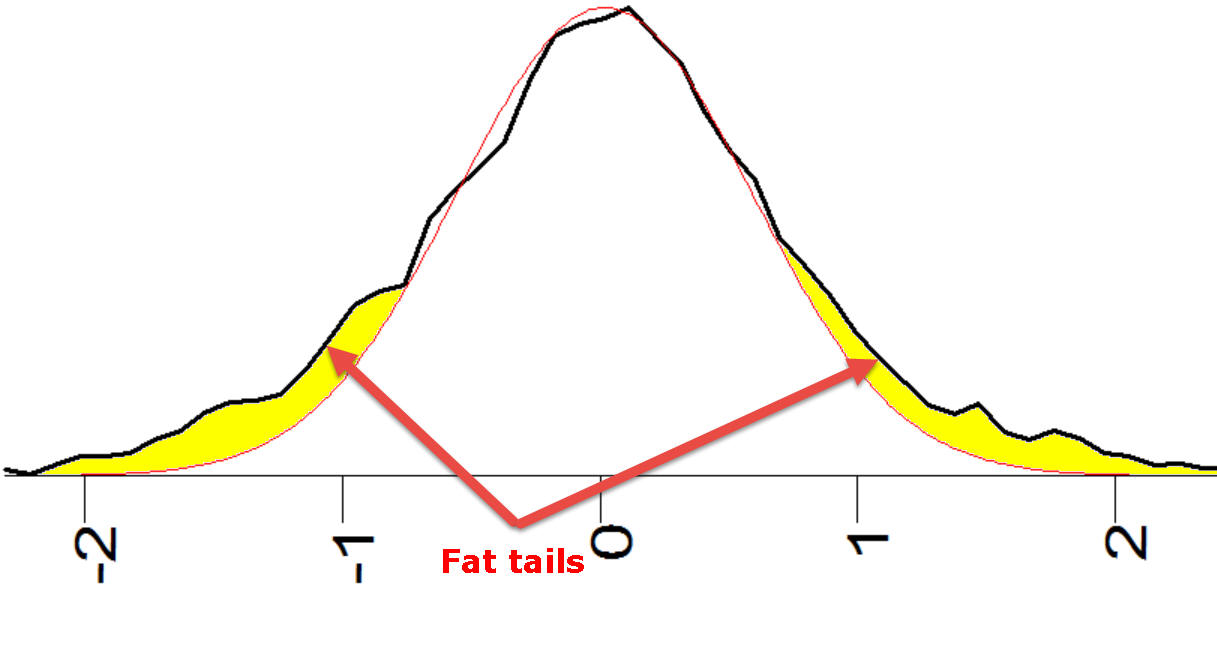
Standard formulas are based on normal distribution and they underestimate big
changes of the price movement, This is why they call it "fat tails"
effect: the probability of big changes is much more higher than the normal
distribution suggests. It means that "tails" of histogram are more bold than
in normal distribution:
This subject is explained here:
http://www.timingsolution.com/TS/Articles/cds/index.htm
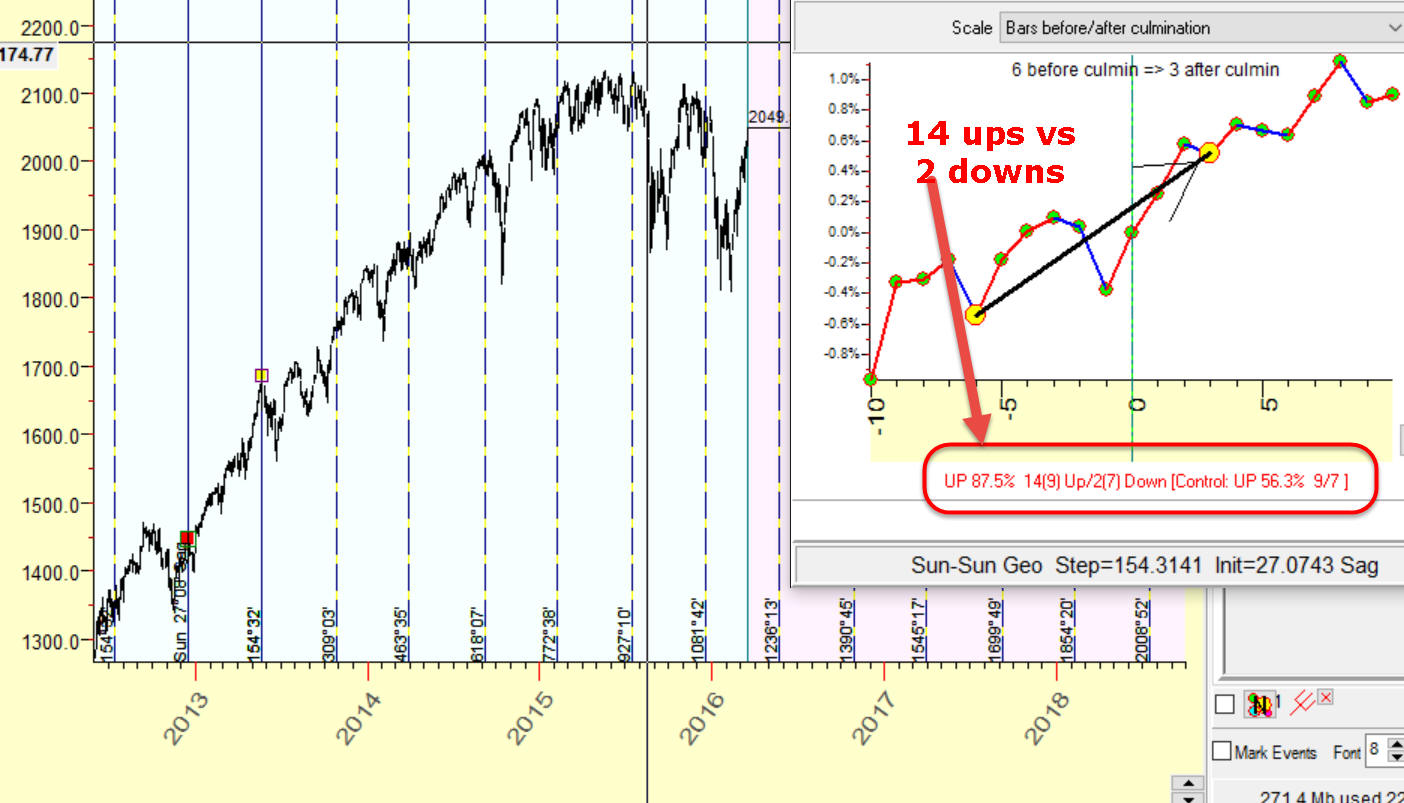
#2 impossible big win/loss
ratio: This is a model calculated with Timing Solution software. The Efficiency test shows us the
information regarding trades around these vertical lines; we
make 14 long winning trades versus 2 loss trades, 87% winning trades:
We could create similar vertical lines that go right to the future, as far as
we need.
The question is: Can we trust these
results? In other words, can we prolong this model into the future and trade in�the future with 87% accuracy?
Let's analyze this
phenomenon from the point of view of the normal distributed statistics which is
based on one simple idea: we dice a coin; if it is a
head - I win; if tail - I lose. I diced that coin 11 times, and I win 10 times
losing just one time. Would you like to use this coin for your play? Definitely yes, this coin
has provided much more winning cases for me, you would expect that it will work
the same way for you, why not?. But... Common sense tells us that� something is wrong with that coin, it likes
"heads" more than "tails". This is not an occasional fact; the probability
that it is not some chance is 100x(1-1/2^9)=99.8%.
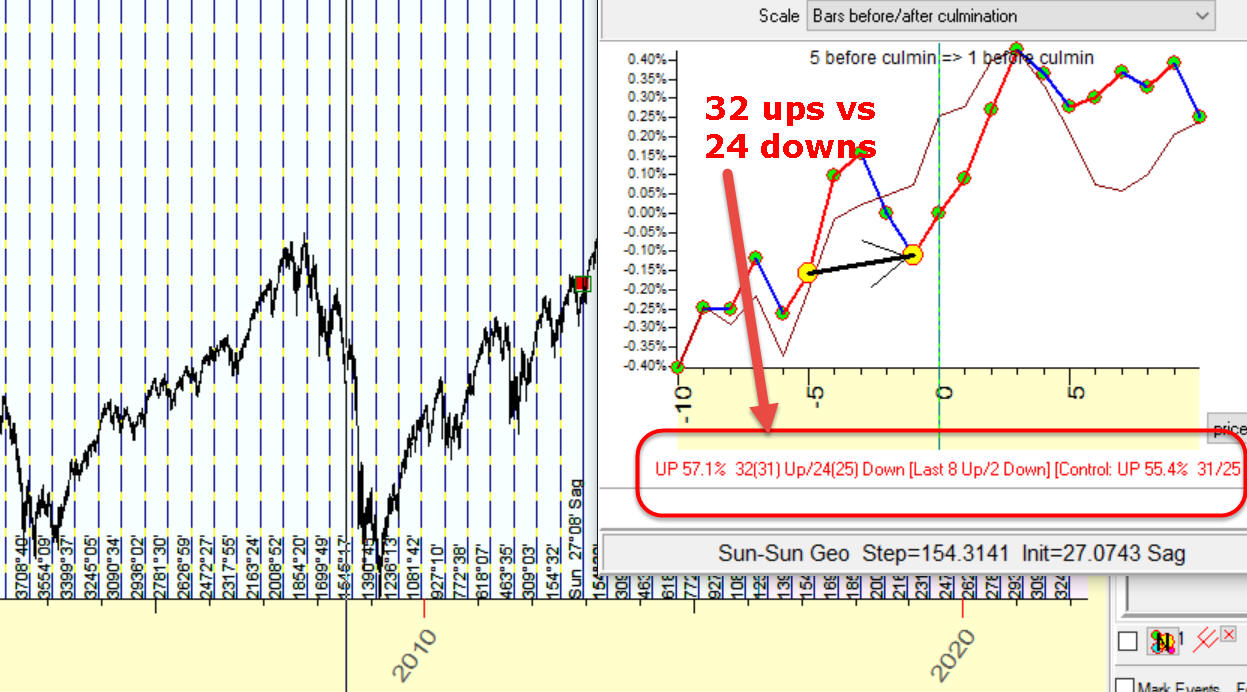
Now let's go back to
our stock market example. Can we use the above strategy to trade using our own
trading account? Would you put your money on it? Your common sense should tell you: there is some pitfall
there. And your
common sense is right: in our example we analyze the price chart since 2012 when
the market was in a very strong trend.
If we extend the analyzed period to cover uptrend and downtrend zones, our
results become not so impressive - 32 ups versus 24 downs:
You see, in these two examples we tried to apply standard
statistical formula to estimate financial parameters and in both cases we failed
in our estimations. This is why I wrote this class - be careful when somebody
uses standard statistical formula.
One more example: somebody has invented a trading system
that makes 100 trades, and 70 of them are winning trades. With the probability
of 99.5%, this is not an occasional fact. However, it does not mean that the
next 100 trades will be so good.