Timing Solution in progress, 2016 - "Where is TRUTH?"
Almost 10 years ago, in 2006, I did a first attempt to define the general direction of Timing Solution software development. This article is here: http://www.timingsolution.com/TS/Articles/Progress/
Since then, many things were done. Now, among Christmas celebration and the New 2016 Year, I would like to think about our next movement.
Ten years ago, in 2006, my task was quite simple. Describing our plans, I did that mostly in terms what should be done, what module to add, or what feature should be developed in the nearest future. It is like I planned to make a toolbox for a handyman, with a purpose that he will find there any tool that can be used in some house fixing, and with an ultimate goal that any handyman will be able with that toolbox to make his house comfortable and cosy. In regards to Timing Solution, that would mean including everything that may help to create a projection line (as a purpose), and help traders and investors to make profitable trading decisions (as an ultimate goal).
Now the situation has changed. Timing Solution software, as it is now, covers practically everything that may be used for building up the projection line. If there are some features left that may need to be added to the software, it is not a problem. Instead, the main question now is: if I add another feature or another module to Timing Solution software, where is the TRUTH? Will be anybody able to make some $$ using this feature? I am not interested in adding features that are good only for mentioning in our advertisements (like "the software does this and that plus something else...").,
There are three points I would like to discuss:
1) What we are looking for?
As it is now, Timing Solution software allows to forecast 10% above the Chaos (more info is here http://www.timingsolution.com/TS/Articles/10pc_above_Chaos/index.htm ).
In terms of annual return, I believe we have 10%-25% per year. The last digits are provided by market sectors analysis technique. I say here about the formal techniques, i.e. to get these numbers, we have applied some trading plan for American an Canadian stocks calculated by TS Scanner software. We have monitored the results for one year. Of course, a year is not enough for the clear picture. We need to monitor that for several years to get more complete statistics information (we simply had no time as this approach has been developed a year ago, at the end of 2014).
We do another monitoring. From time to time we do polls asking about the most used techniques and features that Timing Solution users include into their trading plans. Though we cannot say the percentage of good trades provided by each of Timing Solution techniques, we still can get some objective picture regarding the workability of these techniques. Here are the results of one of those polls:
| Astronomy | 100 |
| Charting tools | 70 |
| Neural net | 50 |
| Spectrum | 40 |
| Gann | 40 |
| Turbo Cycles | 40 |
| Semenko diagram | 30 |
| Planetary Eq. Lines | 30 |
| Similarity, Intermarket | 20 |
| WFA | 20 |
| Easy Cycle | 20 |
| Easy expert | 10 |
0-100% importance scale is used here to calculate the importance of a module: 0% - less important, 100% - the most important. (more info is here: http://www.timingsolution.com/TS/Articles/TST/ ). Actually that poll done two years ago was a milestone for me: from abundance of different techniques available in the software, we (all users and me) have found just some the most important ones.
I must mention again: we do not provide any kind of Holy Grail techniques. We are focused on a kind of a trading system that allows to make $10000 from $1000 within a year. We should remember and understand our limits.
2) Where is our next breakthrough?
The first 7-8 years of developing Timing Solution software, I mostly applied methods of classical and modern cyclical analysis. My education and scientific experience was an ideal combination for that (I am a graduate of MIPT - Russian analogy of American MIT, and I worked for many years at the Institute of Nuclear Research of Russian Academy of Sciences).
That job had to be done. Only after years of creating cyclical analysis models, testing them and trying to understand what they really can add to trading - only after that I have recognized the restrictions of cyclical analysis. I think that cyclical analysis models should be modified to a new level. I call these new type models as "quantum models". You can find all techniques/articles regarding this subject on our website; simply type in knowledge data base a keyword "quantum" (it is here http://www.timingsolution.com/TS/FAQ/ts_db.htm ).
I'll try to explain the difference between cyclical analysis and quantum models. Cyclical analysis constructs the Universe from ideal sinus waves. These waves can be prolonged into the future up to infinity - like in Fourier analysis, or they may be restricted in time - like in wavelet analysis. In both cases, we deal with some waves that can be described by some formulas, and mathematicians have a lot of tools to work with these waves.
Quantum models are something totally different. Theirs is not a smooth Universe, it is built from small bricks called quanta. And we have to find/recognize how this quanta looks.
As an example let's build two models for Apple shares. One model based on classical cyclical analysis while another is based on quantum models.
This is a cyclical model calculated by Spectrum module. With this module, we have found five the most important cycles; these cycles are displayed in the bottom panel by different colors, and the next panel is a superposition of these five cycles:
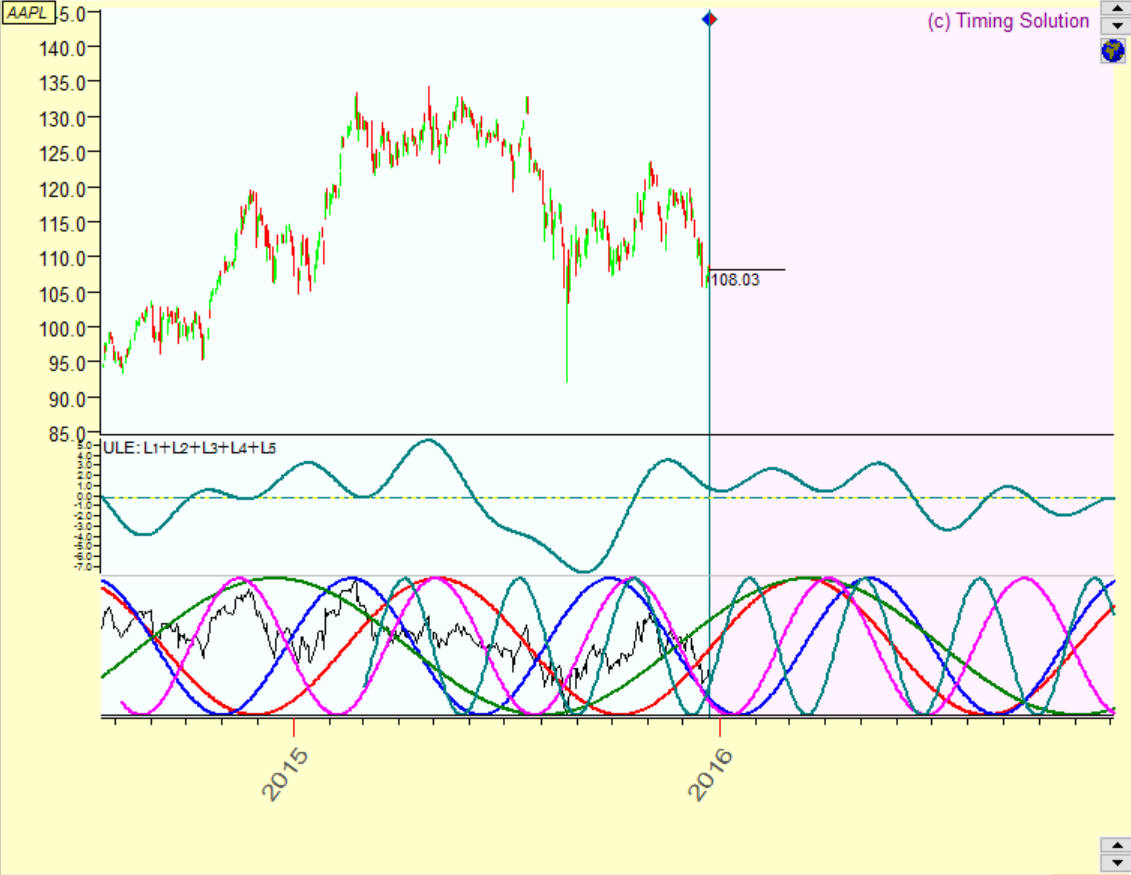
The forecast is made here from these five sinus waves; these waves play the main role in cyclical analysis.
This is an example of quantum model calculated by Quantum Figures module. You see rectangles there, take them as a quanta of the financial data:
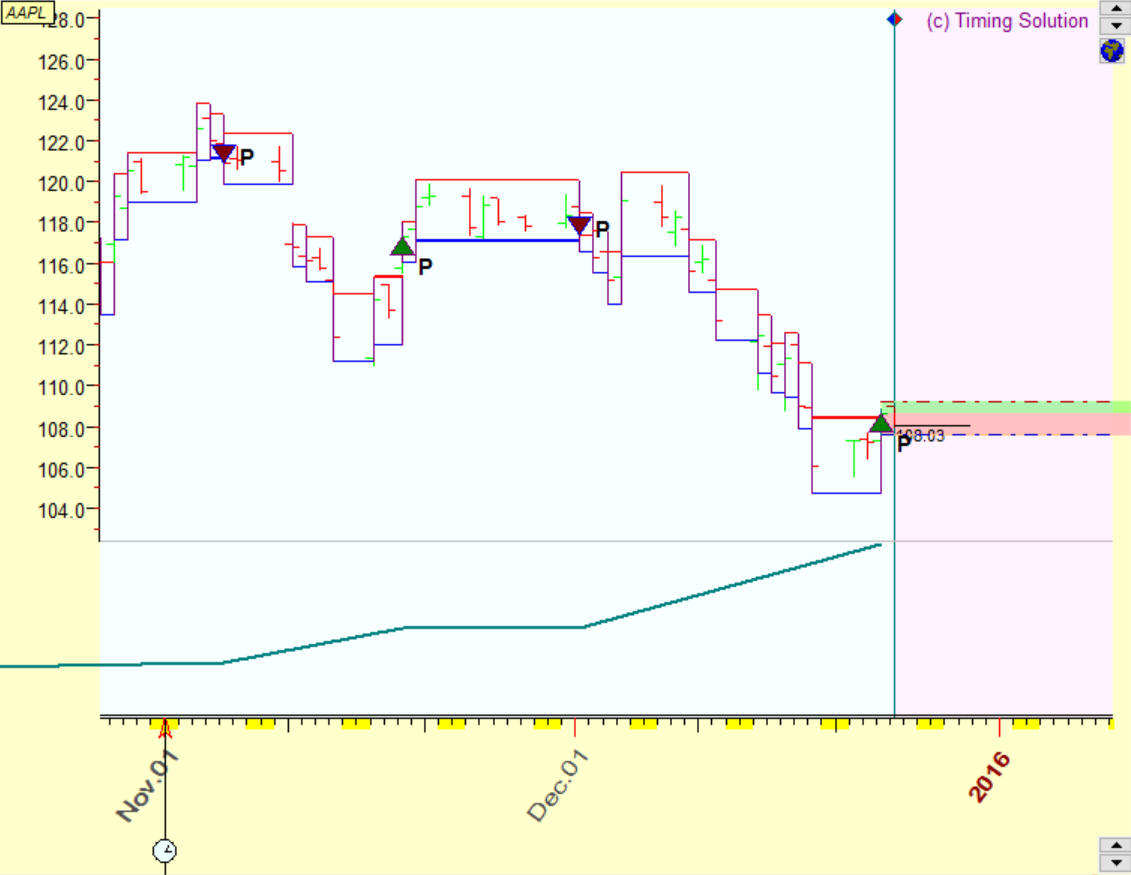
We watch the moments when the price hits this box (quanta). In other words, when the price moves within this quanta-box, nothing is happening. A trader can go to sleep during this period. But when the price leaves this box, a trader should wake up and make some decision. There are three possible situations here: it may be a buy signal, a sell signal and a trend continuation. In this particular model, buy/sell signals take place when the price hits upper or lower sides of our quanta-box. In other words, we do not care how the price moves within this quanta-box. Something important happens only when the price hits some side of this rectangle, this is a decision point.
I'll try to explain why this model "smells" like quantum physical model. I mean Heisenberg's uncertainty principle that states that maximum accuracy of a measurement for both particle's position and particle's momentum (take it as a speed) has its limit.
deviation of position x deviation of momentum >= constant (it is equal to Plank constant/2)
In our price chart above, we allow the price to move in some price/time rectangle. Inside this price/time range, the actual price movement is not important for us, it does not affect our trading plans. Take this rectangle as a single particle with distributed price and time, quanta that covers $105-$109 within last four trading days (as an example), kind of options. We build our models with quanta like that one. We do not try to analyze what is going on inside this quanta, we take this rectangle as a single particle with distributed price and time properties. When the price leaves this rectangle, it is similar to the particle changing its energy status, and it gives us the information to build the next quanta. The problem here is to find how this quanta (=brick that used to model financial data) is formed: should we use the price itself, or price momentum, calendar days or trading days or use some other metrics based on planetary positions or something else.. As physics would say, we should specify complementary parameters for financial data.
Why these models are important?
Firstly, these models allow to work with the trend (a trend continuation signal); cyclical models do not allow that.
Secondly, these models work well for intraday. Several years ago I've created a model that provided very promising results for intraday data, a kind of a trading robot. And this is not a typical institutional fast trading system that needs a special hardware/datafeed because the speed of transactions is critical there, plus these robots should be re-optimized periodically.
No, this is a robot that should work and give profit with regular datafeed (like eSignal) and a regular broker (like Interactive Brokers). Slippage will not eat all your profit here. These models need much more work, though the preliminary results are very promising. This robot trades a financial instrument directly, it is not a spread (arbitrage) system, and it makes average 6.6% per MONTH. Some statistical info regarding this model is here.
The problem with quantum models is that they are very difficult for visualization by the user. Usually they look like this: we should take some action (buy signal, sell signal or trend continuation) when the price hits some figure on the screen. These figures on price chart can look different depending on how we build our time/price quanta, like this:
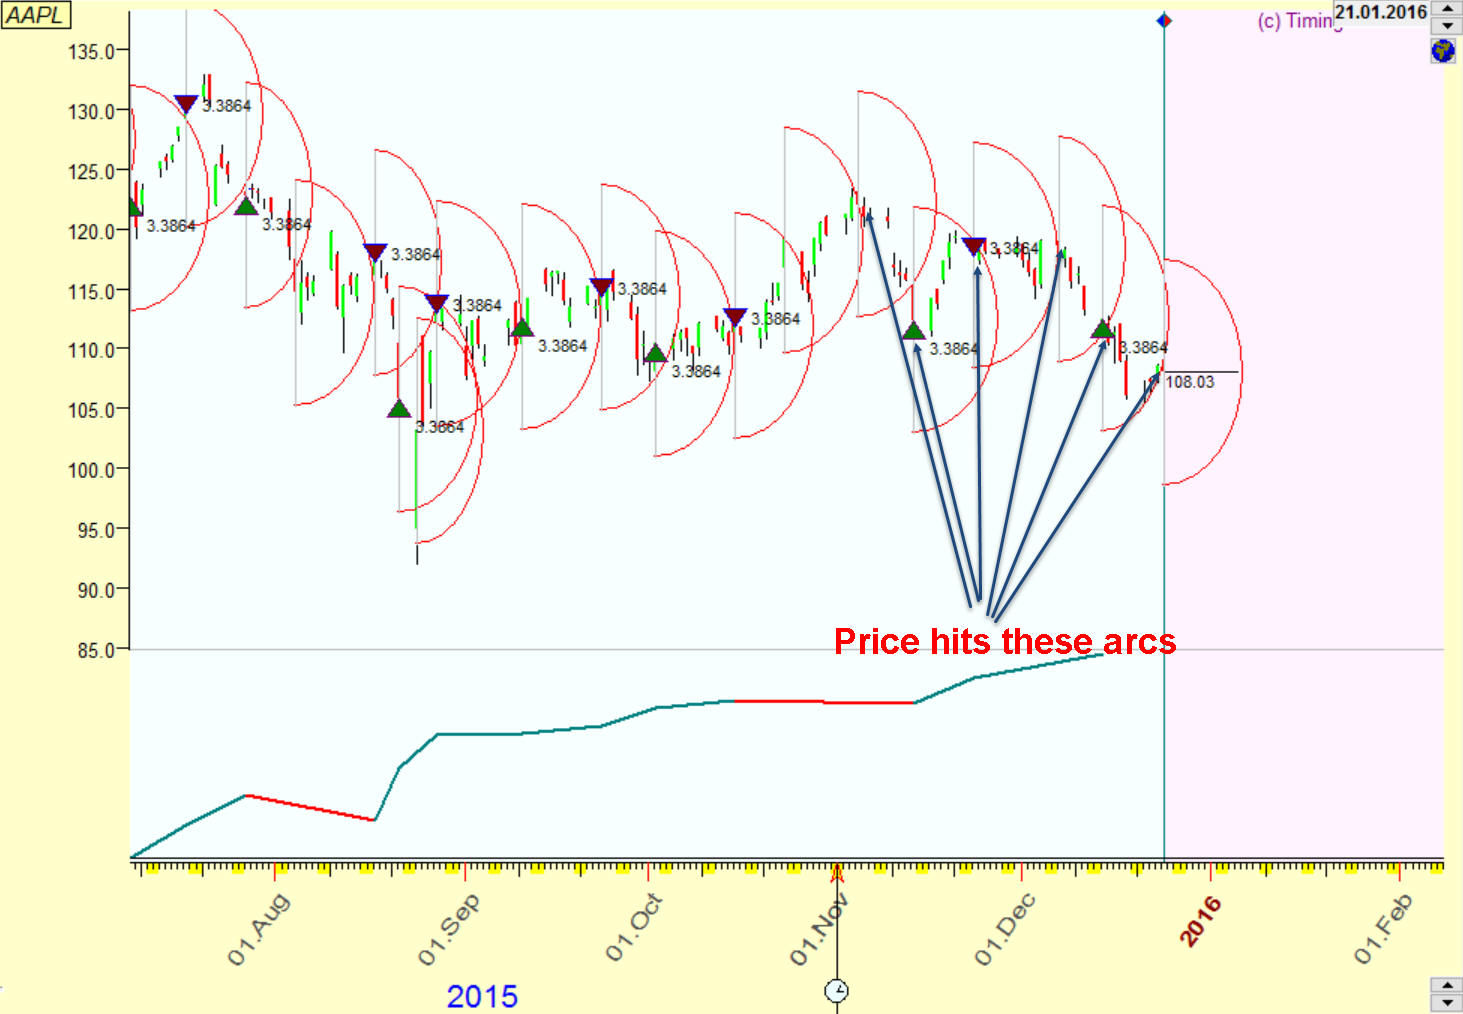
You see, when the price hits these arcs, we build a new arc and make a trading decision depending on the place where the price hits these arcs. Uncertainty principle can be formed this way:
some function (price,time) <= some constant/2
i.e. within this price/time figure we can ignore the price movement and take some action when the price breaks this figure (i.e. some function (price,time) > some constant/2). In example with quantum arcs, a diameter of these arcs can be considered as Plank constant.
Another problem is that these models need a lot of computer RAM (this problem is solved with 64 bits version) and calculation time (this is really a problem as the computer's speed is not growing so fast now as it used to be; I hope that some technological breakthrough in the future will solve this problem).
3) Not a module, but backtesting
If somebody tells you that some new technique in finance forecasting has been developed, do not take that for granted. Ask questions, and the first question you have to ask is how this technique is verified, how it has been backtested.
From my experience, to develop a technique itself takes only 10% of time and effort, while the rest 90% are spent on backtesting. Starting a new project, I always keep this fact in my mind. Very seldom developers provide a real backtesting, which is understandable: an implementation of a real backtesting may drastically change the results. It is again - TRUTH versus advertising.
Sergey Tarasov
December 26, 2015
Toronto, Canada