As I see it you guys would make twice the money swing trading, using Timing Solutions,
spending half the time you do using it for day trading.
Day trading is the hardest of a very hard game
Larry Williams
Instinct versus Knowledge
Questions regarding intraday models are the most asked ones. I receive them often, and these are the questions that I do not like to answer. The brief and straightforward answer to them would be: NO, we do not provide formal intraday models.
The reason why we do not provide intraday models is explained here: http://timingsolution.com/TS/Mini/120/index.htm
If you do not believe me, please read Larry Williams's quote above.
If you need these models and plan to work with real time streaming, it would be better to use some other software packages that allow streaming real quotes from different sources as well as building an enormous amount of indicators and charting tools. If you ask vendors of such packages about anything related to intraday (questions like "can you do this or that ...?"), you usually get the answer: "Yes, we do..." I bet the only question that will be politely avoided is that one, very important, question: "Do you have statistically verified models for intraday?"
This is my quick answer. However, the matter with intraday models is not that straightforward. There is more to consider when we talk about intraday forecast models.
Firstly, when I say that we DO NOT HAVE such models, - it means that we do not have models that I can recommend to Timing Solution users as STATISTICALLY VERIFIED models.
I can tell you more: actually, we do have some working intraday models.
Here is an example. More than 10 years ago, we have conducted backtesting for these models. These are results of the testing for one of them: http://www.timingsolution.com/BT/
The model provided 6.4% profit per month, i.e. 77% per year (no reinvesting, to get conservative % without exponential growth). It worked quite well in crazy months of 2007 - 2008 years. The model was based on 1 min chart; the maximum period in trade was 1-2 hours (as I remember). It looked like we have found the Holy Grail, it was almost there, - until we explored it more. And some terrible nuances have appeared.
The most terrible nuance there was slippage. I have calculated the model in 2010, the slippage was 10-15 seconds. (Now, in 2021, I know that the risk was underestimated 3 times at least, the real slippage for this system is 3-5 seconds.) It means that if you would decide to trade this system, you should be aware that any 10-15 sec delay in the transaction (or 3-5 seconds) leads to your potential loss. Just going to the bathroom at the wrong moment can dramatically affect your account. (That is why I call it "bathroom slippage".) The trading system should be fast, automated and working with a reliable data/transactions provider. In other words, with intraday trading you are entering the totally different territory of HFT (high frequency trading).
Stepping on this road, you are playing against some very dangerous competitors: institutional trading systems. The competitors that are armed, prepared and informed much better than you, regardless the quality of the software you have, regardless of the fact how really smart you may be. It is similar to the situation when you participate in car race competition driving a bicycle. You may be a good biker and have a very good bicycle, - and still, your chances to win against specialized racing cars are pretty slim ones.
In 2009-2010, I was involved into some activity with the group of traders who tried to develop an HFT system for their fund (actually, they used Timing Solution for that, one of the earlier versions). One of the challenges was finding institutional data feeds, with lowest latency and fastest execution time. To minimize latency, they tried to locate their robots as closer to the exchange as possible. Some guys preferred a special processor instead of PCs, to avoid the usage of the operating system. Once in several months, they had to re-adjust their robots. And they had a team of lawyers ready to fight with brokerages for improper handling of a trade (from their point of view). The whole thing was a racing with constantly increasing speed. This is how it was 10 years ago, and I believe that situation is no better now.
At that moment I have recognized that there are only two possible ways for me:
1) Join some institutional trading system. This would be more about statistics. The systems that I know are mostly based on classical statistical approach. Their creators apply the same formulas and methods - looking for areas where it is still possible to make some profit, understanding that thousands and thousands of guys like me do the same at this very moment, while sooner or later this system will stop working and they/we would have to invent something else. This process reminds me a pack of always starving/hunting animals refining their INSTINCTS. This is not bad. This is not good. This is just what that is; this is how the money smells. The only way to survive there is to be faster and smarter than others.
2) Try to model stock market behavior using any piece of knowledge that can help with it. That is a totally different story, this is more about very long term investing. To develop such a system, a person (or a team) has to have years and years ahead, with the result anticipated though not guaranteed. In the mid of 1990s when I have started working on the first versions of this trading system, it took me only about a week or a month to develop some techniques - like spectrum, composite, etc. I have applied then the knowledge of classical math techniques as I was prepared for that by my previous scientific experience. Now, in the 2020s, the developing process looks different, as we apply now totally different techniques, the techniques that did not exist before. It became possible with Terra Incognita project. When some module is designed, hundreds of Timing Solution users start using it, and usually in 6-12 months we get some understanding how this technique actually works or why it does not work as expected. Like checking if it is still breathing or not breathing. After that we make the next step of improvement that involves the knowledge gathered within these months. And this way, slowly, step by step, we are getting further. When I tried to speed up this process, making all steps at once, - often it turned out that this baby simply did not want to breath. I have a lot of modules like that, modules that incorporate some superb idea, that unfortunately does not work for trading. The latest module of this kind is Trading Spectrum: http://timingsolution.com/TI/20_New/index.htm. I still love this module, though this love is unrequited. So I can say that Timing Solution is not just a software, this is also an environment that allows to generate KNOWLEDGE. Such environment (I am speaking now not only about Timing Solution) includes enthusiasts who are developing the software and their support Group - users who apply these techniques. The whole process of developing a new software, new modules takes several years. For funds, it means practically eternity, and with not guaranteed result, it is practically impossible.
The major point of this article is: I do not have formal models for intraday, the models that work always and for everybody. That does not mean that it is impossible to make a steady profit being a day trading trader (day trading trader is the one who makes all trades within one trading day without keeping open positions overnight). I know some traders whom I trust and who really trade intraday. Still, I do not think that it is possible to convert these traders' style into some formal algorithms. I believe that these day trading strategies are very personal: there are things that are obvious for some and not so obvious for others. I believe this is because anyone of us has extremely powerful computer inside, much more powerful than any computer on the Earth. This computer is located in your head. A single human brain contains the information gathered during the whole process of human evolution, from the simplest live forms to the modern humankind. It covers several hundred million years of data!!! As an example, when we define our position in the physical space, we rely on the experience received by ancient live forms. Our movements, emotions, thinking are not a product of simple Aristotle logics, their source is much more deeper.
That is why, looking at the same price chart, we all take its information differently, emphasizing different points and pieces: our brains have different evolution memory that combines our unique personal experiences and different escaping/catching strategies of all our predecessors, starting with those extinct animals (raptors or their food sources) and up to nowadays .
Going back to discussion of formal models for intraday. I always face the same problem - these models must be as fast as possible as this is the only way to make them profitable, and this speed is getting faster and faster. This is a competition of the humankind and machines, with machines having the possibility to increase their speed (using faster computers, applying faster algorithms, etc.) while the humankind has a limited ability in this direction (wearing pampers to eliminate "bathroom slippage" does not help much, sorry).
Besides speed, there is another problem: human emotions. The trade systems that I have seen do not provide clear understanding why they work this or that way, as the machine logics is different than human's. Using the machines/computers, you have to follow some rules despite these rules may not be obvious to you; you should believe that the system works. Your discipline is a very important factor here. But ... keeping your emotions under control is not simple and easy. Trading is a very nervous business! Recently I have watched a lecture by Alex Elder about his intraday system; I was glad to find out that this is not my opinion only.
To succeed against machines in trading, humans have to find areas where we are more competitive . IMHO this area is KNOWLEDGE. We, as humans, have advantage here versus machines. And though there are already neural network algorithms that generate knowledge as well (so called unsupervised neural networks), - still, we have our advantage. It is us who created those machines and those algorithms, not vice versa.
As it is now, the tradable forecast horizon of the models provided by Timing Solution software starts from several days and more. That means that recommended models are more for swing and long term trading style. Though I have some user reports on Q-Spectrum's ability to make a forecast 2 hours ahead, I am still reluctant to recommend these models for intraday.
To build these models, we should apply other methods, beside the descriptive statistics: we should focus on MODELING the stock market behavior. Modeling assumes that we apply new knowledge, the knowledge that has not existed before, we are the first ones on this territory. This requires a different state of mind. The followers of fast trading systems assume another psychology, something like this: "I do not need to believe in anything, I am just ready to invest significant resources to get my profit very fast". "Knowledge mining" may take years and years, while most of the guys that I know and who worked for funds have changed their interest, working places etc.., and not just once.
In practice the process of "knowledge mining" looks this way: we apply different models, conduct walk forward analysis for each one of them, vary parameters, analyze results. And do that, again and again. Some models survive in this process, some are not. All together, we form TST - Timing Solution Technology http://www.timingsolution.com/TS/Articles/TST/. With it, we know now that a certain approach works, while another one works only under certain conditions, and some other one does not work at all (its effect can be explained by some artefact). Once in several years, we do update our TST, legalizing the new knowledge gathered within these years. (BTW, the next TST update will be soon, in May 2021).
As I see it now, the models that are based on the knowledge have two important advantages:
a) They provide models with longer forecast horizon, staying away from the burnout territory of trading robots;
b) They are more intuitively clear for users, as they are still a kind of trend following systems. These models are easier to understand.
As to models, suitable for intraday trading, they do not have the advantage of longer forecast horizon. Also, their logics is closer to what trading robots provide; it is very difficult to understand. I call these models "quantum models"; they will be explained later. I would say now only that, compared to knowledge based models (that pursue a certain idea, they work while the "reason" is present and stop working when that "reason" or "cause" is no longer there), quantum models keep a certain status for a while, and then it is changed in a moment, till the next "jump".
Below is a review of tools that are present in the current version of Timing Solution software (April 2021). Again, as I have already stated, these are not formal models that I can recommend. These are just tools that may be applied for intraday trading. Use them as an addition to your trading style.
Firstly, please check this class http://www.timingsolution.com/TS/Study/Intraday/ . Trading hours and exchange location are very important parameters for intraday models, especially if you apply astro based models. Neural Network model for intraday should be ignored; it does not look that it works for intraday (it is included in the article as it was written in 2006 - there was a hope then that it might be useful; years later I would not say that).
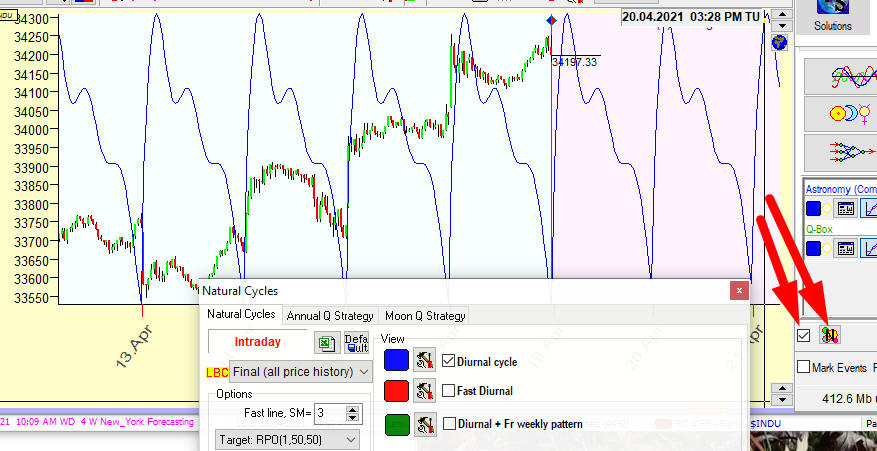
Diurnal cycle: Next, I recommend to check the diurnal cycle:
I am writing this article on Friday, so we can try to build a patterned diurnal cycle, to see how the diurnal cycle works on Friday. Do it this way:
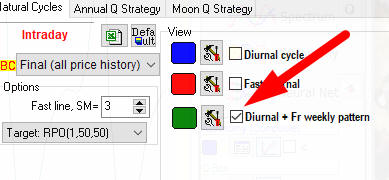
Look how these two diurnal cycles work:
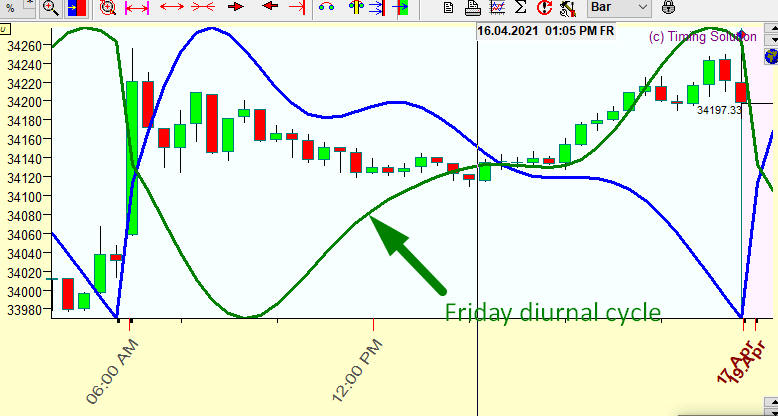
Here the blue line represents the diurnal cycle for SNP500 based on all available price history (Nov 2020 - Apr 2021). It shows that the price is higher in the beginning of trading days (around 10:20 AM) and has a tendency of going down after that.
Friday diurnal cycle (the green line) shows the opposite tendency: around 10:40 AM, the price reaches the bottom and after that the price goes up.
It is up to you to decide what projection to follow. I can only note that the visual observation may help.
Market Profile charting tool It is located here:
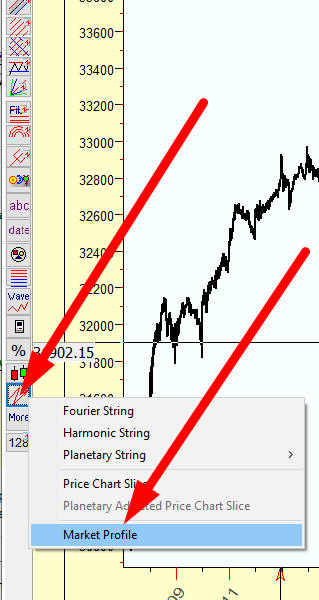
Classical market profile analyses 1-2 trading days (as I remember). With Timing Solution, by dragging the left anchor for this charting tool, you can incorporate more/less price history to calculate the price histogram:
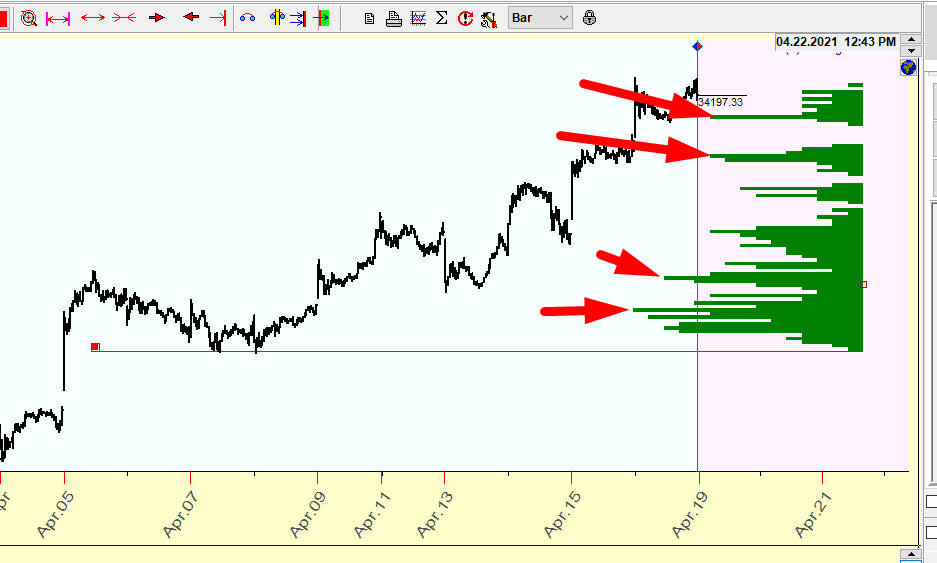
The peaks on this histogram correspond to the price levels where the price forms clusters, price levels that the price "likes" most.
Turbo Cycles module http://www.timingsolution.com/TS/Study/Turbo_Cycles/ This module has been developed specially for intraday and real time. It is one of the earlier development ideas. Users work with it a lot, and in the past I did a lot of backtesting of this module. I absolutely have no idea how to read/understand the results of this backtesting. It is possible that in 2008 we have done too many steps, with the next step made without understanding what was going on the previous step. But users work with this module a lot, this is the only reason why this module has escaped from being sent to the cemetery of ideas.
I also recommend to optimize Turbo Cycles module as explained in the video below. This is actually a very simplified backtesting.
Clock here to watch the video.
Quantum models - Price/Time equation. This is one of the experimental techniques: http://timingsolution.com/TI/9/index.htm I have not finished it yet and plan to work on it more in the future. It is possible that we will get here something useful for intraday.
This module has been inspired by math that is used in the development of fast trading systems. Fast trading systems, as I know, are based on a very simple idea. Suppose we consider two highly correlated financial instruments, SNP500 index and futures for this index. If we draw EOD charts for both of these instruments, charts are pretty much similar (of course, their values are different though in most cases they move in the same direction). If you watch these charts in a smaller time frame (like 1 min chart), you can see some differences between these charts. Slight difference is okay, so, when this difference becomes too big for some reason, - we can expect that it will return to a normal level, sooner or later. This is our opportunity to make a profit. Statistics allows to calculate parameters for this model to make it profitable. This is spread based technique. There is a huge variety of different spread pairs - like crude oil vs heating oil, 5 T-notes vs T-Bonds, DAX vs CAC 40, etc. Some programs provide spreads with very small latency (like CQG, latency is around millisecond).
We can look at the trading system based on spread this way (just an example): if the spread between instruments A and B reaches -1%, we can expect that within the next 2 hours it will reach its opposite value +1%. The trading rules for this strategy are obvious:
Spread(A,B) reaches - 1% => open long position;
Spread(A,B) reaches +1% => close long position, taking profit, stop limit order;
Otherwise, if within the next 2 hours the spread does not reach our target 1%, we do stop loss order in case the spread goes in the wrong direction, or, if the spread continues to increase but still does not reach our target +1% within 2 hours, we can close this trade or maybe leave the long position opened (this is optional).
We have two price levels here: -1% (a trigger to make the trade), +1% (a target), - and 2 hours waiting period for the next action.
In Timing Solution Quantum module, we can use a similar approach. We assume that the price moves within these price-time boxes, and we do perform some trading actions if the price hits any side of this box:
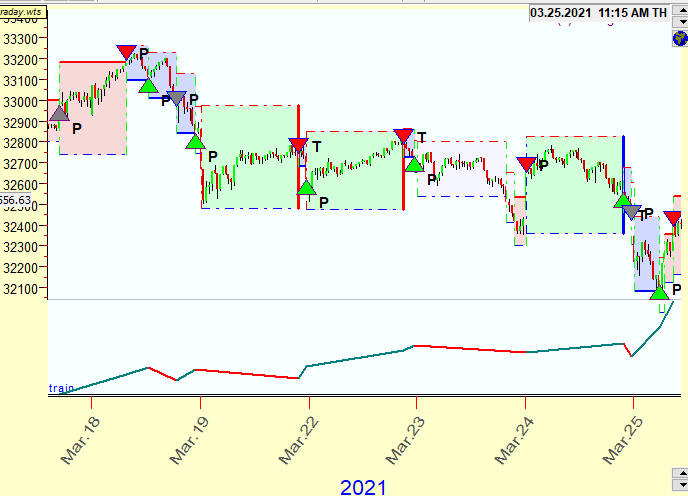
This approach reminds me quantum mechanics - price/time event - the event takes place if the price leaves this price/time box and forms a new price/time box with new price levels. I like it as an idea, though the proper name (Quantum Figures) is debatable, as my highly educated friends protect their territory fiercely.
What is interesting to me in this idea is the fact that we use the same math procedures for time and price to calculate these figures . It means that quantum figures may be formed in much more interesting ways, like these parabolic price/time figures:
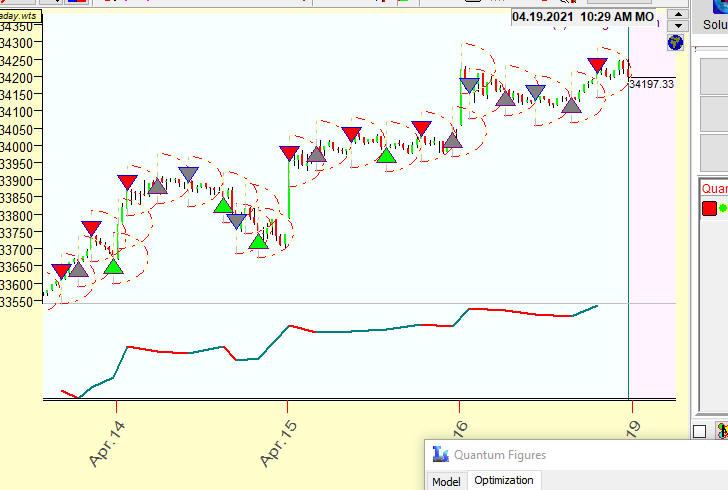
The trading signal takes place when the price hits these parabolic figures. This is actually a game changing feature that brings something totally new.
You see, in this case we have a changeable target, and the trading strategy may be this one:
Set the open position and set the target to +1%.
If within next 40 minutes the price does not reach this 1% target => decrease the target to 0.9% i.e. shrink our expectations.
in 60 minutes (20 min from the expected previous target, to form a parabola), if the new 0.9% target is still not reached => set the new target 0.75%, etc.
This is actually a process of NEGOTIATION with the stock market. We want to sell our active for 1%, the stock market says "NO"; we setup the new price 0.75%, the market says... etc, till we both agree on a deal. Quantum figures represent the scenario of this negotiation process. And this is a good example to explain the difference between the statistical approach and the modeling approach. In first example we simply find an optimal trigger and a target; this is a task for statistics. In the second case we are trying to solve a price/time equation, the best scenario to negotiate with the stock market, and this task needs much more efforts. So far this module is experimental, it needs a lot of work and testing.
PS. I wrote this article and was almost ready to release it. For some reason, I decided to look in the Internet what new is going with High Frequency Trading systems (HFT) within the last 10 years. Actually, what I was expected 10 years ago - that has happened. Please see yourselves, the article from Investopedia: https://www.investopedia.com/articles/active-trading/081215/new-alternatives-highfrequency-trading.asp
It is very important to me. It means that things that I do have a chance to last much longer. They are based on knowledge, on gifts that Mother Nature gives us. I can see how these new tendencies - use of news trading, social media, all these new directions - can be implemented into what we have done already these years.
Sergey Tarassov
Toronto, Canada
April 16, 2021