Planetary Time in Action
(comments to the new module in Timing Solution)
written by Sergey Tarassov
The Memory of Cosmos
Any technique begins with some very simple and clear idea. The idea of planetary time (PT) came to me from one of my Russian astrology teachers, Mrs. Augustina Semenko. This idea gives a room under one roof for pure scientific techniques like spectrum analysis and pure astrological techniques.
Augustina was a unique woman. In communist Russia, she worked as an astrologer in the biggest aircraft manufacturing company (Tupolev, TUs). It was practically impossible in Russia several decades ago, but this talented woman did it. The story says that there was some aircraft ground testing going and the guys faced with some hard and dangerous malfunctioning in the machine. Augustina (an admin assistant at that time) went to the chief officer and asked him a question whether they had had the same problem a couple of weeks ago. They were surprised how she could know about that as it was a classified information. It really was exactly as she said! Plus Augustina suggested them to do a major fixing of some particular device, otherwise the big problem with this aircraft should occur in a week. Does it sound like a fairy tale to you? The guys thought the same. They said, "No kidding, we do not believe in that!". However, there was a fire on that plane in a week and it burned out. When the guys came back to her, Augustina told them about another date when the same dangerous situation might occur again. This time they accepted Augustina's advice and saved the aircraft. Afterwards she did charts for the testing flights.
When I have met this woman twenty years ago, I have been very surprised by this fact. Working in a scientific facility, I understood that sometimes we face with effects that do not look like other physical processes we are used to deal with. I do not know when exactly this story has happened. However, I can show you how the idea behind it might work now, in March, 2007.
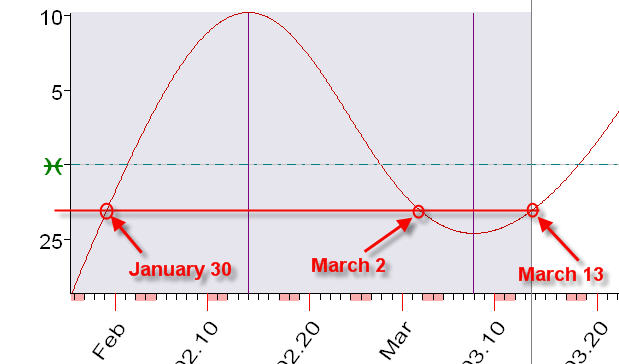
A week ago Mercury has ended its retrograde motion and started the direct one. Today (March 13, 2007) it is located at 27th degree of Aquarius. Let us look together on Mercury's trajectory:
As you see, Mercury crosses the 27th degree of Aquarius three times this year: January 30, March 2 and March 13. This is the astronomical fact. If we assume that the planets somehow affect our life, we can state that something should occur in our lives three times in regards to Mercury's effects. In other words, if something Mercury related has happened on January 30, it is quite possible that this (or similar, or reminding us about the first one) event has to occur on March 2, and a final reminder should appear on March 13. The degrees related to particular retrograde motion of Mercury form its "shadow". Mercury will leave its shadow on March 27, 2007, starting a totally new life cycle (a Mercurial one). Remember that "shadow" starts when Mercury is still direct, covers the whole retrograde area and ends when Mercury is direct again. The picture shows Mercury's shadow between 25th degree of Aquarius and 10th degree of Pisces.
The observation of retrograde Mercury gave to my teacher Augustina the hints regarding that aircraft's malfunction in early 1970s. As I said, I do not know the dates to provide you with the exact information. However, if it would occur on January 30, 2007, the same malfunction could occur again on March 2 (as a reminder of this problem), and the next dangerous date might be March 13. It is like Cosmos says to us, people, something, we do not hear; Cosmos says it again giving us chances to act or make our choices, and then It sets the final verdict for this problem. (By the way, that fact has surprised me so much that I have started to study astrology in depth. It also helped me to make a final decision and switch from scientific programming at the Institute of Nuclear Research to astrological programming.)
Later, when I met my American astrology teacher, Mr. Alphee Lavoie, I have heard about this technique again - only in respect to Jupiter. These three touches of Jupiter help to solve problems related to wellness, well-being, and material abundance (such as getting a job).
Technique Description
Now let us switch from burned aircrafts to our theme - stock market. If cosmic memory affects aircrafts, it should affect the stock market as well. As we have seen, Mercury gives three reminders demanding you to pay attention or giving you chances to do what you should do. The same is true for other planets (except the Sun and the Moon). Look at these zones:
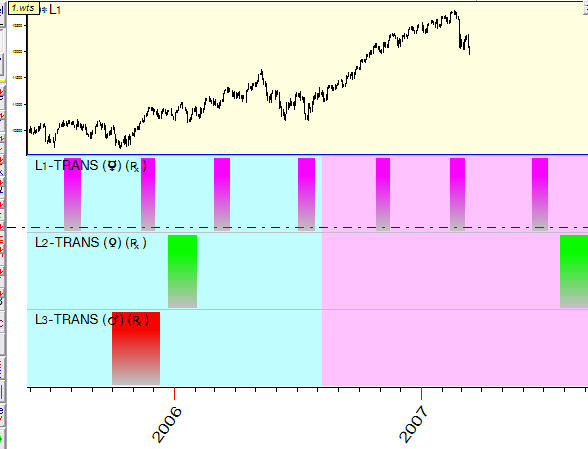
These colored bars show the periods when Mercury, Venus and Mars are retrograde; in other words, during these periods the planets try to "teach" us something.
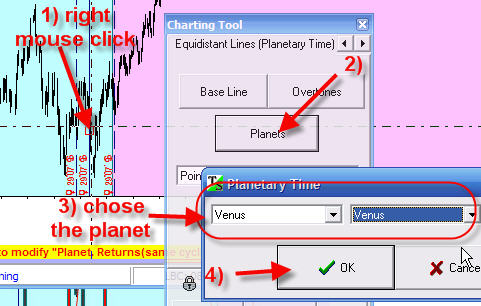
Let me show you one thing. In Timing Solution choose this item:
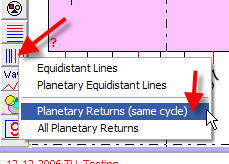
and drag the mouse across the screen. You see sometimes that the program shows three vertical lines:
These lines correspond to the moments when Mercury is located at the same Zodiac position inside its shadow. The general idea of this technique (an astro charting tool) is that we are looking for the moments that somehow are related to each other; it may give us some tips regarding future market movements. What is good is that these moments are pointed by planetary positioning and do not depend on our subjectivity. (This module is "a charting tool". It does not provide neither any evaluation in numbers nor the projection line which is possible by means of other modules of the program like ULE and Neural Net.)
Click here to see how these Mercury "shadows" appear and disappear while we drag the mouse.
I believe that this issue is worth of detailed research in respect to every planet. Here are some hints regarding Mercury. It looks like the Mother Nature tells us about some problem while Mercury is direct. When it becomes retrograde, this signal is much more stronger, and finally, on the next direct movement, we receive the final estimation of this situation in respect to our action (the aircraft burned out).
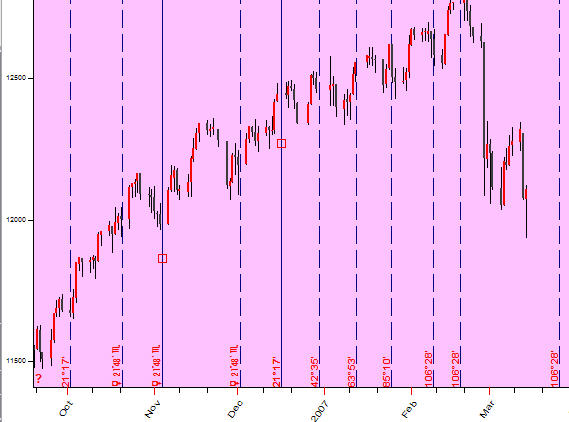
These are Mercury's doings in summer 2006:
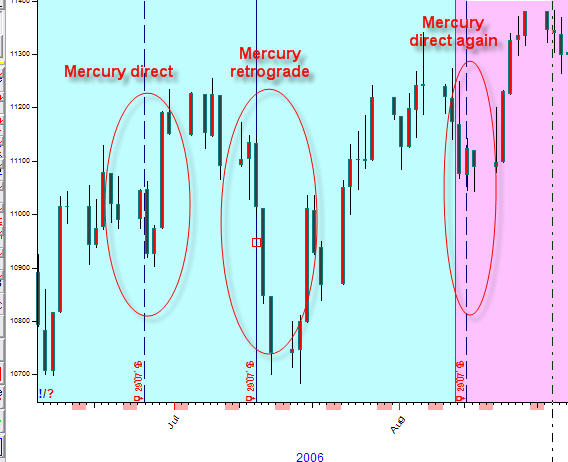
The first signal with 1.25% drop took place on June 27 (Mercury was passing 29th degree of Cancer). Then, in the middle of July, Mercury reminded us about this situation again while being retrograde. It caused three terrible days for the stock market. In the beginning of August, Mercury has passed this degree again. The draw down was not so dramatic. Looks like "students have done their homework": Dow Jones Index has recovered and gained 7 uptrend months.
Changing the properties of this charting element, you can change the planet. Remember that this technique is oriented to the planets having a "shadow" (regions located around the retrograde zones):
For example, there is no Mars shadow now (in the middle of March, 2007), as it is far from its retrograde zone, so the program shows the current Mars position only:
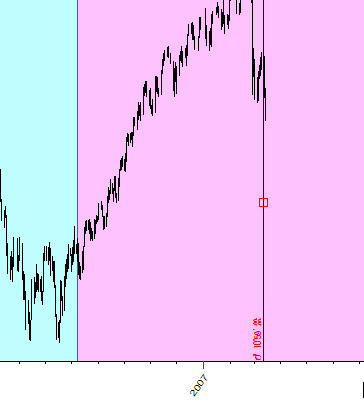
However, Saturn has its shadow now:
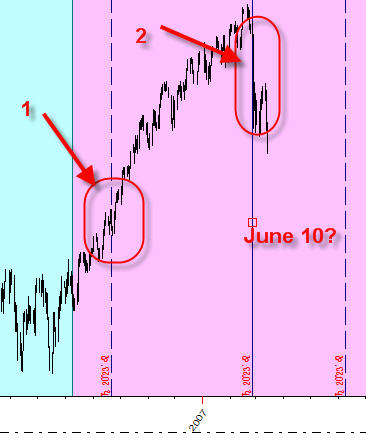
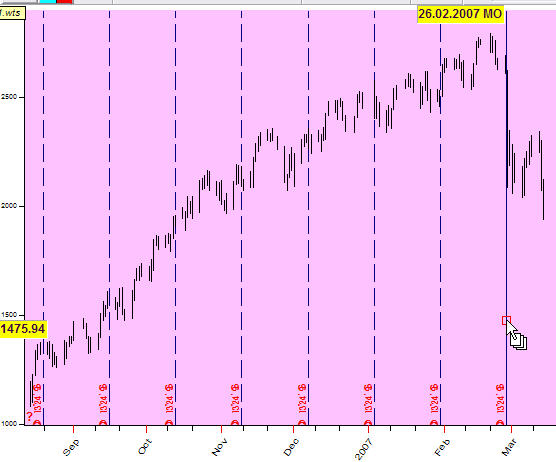
If Saturn tells us something, we would expect some action on June 10, 2007. What might it be? See the hint from the first Saturn's reminder:
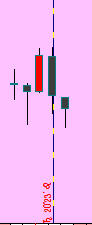
The second hint is a giant drop on February, 27 which is visible in any price chart scale.
So, do your homework and make the conclusions yourselves. I recommend to check all these hints for important events in the stock market. You can use not only planets themselves, try different planetary combinations as well (like analyzing the angle between Venus and Jupiter in geo and helio coordinates).
Another variation of the same idea is presented by "Planetary Returns" technique: it shows all dates when some planet has passed a certain position (caused by other reasons, not only by retrograde motions). Here is how it looks:
This picture shows the moments when the Moon is located in certain position.
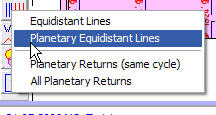
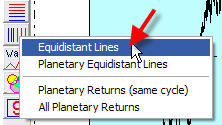
One more technique is called "Planetary Equidistant Lines":
Drag the mouse from one point of the price chart to another (let say, from point A to point B):
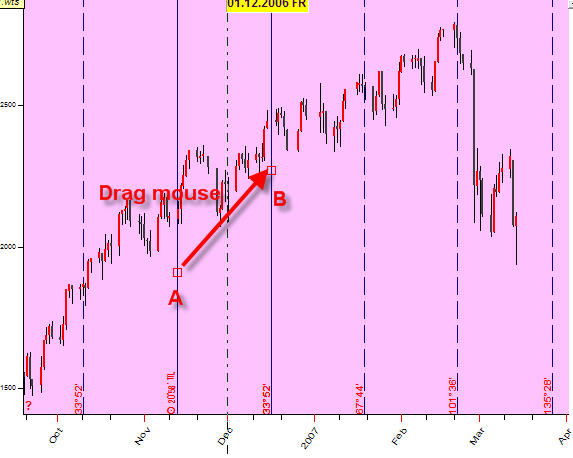
The program calculates the Sun's (or any other planet's) position at point A and the angle difference between the Sun's position in points B and A. In our example, the Sun has passed 33 degrees 52 minutes between these two points (the Sun at point A is in the 20th degree of Scorpio). Thus, the program shows all moments in respect to the Sun position with the step of 33 degrees 52 minutes starting from the point A. (The next line is set at 2*33.52=67.44 degrees, etc.)
Click here to see how to draw these lines in Timing Solution
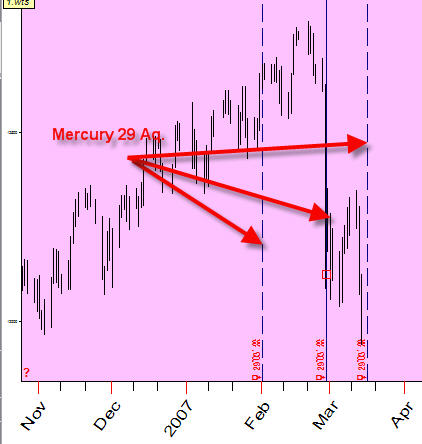
Sometimes these lines look very funny. As an example, see these lines calculated for Mercury:
This irregularity is caused by Mercury's retrograde motion.
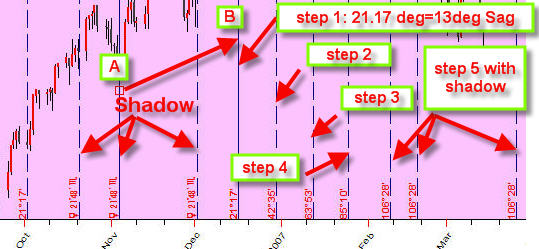
The initial point A is in the beginning of November 2006; Mercury has become retrograde in 22nd degree of Scorpio, this position of Mercury has a shadow. The second point A is 13 degrees of Sagittarius; the distance between these points is 21 degrees. We calculate the second step point the same way; this is 21.48 Scorpio + 2*21.17=4.22 degrees of Capricorn. We come to a shadow zone again doing step 5.
While working with this module, it is very important to find the "key" planetary combination that catches turning points. For example, working with Dow Jones Index for the last 2 years (2005-2007), I have found that the angle between the Sun and Jupiter provides good results; as a basis I used two major turning points (July 17,2006 and February 20,2007):
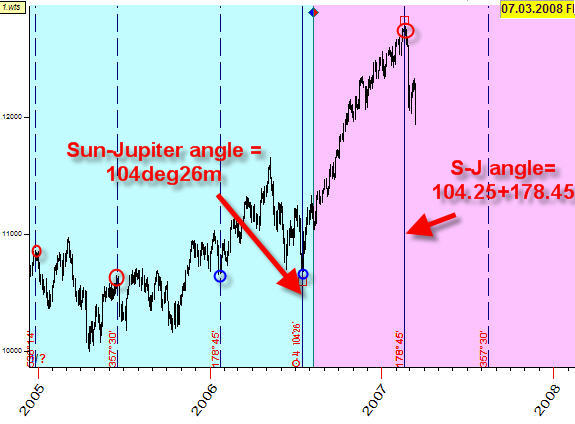
Here the first turning point (a bottom) occurs on July 17, 2006; the corresponding angle between the Sun and Jupiter is 104 degrees. For the next major turning point (a top) on February 20,2007, the angle between the Sun and Jupiter ha changed on 178 degrees. Adding/subtracting this angle, we can get the dates for other key points in the future and in the past: in the past - to see how well the stock market "remembers" this combination, in the future - to use this info for our trading. However, not all turning points are described by this model.
This method is very similar to another astro charting tool:
It draws the equidistant vertical lines, equidistant in time, like this:
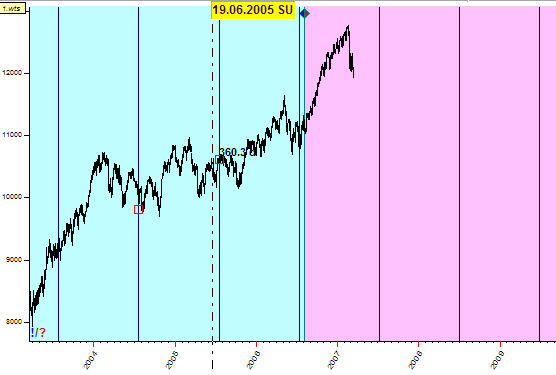
The difference between this method and the next one in the same menu that we use different time metrics. In the example above, vertical lines are distant from each other for 360 days - we use Julian Time to calculate the distance between two lines. When we work with "Planetary Equidistant Lines", we do exactly the same but instead of Julian Time we use Planetary Positions as a measure of the time. Because the planets move non evenly and sometimes become retrograde, these lines are located irregularly.
Going into Depth - Planetary Time
Working with Composite module in Timing Solution, I have understood that we can work with planetary angles exactly as we do with usual Julian time. Suppose the Universe uses the watches that point Mercury's position instead of even minutes that measure the time by means of the atomic clock. The world that uses the planetary time looks very strange sometimes: time there might flow sometimes in the opposite direction (when Mercury is retrograde) and forces us (or gives us a chance - what would you prefer?) to go back to some events of our lives. This is the irregular time, and we have to re-live some periods of this planetary life several times (three times). If we return to the example with the aircraft in the beginning of this article, we can say that these points are belonging to the same planetary moment (while we have three different events in Julian time):
From the point of view of the planetary time, the Universe takes these three events as just one event, thus they should be similar to each other.
Surely this is a mathematical construction, nothing else. But some well known astrological techniques look in this strange World very logically. For example, the planetary lines in the planetary time Universe look as simple straight lines. So, the trend lines in this Universe will look in our normal World like planetary lines.
Moreover, the planetary time concept makes possible the application of such sophisticated math techniques as spectrum analysis. Timing Solution allows to calculate spectrum (i.e., find the cycles) in this planetary time. As an example, look at this periodogram for corn prices calculated in Venus geo time:
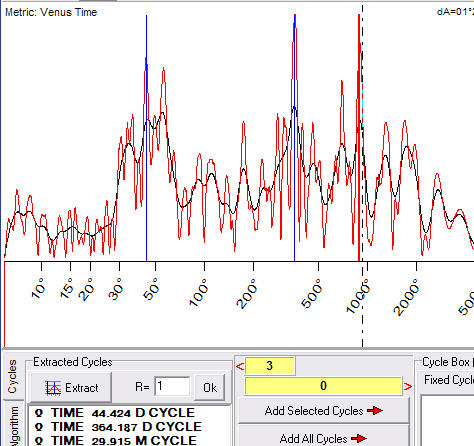
You can see that there are at least three strong cycles in corn prices; however, these cycles exist in Venus geo time. Here are these cycles:
1) 44.4 degrees Venus cycle;
2) 364.2 degrees Venus cycle, and
3) 900 degrees Venus cycle.
These cycles provide us some hints as to what angles are better to use in "Planetary Equidistant Lines". Also, it makes the phenomenological approach (used in Timing Solution) more accurate and scientifically logical.
For example, Timing Solution software can extract cycles from periodogram and generate the projection line based on these cycles. However, these cycles exist in planetary time while the results are shown in our usual time that we used to live in.
March 15, 2007
Toronto, Canada
Sergey Tarasov