Quantum models - Ideas versus Digits
Introduction
In this article I try to rethink the approaches that I have to model the stock market. Almost 20 years ago, in 1995, I started this road - creating a forecast model for financial data, a projection line.
I considered this problem as a classical prognostic problem - like weather forecasting, Earth population forecasting, sea level forecasting etc. At that time it was very clear for me what kind of math should be applied for this task. These were the things that I knew very well: spectral analysis, wavelets analysis, auto regression etc. However, when I actually started to work with the forecasting model, a strange feeling of some "missing link" has appeared. And this feeling is always present in my mind. The standard techniques that I have learned in my University, the same techniques that work well for many things - from atoms to Galaxies, - these techniques being applied to the stock market reality somehow do not give good results. Some other forces move the stock market. What are these forces? I don't know. But - it looks like the face of these forces becomes more familiar to me than it was 20 years ago.
Harmonic World
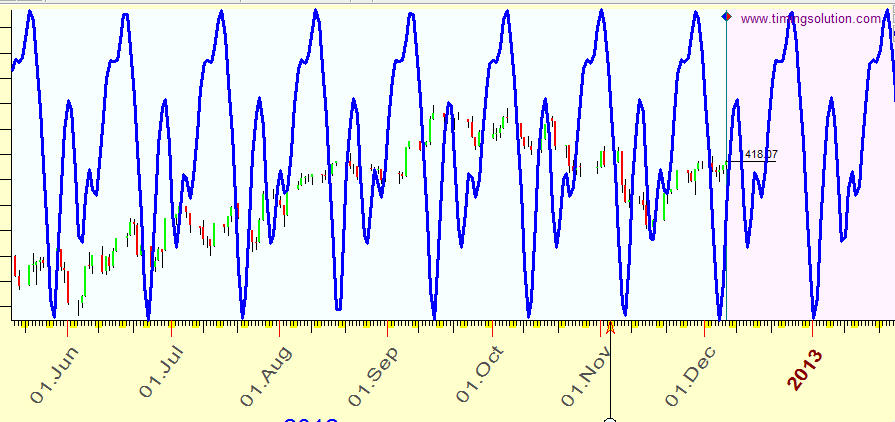
Being armed with standard math methods, with standard statistics techniques, we try to understand the stock market's price chart as some smooth harmonic process. A good example is this price chart below that can be explained very well by three harmonic
waves, 18,36 and 114 days cycles:
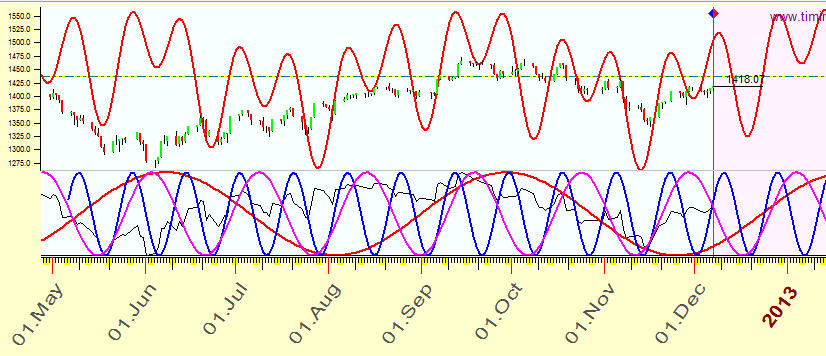
It is easy to make a projection line for a such chart. Usually people believe in these projection lines, at least they keep them in mind. These lines provide some order, even some beauty in the tough stock market reality. The idea of cycles also coincides with our life experience; though we live in a real world that is full of problems, we still know that the day comes after the night, that winter is not forever - it will be followed by the spring and summer. So, if we observe some cycle that is now active on the stock market, we are inclined to expect a top after some bottom. We like the idea of cycles; at least, the knowledge of active cycles gives any trader or investor peace of mind. Stop. It sounds like an advertisement, while I want to speak about the Truth... And the Truth is somewhere out there... The reality is: the cycles do not live forever, they live some limited time and stop working after that. The wavelet analysis helps here a lot. Look at this chart:
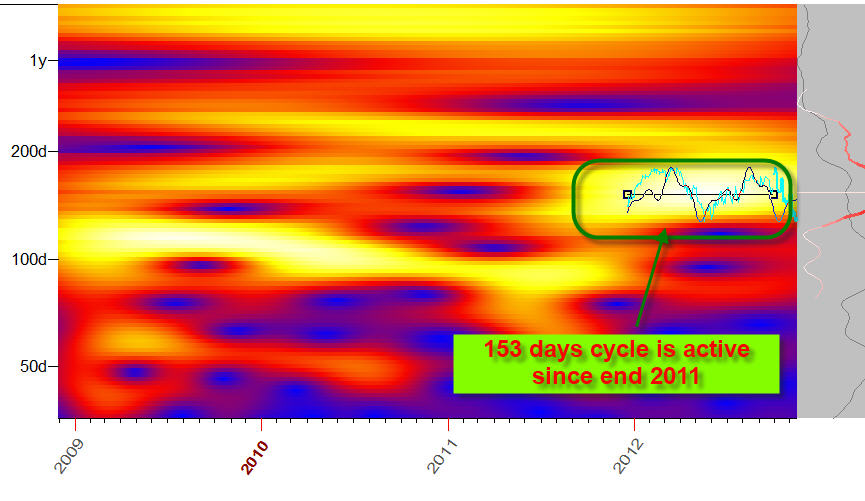
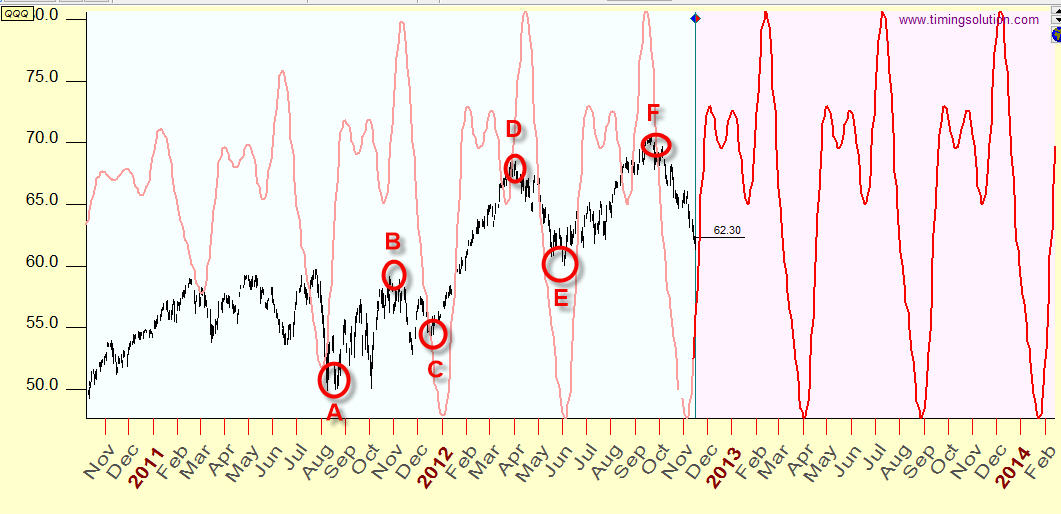
This wavelet diagram shows that, starting from the end of 2011, 150-days cycle works on the market; yellow horizontal stripes indicate that. This cycle did not work prior to this period, and I am not sure that it will work in the future. It simply links these six turning
points ABCDEF:
Inertia - smooth World
Most cyclical models are based on the assumption that there is some inertia in the movement. Like it is not possible to stop a train immediately, there should be some distance where the train can lose its speed, however small. Due to inertia, all movements become smooth, and the movement of planets around the Sun is a classical example of that smooth movement. Many technical analysts apply the idea of inertia, directly or indirectly. As an example, consider some specific algorithm based on the assumption that the speed of a price change (i.e. momentum) does not change too fast. It is very similar to the idea that the speed of a rocket cannot be changed immediately. The similarity of these ideas is not surprising as many developers of these indicators come to stock market analysis from science side (like myself). The idea of inertia is on their blood. But at some moment a new understanding comes. The laws that explain well enough all movements in the physical world - movements of galaxies, stars in those galaxies, planets, everything what we see and do not see, including atoms, electrons, neutrons, quarks etc., - and the laws that explain the moves of the stock market - that include traders' hopes, fears and actions as well as stock market crushes, humans activity and mass activity, - are not the same. These laws are different.
Zero inertia - stock market World
Can you assume this smoothness for financial data? Definitely not. The stock market reacts on fundamental events very fast, practically immediately, in many cases in advance. We can specify the stock market as a system with zero inertia or even negative inertia.
Experience shows that the stock market is explained better by the models that assume that the stock market jumps from one state to another. I tend to think that the stock market movement is not a movement from one price level to another, like a seasonal movement from spring to summer which is explained by the Earth's movement around the Sun. The force behind the stock market is a game of traders/investors fears, hopes and nerves.
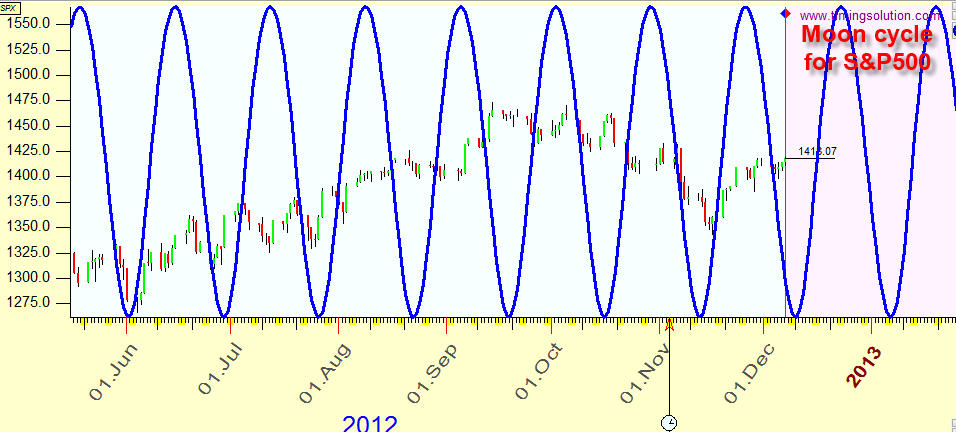
Right to this moment, we could consider this article as a general discussion of a very general problem. However, this general problem rises a very practical question.. For example, how should we construct a model that describes the Moon's effect on the stock market?
As a base function, we can use a sinus curve, like this one:
or different combinations of sinus curves, like here:
This is a classical approach; it is the first thing that comes to my mind any time when we discuss a model of a planet moving around the Sun or electrons moving in the electro-magnetic field etc.
But - modeling the stock market, we deal with some other phenomena. We have to remember the presence of a humankind in this picture. Big game, big money, battle of human nerves. Sometimes something changes in this picture, somebody lose, somebody wins. The system jumps to another state.
To some extent, it is not important how the price moves itself. How traders/investors percept this
movement - that is really important. There is some kind of a prism between the stock market and forces that move
that stock market. And that prism works with human component. We need to model this prism somehow, otherwise
we have only classical math methods to apply - such as spectral analysis, auto regression
etc. We will have so many nice toys that provide us nice looking classical curves
(like a sinus curve above) and their different variations. The problem is that
these models do not work good enough. We cannot ignore this human prism, we have
to find this "missing link".
"Human prism" technology
I have no yet any completed technology to employ this human prism to Timing
Solution models. As so far, I have tried different approaches that are very unusual from the point of
view of the classical math approach. However, all these techniques have one mutual peculiarity:
when some value reaches some critical level, the system switches from one level
to another. Here is the example - "quantum moving average":
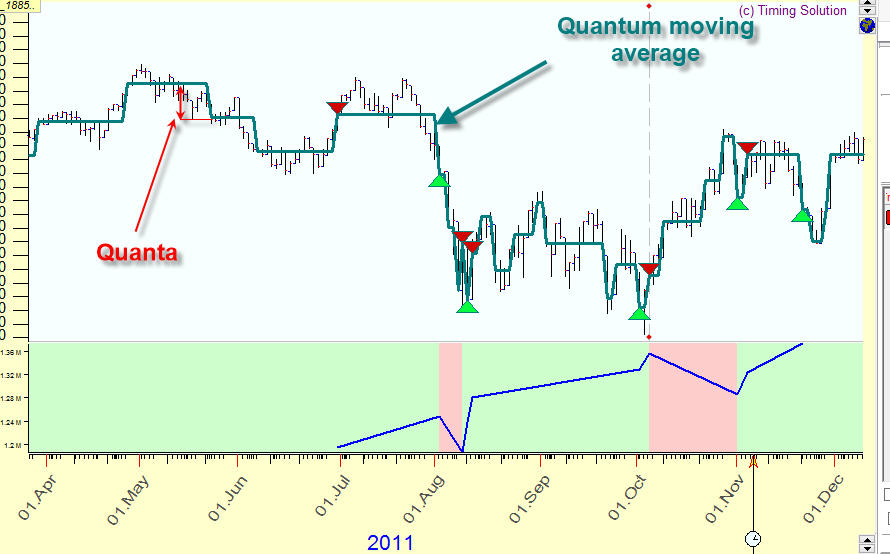
The price chart here is modified; instead of a smooth curve, now it looks as a
jumpy diagram. The price jumps to the next level
when the price change reaches some critical value. That critical value is quanta. All smaller
changes can be considered as random fluctuations, and they may be ignored.
But - when the price change reaches that critical value, the picture changes. These non smooth
charts provide better, more profitable trading systems, especially for intraday
charts.
Why? Why these step/jumpy charts generate better buy/sell signals?:
Almost three years I did not understand this fact. Then one day, looking for an
answer to some question of a user, I came across one of my old articles. It was
about Fuzzy Logic; you can see it here. Yes, of course, these jumpy
diagrams represent the human perception. How does it work? Here is an example.
There is a man, and he is 183 centimeters high. How do we understand his height?
Our brains do not like pure digits; instead, we try to find something else that
we can understand easier. We think and say: "This guy is very tall",
or "this guy is tall" or "not tall" etc. We keep in
our minds the idea (the information) that he is "tall", not the
information of "183 centimeters tall". And, based on what we consider
as "tall", some of us make think of the guy as "very tall"
while others may decide that he is not tall at all. These grades are more
convenient to our thinking process. Instead of the abstract digit, 183
centimeters, we have a kind of some image/idea of "a tall guy"
in our brain. Digits are for computers while ideas are for our brains. It is
obvious that these step/jumpy diagrams represent a switch from one grade to
another - uptrend movement becomes "not significant", or
"moderate", or "significant", or "big". Digits are
still there; now we add "qualities".
Ideas versus Digits
At this moment I would like to make a very important point. Everything we have
discuss earlier (on this website and anywhere else) was related to the models based
on digits. It is not surprising that MATHEMATICS was so much involved in the
stock market analysis. And most of gurus were operating with marvelous amount of
digits. Do you remember all these "price change plus 2.4%", "momentum 1% per
day", "current moving average $27.4" etc.? The digits have been
the core of the analysis, and we have constructed the
future forecasts based on these digits. So, MATHEMATICIANS understand digits and
only digits. As I said, digits are in their blood. Do not take me wrong - I
myself love mathematics, it is the most universal language, and I am proud that
I belong to the clan of mathematicians. But - TRADERS and INVESTORS (consumers
of math products) are different. Not all of them are mathematicians. Of course,
they see digits. Though they do not think digits and they do not live by digits.
They make their decisions translating those digits into somewhat more
comfortable, more understandable. They operate by ideas -like this: "the price
now is too high", or
"..too low" or "it is the right price". They go by
ideas for timing as well - like
"time for correction", or "end of November", or "we are waiting
Christmas rally" etc.
All decisions they make are based on a combination of ideas ("the price is too high, it is time
for some correction"). Here is the core difference between forces that move
physical phenomena and the stock market. In physics, scientists deal with exact digits;
their statements are digit-related, quantitative ones (like
"nuclear chain reaction has started because it reached a critical mass of 11
kg"), and these statements have the same meaning for any
scientist/mathematician, just because they use the same digits. On the contrary, traders decisions usually are based on ideas, not exact
digits. Of course, digits matter for them, too. And they include also
qualitative component. It explains partially why different traders react so
differently to one and the same market events ("too high" for one
trader may be quite 'low" for another). That is why we need to operate with grades/ideas, and
that is why the quantum
modules in Timing Solution has been developed.
Let me show you some examples:
Example #1: price channel quantum model. Here the price moves
within some price channel:
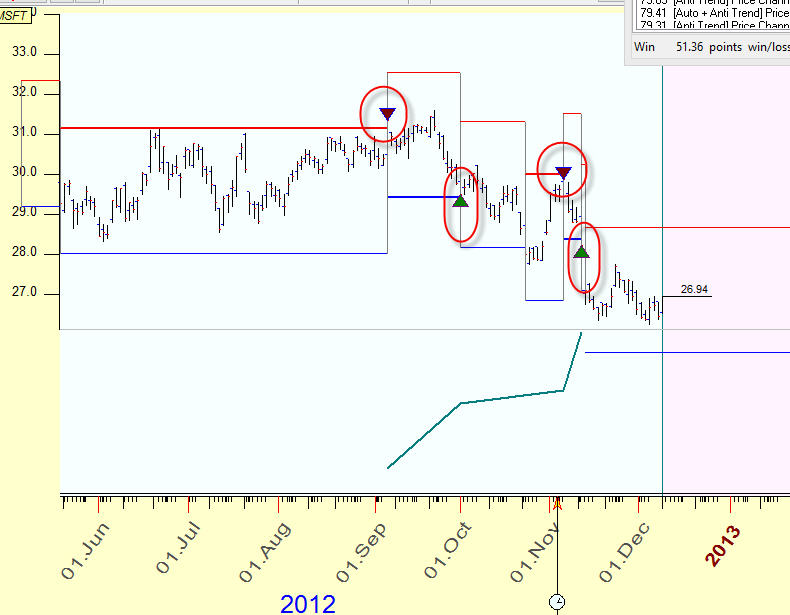
We consider the price movement inside this channel as random
fluctuations. When we create this model, it tell us: "Do not perform any
action while the
price fluctuates inside this channel". And when the price breaks this
channel, some event happens; this is a kind of a decision point. At that moment we
can decide whether to keep following the trend or make a trade in anticipation
of a new trend. The channel at
this moment is recalculated as well. The main issue here is to find the
proper
algorithm to calculate this channel, finding the best width for this channel.
Within few second the program analyzes thousands of models trying different
channels - just to find the channel that provides the best profit.
Example #2: price-time vector quantum model. In previous
example we have ignored the time factor while considering the price model. Now
we may anticipate the next
tuning point using some significant price levels or using some time count or
both.
We can consider these techniques separately - like use Fibonacci ratios to
calculate support/resistance levels and spectral analysis to reveal cycles for
timing. Please remember that these are two absolutely different techniques, pricing and timing,
located in two different boxes. Very often traders make a decision using
charting tools like Fibonacci, Andrews pitchfork, trend lines etc. With those,
they work with a kind
of two dimensional price-time Universe. It reflects how a trader percepts the
price chart - price and time together. From pure mathematical point of view, this
is a very risky step, similar to comparing "apples and oranges", i.e. these
entities price and time are totally different. With quantum model we can do it
too,
the program finds the optimal ratio between the price and the time. This is exactly the same
thing as finding the proper scale between price and time for charting. The distance
between two events is measured by price-time vector (properly scaled). It means
that events happen at the moment when the price breaks the ellipse, like on this
picture below (a yellow
ellipse):
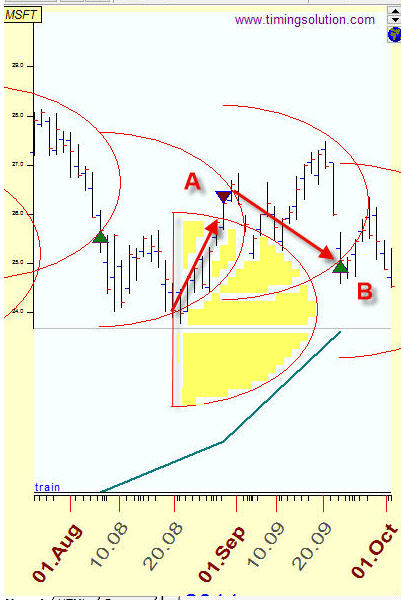
The decision point here incorporates time and price together. This model tells us
"Do not perform any actions while the price/times varies within %X
days/dollars". We measure the distance between events here using price-time
vector.
Below you may see more quantum figures and trading system based on these
figures:
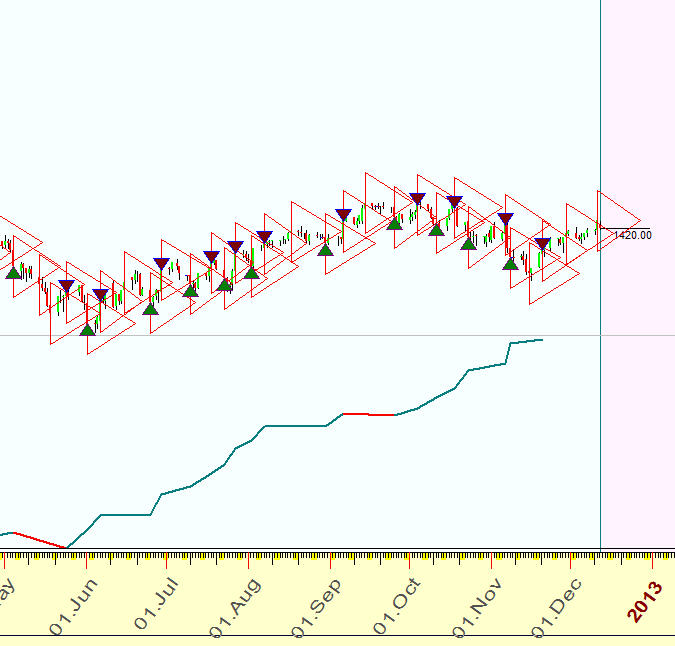
Triangle breakout:
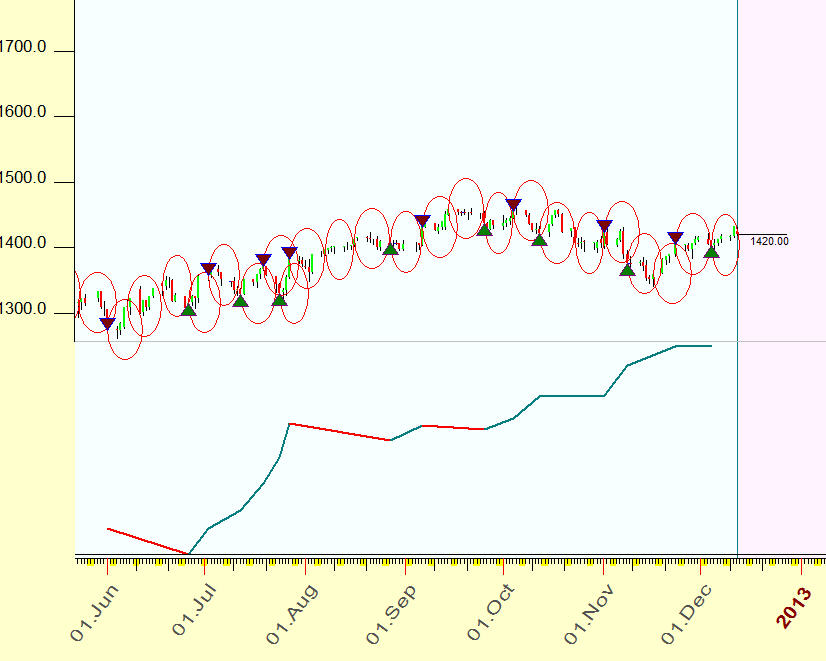
Ellipse breakout:
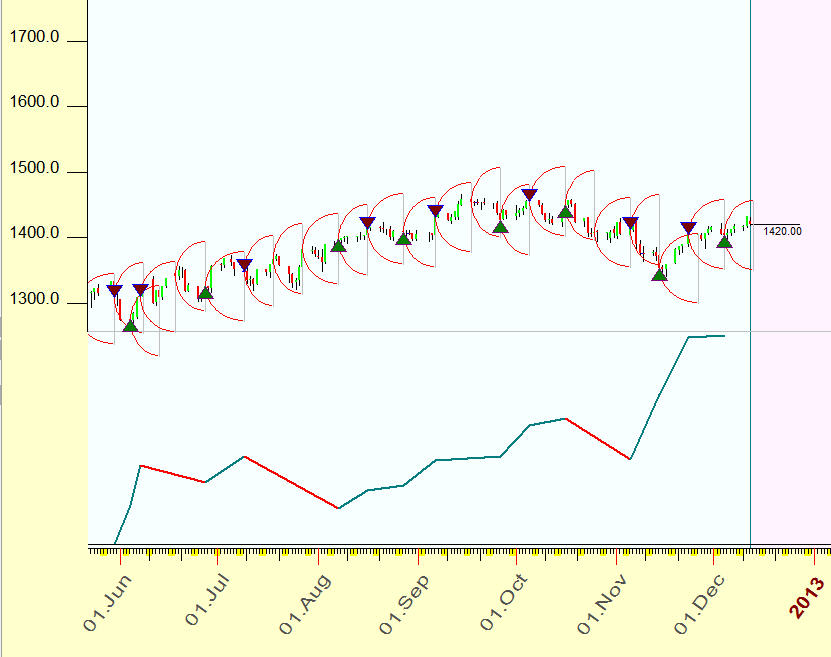
Arc breakout:
Sergey Tarasov
December 2012
Toronto, Canada