Saga about fixed cycles II
written by Sergey Tarasov
Can we use the cycles for stock market analysis? I believe this question is not a technical question only This is a kind of religion or philosophical question for many investors. The idea of existence of some regular cycles in the stock market behavior is very appealing; it promises us some Order in the sea of Chaos. Speaking in terms of Greek philosophy, the ideal cycle is like a Plato's Ideal Bodies, a starting point from which Knowledge begins.
I state that cycle analysis can be applied for stock market forecast. In this article I show the most common misunderstandings regarding cycle analysis and its modern applications. Also you will find at the end the basic theory of cycle analysis.
Magic X Cycle
If you ever thought about stock market investing and looked for some advisor who could guide you there, you probably have met Mister/Miss X who spent many years doing a research and reading old manuscripts. Now he/she offers courses and/or expensive books sharing with you the knowledge of finding some hidden cycle that sheds a light on a messy stock market mosaic. Do you believe in that?
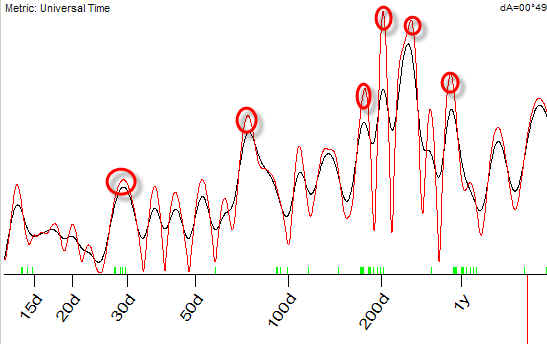
I can say only one thing: practically all statements like that one can be verified. Modern science, computer technologies and records of price history make it possible. We have more than 120 years of Dow Jones daily data. In 30s methods of the spectral analysis have been developed to answer the question above. See how the periodogram for Dow looks like (to be exact, the relative price oscillator with the period of 100 bars for Dow is used as we need to exclude a long term trend):
The peaks here correspond to the strongest cycles. As you see there is no any significant cycle with a period less than half a year. You can easily see here classical business cycles (Kitchen's 40 months and Juglar's 9-10 years cycles). If some magic cycle exists it would be definitely shown on this diagram as a high peak, this is a math fact. Whatever form this cycle is presented - a sinus waveform or as a distance between important turning points - the periodogram sees it, this is what it is invented for.
I believe in this particular case we need to go further than just finding something in the past. You need to know "where the wisdom lies: in the past or in the future"...
Cycles as the greatest trick masters
Always remember that cycles can easily explain anything - in the past. And this is a very dangerous point because you can get very impressive projection lines that do no forecast at all in reality.
Let me demonstrate how this can be done. I will take three cycles: 362, 220 and 412 days cycle. These cycles have not any concern with the stock market, these are simply the prices for most popular alcoholic beverages at the time when I was a University student (in Communist Russia we have had a small choice of drinks, though their prices have been the same for decades, so any Russian of my generation remembers these figures).
So, I have calculated the composite of these 3 cycles finding the best phase and amplitude for them (they are optimized for S&P500 index). Here it is, a red line together with S&P500:
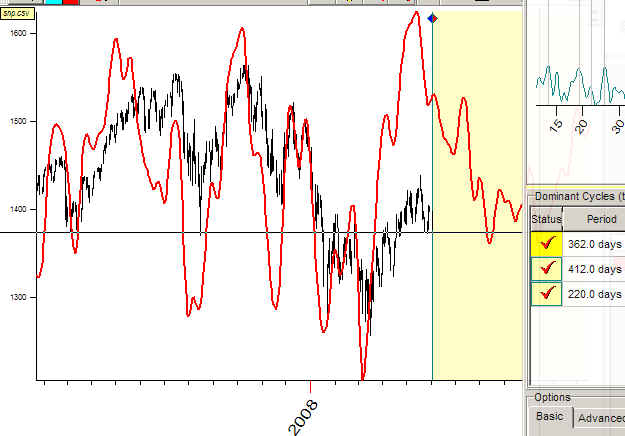
For each cycle I have considered 18 overtones.
Practically the same picture can be received for another combination of random cycles. I tried the cycles above excluding 362 days cycle because it is too close to Annual cycle; as a result, I have got practically the same projection line. What does it mean? Three random cycles are able to describe S&P500. I feel myself uncomfortable in this situation, Chaos plays tricks to us making the illusion of the reality. However Nature charges us for these illusions when we try to use future forecast based on these cycles. I believe everybody has faced the situation when some impressive model that worked perfectly in the past is spoiled immediately after crossing "NOW" point.
If you plan to work with FUTURE and are not interested in explanation of the PAST only, you have to accept the cold wind of reality. You need to understand that cycles in stock market live their own lives. And their life is very far from Ideal. Maximum Entropy Spectrum Analysis (MESA) is the first step in the direction of understanding that.
MESA - cycles in dynamics
The most common misunderstanding regarding MESA is the statement that MESA allows to calculate cycles more accurately. This is not true. MESA allows to observe how the cycles live, how they appear - grow - disappear. Usually cycles live not too long except the fundamental cycles such as Annual and business cycles. The cycle's life is similar to success of some pop music artists: after some glorious time (because their music is in tune with some public emotion) they are forgotten by general public A very similar thing happens to the cycles: the cycle appears, then it becomes a leading cycle on the market, then other cycles appear, and that leading cycle becomes a memory....We need to accept this fact no matter it is convenient for us or not. The latest most powerful cycle is called a DOMINANT cycle. Pay attention to the LATEST. This method helps us to switch our focus from searching some Magic Cycle that works forever to investigation of dominant cycles. We need to catch them as early as possible, while it is still active in the chaotic waves of the stock market ocean.
Look at this diagram from J. F. Ehler's website:
. 
This is a "heat map" calculated for S&P Continuous futures contract for the year prior to November 2005. This diagram shows how cycles "sound", as it is said on the website: "The spectrum is displayed as a heat map, running from white-hot, through red-hot, to ice cold over a 20 dB range."
Say in April-June 2005 the 20 bars cycle has been the loudest/hottest:
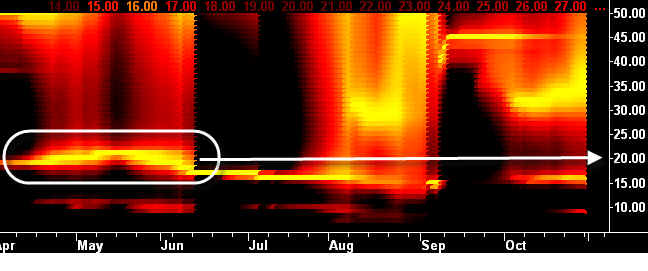
We can say that for this period 20 bars cycle is a dominant cycle. If some dominant cycle persists and it is strong enough, we say that the stock market is in this cycle mode.
For your information, this math have been developed by John Parker Burg in 1975 year. Geophysics use it a lot to reveal cycles from small arrays of data. In respect to the stock market, this approach has been developed by John F.Ehlers, see his book "MESA and Trading Market Cycles". I like these guys.
My experience shows that MESA works better if you would like to know the state of the stock market than for market forecast. It helps to understand whether the market is in some cycle's mode or it just follows the trend. It is a great tool to visualize the life of the cycles. The modern math technique that allows to do the same thing is wavelet analysis.
There are other methods of working with cycles. One of the most well known methods is Fourier transform (let us call it a classical approach). It is applied widely in physics as the physicists deal mostly with persistent cycles. Some persistent cycles are used in economy though they do not work well for stock market. MESA does it better as it is able to work with non-persistent cycles.
However, there is another way there.
Timing Solution - cycle hunting
I believe making choices between Classical and MESA techniques of cycle revealing, we do actually a choice between Ideal and Chaotic. Classical spectral analysis perfectly reveals persistent cycles like long term economical business cycles. They do exist and are accepted by all econometric schools though they are useless for trading. MESA algorithm is mostly concentrated on short term cycles, it looks for the dominant cycles. These cycles are very interesting for traders; however a breath of Chaos is too significant for these cycles - they are extremely noisy. This choice is not convenient for a trader. There is one more restriction of MESA technique: usually it sees only one dominant cycle at the time.
In Timing Solution we have developed the new technology - MULTIFRAME SPECTRUM. This technology puts the short and long term cycles at equal position (so called scalable system). As in MESA we deal with dominant cycles analyzing the most influential recent cycles. However, the technology of revealing these cycles is different. It is also possible to work with several dominant cycles at the same time (usually from one to ten, depending on the analyzed financial instrument, bar size and forecast horizon).
Actually this technology reminds me the process of hunting. We need to reveal cycles as early as possible (the life time of cycles is not long) and catch all the most influential cycles. We need to catch all big fish that come to our territory (I am writing this article on the lake shore, while all other people around me are fishing). This is how multiframe spectrum looks like:
It sees short term and long term cycles as well. As in MESA, we need to recalculate it when new price data come.
The most important parameter for multiframe spectrum is STOCK MARKET MEMORY (SM). SM defines the character life time for dominant cycle. Say if we use SM equal to 10, it means that 5 days cycle will be active for 50 days, while the 100 days cycle will live 500 days.
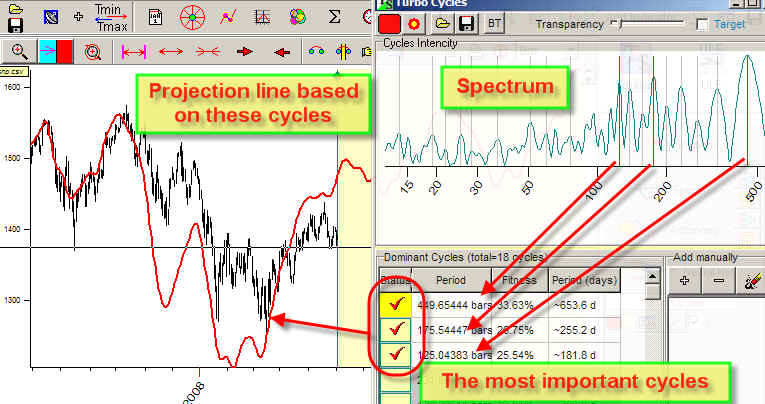
How we estimate the workability of this approach? The only important parameter is the quality of the projection line generated by these cycles. In a moment the program calculates multiframe spectrum and extracts the most significant cycles from it. Then a specialized Neural Network cooks the projection line from these cycles using past history to estimate the input of these cycles. This is how it looks on the computer screen:
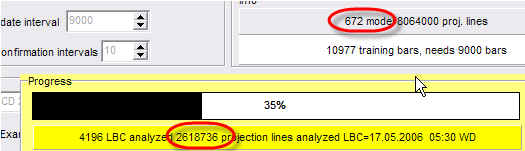
And there is more there. We constantly conduct the intensive Back Testing trying to find the optimal parameters for spectrum and Neural Net. Here is a live example: the program analyzes 2.6 millions projection lines generated by multiframe spectrum + Neural Network with different parameters; in total 672 models:
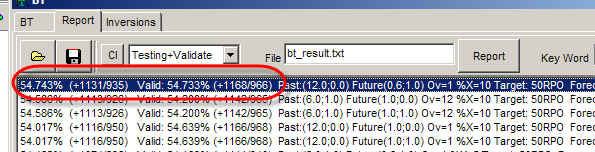
The output is the list of the most workable models:
The program performs this huge job fantastically fast (several hours only); however we have spent several years to reach this speed. There are no other choices for Back Testing, as this is extremely time consuming task.
The tested models are available as ready solutions in the program.
Thus, instead of a descriptive technique, we have in Timing Solution a technology of making a forecast.
Fast introduction into cyclic analysis
The main participant of cyclic analysis is sinus (cosine) curve, this is how it looks like:
To describe any sinus wave, you need to know: a period - the length of the cycle, an amplitude - the strength of the cycle (you can see it on the diagram as the height of the sinus curve) and a phase - the angle that defines the start of the cycle (the starting point on the diagram marked as "A").
Mathematicians know many ways to play with the cycles. They have found a way to summarize several cycles at the same time. It is called superposition (or composite) of the cycles; the result is a cycle as well. The resulting cycle may look like this one:
Here I did the summation of 183.1, 135.5 and 87.6 days cycles. It is displayed together with Dow Jones Industrial Index chart (a black line) and its 300-bar detrended oscillator. In regards to our main goal, making a forecast, superposition of the cycles is a very useful thing as normally we have many different cycles working at the same time.
Weighting: In the previous example the same weights were used for all three cycles. Imagine that you know that one of the cycles is more important than others. You can assign to that cycle double meaning (same period, same phase, double amplitude). It leads to a different appearance of the resulting curve. Thus, playing with cycle weights we can significantly improve our superposition curve.
Overtones: Suppose you touch the guitar string, and it starts vibrating. How many different sounds do you hear?
First of all, you will hear the main vibration of the string; on the picture above this is the upper vibration involving the whole string length. Besides, you will hear the vibration of the half of the string length; it is the next "octave" of the main sound. Also you will hear 1/3, 1/4 .. length vibrations. These "additions" to the main sound are called overtones. Some overtones sound loudly while others are very quiet; it is the reason why every musical instrument makes its unique sound.
Spectrogram
Try to produce different sounds in a small room. You will easily find out that some of them sound very well there, loud, you can enjoy them; while others sound very quiet, the room absorbs them. You may say that the room itself "likes" some sounds and "does not like" others. You can imagine the spectrogram as a result of "asking" some financial instrument how well a cycle fits to it.
See a sample of a spectrogram created by Timing Solution". Download any financial data and click "Spectrum" button. You will get something like this:
This is a spectrogram. The X axis on this diagram corresponds to the period of the cycle (or a frequency of the sound in the example above), while Y is a strength of this cycle (more exactly, spectrum density). If we compare this periodogram to the sounds in the small room, the highest cycles for our financial instrument are like the loudest sounds in that room.
Sergey Tarasov March - July 2008y
Toronto, Canada.