Results of the latest poll June , 2019
The poll addressed to two issues. One of them was the most used data feeds. The related information is now reviewed. Another issue was the most used techniques that Timing Solution users work with. Our goal was also to gather the information for new TS users based on the real experience with the software. You can compare these results with the previous poll conducted in December 2013 (shown at the end of this article).
| Module | Rate of usage | Link with explanation |
| Q_Spectrum | 100% | http://www.timingsolution.com/TI/16/index.htm |
| Astronomy | 52% | http://www.timingsolution.com/Doc/level_1/5.htm |
| Spectrum | 48% | http://timingsolution.com/Doc/level_1/4.htm |
| Nearal Net | 33% | http://timingsolution.com/Doc/level_1/6.htm |
| Intermarket | 32% | http://www.timingsolution.com/TI/Intermarket_2019/ |
| Precise Charting | 31% | http://www.timingsolution.com/TI/13/index.htm |
| TPA | 30% | http://www.timingsolution.com/TS/Articles/TPA_2015/ |
| ULE | 30% | http://www.timingsolution.com/Doc/level_1/9.htm |
| Seasonality | 29% | http://www.timingsolution.com/TS/Mini/94/index.htm |
| Planetary Lines | 29% | http://www.timingsolution.com/TS/Mini/64/index.htm |
| Similarity | 25% | http://www.timingsolution.com/TS/Programs/pr/ |
| Q Box | 14% | http://www.timingsolution.com/TI/18/index.htm |
| Semenko diagram | 14% |
(* - some respondents did not mentioned what kind of Spectrum they had in mind, Q-spectrum or a regular one)
The first and the most obvious result is: Q-spectrum module is the most used module in Timing Solution. This result is very important to me.
The next important results is: users are now working with two totally new modules of Terra Incognita project. These are Trading Strategy constructor and Q-Box module. In the previous poll of 2013 these modules where not mentioned at all. It is not surprising for Q-Box (it did not exist than as well as Q-Spectrum) while Trading Strategy constructor was already developed then. Intermarket module became more used within this period (though most of the users did not indicate what version of Intermarket they referred to - the old or the new one).
Walk Forward analysis does not present in this table as it is a part of Composite Expert module (same as Astronomy module). The table does not show Easy Expert, Wavelet, Easy Cycle modules. They are also in use though their portion is about 10%. Actually, if we remove Q-Spectrum from this table as it is the most used module and normalize the table in regards to Astronomy module, the percentage for all other modules will be twice higher.
In this table Gann based techniques are not present. Instead, there is Precise Charting module used by many Gann followers. If we add to that all other Gann charting tools (like Gann fans, counters, etc.) - it will be practically those 40% that were shown in a similar table 6 years ago.
Here are my comments regarding these results:
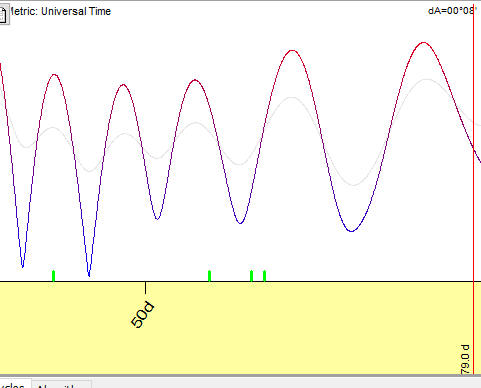
Q-Spectrum - it is highly recommended. This is a successful combination of Walk Forward Analysis (which is a standard in finance) and classical cyclical analysis. Just a random example that I have received this morning. 55 days cycle in crude oil price chart. We can even see the presence of this cycle visually (thank you Sergi for providing this chart), look at these repeating down trend periods:
Q-Spectrum shows that this cycle presents in crude oil price chart:
Classical spectrum "does not see" this cycle:
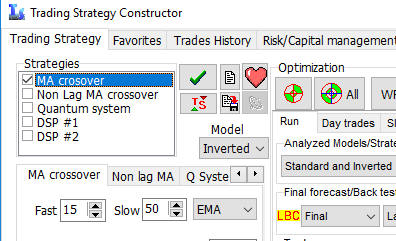
Trading Strategy Constructor - I recommend building indicators created in the module this way: http://www.timingsolution.com/TS/Mini/92/index.htm
There are many indicators there you can work with. I must say that it is better to work with indicators based on moving averages. The problem with quantum models is: they are too fast, the slippage is very small. So maybe it is better to disable them. This is an example how to optimize moving average crossover technique:
Results of poll December 2013
Timing Solution project was launched for public in the very first days of theyear 2005; i.e. it exists 9 years already. Approximately once in two years we do an inquiry asking Timing Solution users regarding the most used techniques of the software. We did four polls up today. It has been a very important thing for us as Timing Solution software provides a totally new technology for customers. Our main focus is a projection line; the majority techniques represented in the program are based on the projection line.
When we started, the idea of the projection line was not accepted easily by Technical Analysis (TA) followers. Their main argument was: "... We are not interested neither the future, nor the forecast; all we need to know is how to react to the stock market events NOW. Nobody can forecast the future...". The market of the software for traders and investors was very crowded, and we had a dilemma. We could make one more Technical Analysis software (definitely, creating new charting tools and indicators and adding a scientific flare to those that are already in common use). Or we could start something really new and exciting. From the marketing point of view, it was not an easy decision to announce the projection line and forecast as our main product. But we (me and my wife) decided to follow "My way" principle; and time that passed has shown that it was the right step: "we look for the ways to forecast the stock market, and the projection line is our main product".
Looking back at the situation nine years ago and comparing it to the current situation, we do see the difference. The difference is that now we can speak about Timing Solution technology - as a some set of techniques that customers use in their trading. I say "technology", not a toolbox of different techniques (technical analysis software tends to that...). It is already two years as I have recognized the fact that is not a problem nowadays to add some new techniques to Timing Solution; practically everything is possible now in regards to the programming/coding. The main problem now is a quality of these techniques, the value that they bring to customers. I remember my dreams about having the first hundred of the software users. Now a number of Timing Solution users is times more than that. But - they have very different trading styles, and this is a big problem for me. I tend to cover as many issues as possible when I develop a new module. But... Analyzing wishes and requests regarding new modules, I always was surprised and disappointed by a huge variety of desires regarding the techniques that my customers wanted to be incorporated in the software. (Just for your information: Wish List section on the website now needs more than 100 years of developer's job to fulfill all requests). And the polls regarding the most used techniques in Timing Solution revealed that same thing: many users worked with many different techniques. It looked like they were looking for familiar things in Timing Solution that they got used to while working with different Technical Analysis software. At least, it was so for the first 6-7 years.
Then the situation started to change, step by step. For the last two years, I began feeling that Timing Solution customers use the software more consciously. Several years ago the typical conversation between a user and me was a request to incorporate in the software some new feature, and this wish was absolutely different from the wishes of other users. If we would continue that way, the software would become the Ocean of Varieties. Now the questions from users and new additions to the Wish List show some system. It means that some technology has appeared, and this technology is approximately the same for different users. his is our "ignition point"; starting from this point we can speak about Timing Solution technology, and our Yahoo Group step by step becomes an educational community, while I can plan my activities more precisely now.
And the last and the most significant fact is the results of the latest poll regarding most used techniques. It has been conducted at the end of summer 2013. It shows that some system of using Timing Solution has appeared: some modules are used more often, while others are used not so often. I have analyzed the results of this poll around Christmas time. I did that with one purpose only - to complete all initiatives of the year, I have expected the same results as always: the variety of wishes. What I have found in reality says me that we are on a right way, the Timing Solution technology is finally formed. What a Christmas gift for me!
Now let us talk about Timing Solution technology itself.
This is the result of the last poll regarding the most used techniques in Timing Solution:
| Astronomy | 100 |
| Charting tools | 70 |
| Neural net | 50 |
| Spectrum | 40 |
| Gann | 40 |
| Turbo Cycles | 40 |
| Semenko diagram | 30 |
| Planetary Eq. Lines | 30 |
| Similarity, Intermarket | 20 |
| WFA | 20 |
| Easy Cycle | 20 |
| Easy expert | 10 |
I used 0-100% importance scale to calculate the importance of a module: 0% - less important, 100% - the most important. About 150 users have participated in this poll (though August is a very quiet time for Internet), indicating one or more modules that they use on a regular basis..
Here are comments regarding these results:
Astronomy (Composite) - no doubts, this is the most used module. One user commented it "I will not trade without using Composite model." This module deals with different astro cycles. The good part of astro cycles is that they can be calculated ahead and there is always some astro cycle at work. The hard part is how to evaluate their effect on the markets. I have spent a lot of time trying to find an appropriate procedure of verification of astro cycles. The information regarding this module is here, together with recommended parameters: http://www.timingsolution.com/Doc/level_1/5.htm
Charting Tools - here I followed in the stream of classical Technical Analysis. I would recommend to pay attention to astro based charting tools and charting tools that employ cyclical analysis (like "Fourier string" charting tool). These techniques are explained
here: http://www.timingsolution.com/TS/Study/ts_charting_tools/index.htm
Several years ago Olga Morales' classes for traders have emerged, and many users started to use precise charting more often. For these needs, I have incorporated "Super Canvas" module:
http://www.timingsolution.com/TI/12/index.htm. There we have encounter a problem: "What time flow does the stock market exist in?". I plan to add more features to this module in the future
addressing this problem.
Neural Net work (NN) module - please see the explanation here: http://www.timingsolution.com/Doc/level_1/6.htm
However, I recommend to Timing Solution users switching step by step to Events Box module instead of Neural Net: http://www.timingsolution.com/TS/Mini/62/index.htm
Initially I have developed NN with a purpose of catching non linear effects. I have applied there very complicated math as well that allows to optimize the aspects' orb (to find the best orb). Further research showed that these effects (nonlinear) are not so important. Events Box does calculations much faster plus it allows to calculate committee chart.
Spectrum, Turbo Cycles, Wavelets, Easy Cycles - these modules deal with regular math cycles looking for the traces of an ideal sinus wave in the chaotic price chart and not losing the path in the process. The problem with any cycles model is: they can explain easily everything in the past. Look at this example; here the black curve is the oscillator with the smoothing period = 50 trading days; red curve represents 323-days cycle with twelve overtones:
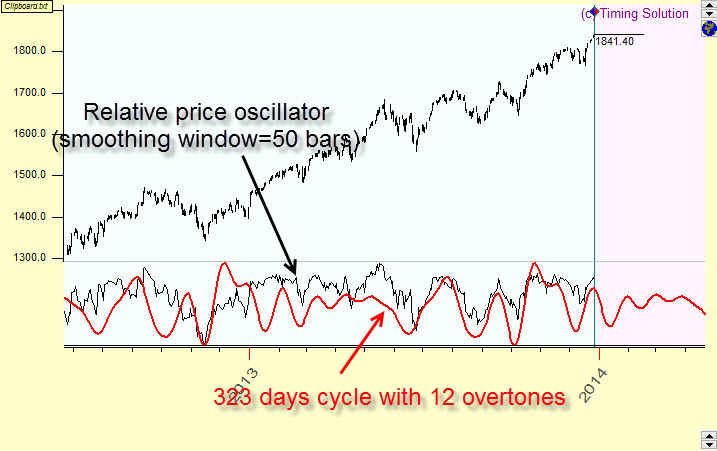
More thorough mathematical analysis of available data always provides you with a cycle or a combination of cycles that imitate well your price chart. However, be very cautious with these cycles and do not trust to nice looking pictures, this is dangerous beauty.
Gann techniques - this module includes mostly Gann fans, Gann square and planetary fan charting tools. Actually this is not my song, I can comment not much here. In regards to Gann techniques, I trust Olga Morales, she is a really good teacher and professional.
Olga's students use these charting tools a lot.
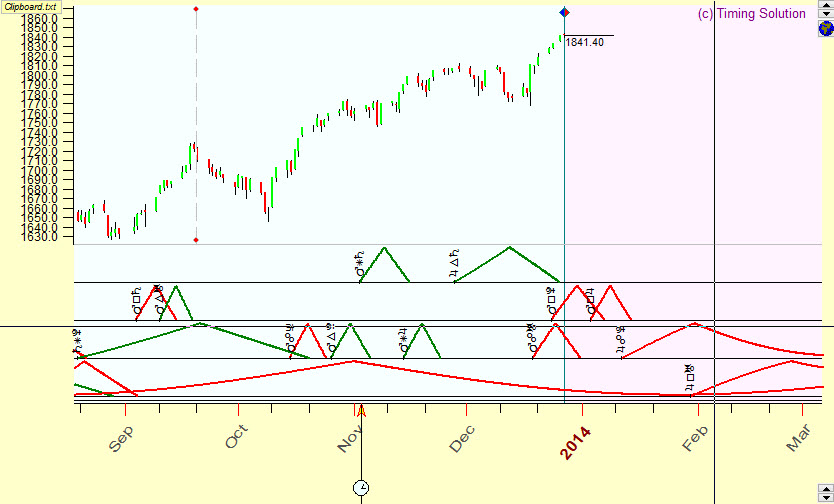
Semenko diagram - This is a good module. I have developed it for Timing Solution two ago, and many people use it for different purposes worldwide. But - it turned out that it is not documented. There is some explanation regarding this module, I did it on Yahoo Group. It is a good news for me that it is found useful by my customers; good news because the original idea belongs to my teacher in Russia, Mrs. Augustina Philippovna Semenko. She used to draw similar diagrams in 1980, may be 1970s. In brief, the diagram presents astro aspects in a special way. For any given moment, we can see all aspects that work there as well as the stage of these aspects:
Similarities, Intermarket analysis - I believe this module is under evaluated yet. I say it because the comments regarding this module are very professional ones though I believe it can give useful hints to a regular investor and trader. Special thanks to Joel Kreger for his comments.
For EOD chart I recommend to apply this filter that allows finding the most similar year:
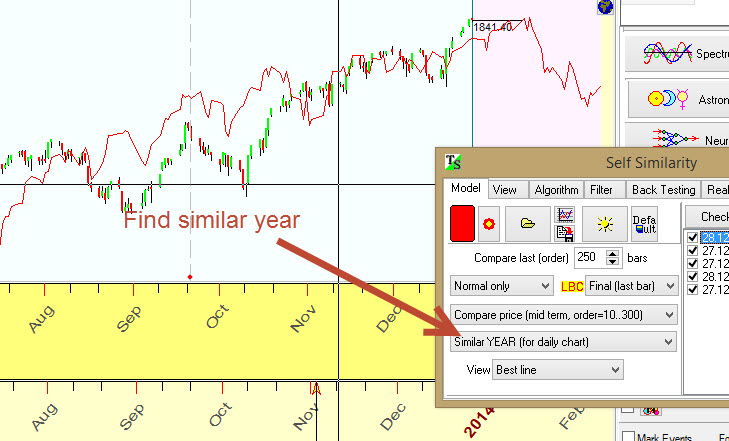
I believe at this point that we should not ignore the fundamental analysis. In other words, when you searching for the analogy in the past, you should think about fundamental/economical/political/... situation at the similar period.
December 28, 2013
Sergey Tarassov.
Toronto, Canada