TS vs TA (Timing Solution and Technical Analysis indicators)
written by Sergey Tarassov
I receive many questions regarding technical analysis indicators and their implementation in Timing Solution software. Usually I answer that some indicators are used in Timing Solution - like detrended oscillators. And I do not include many others for two reasons: one is their availability in many other software packages by other vendors. Another reason, and more important to me, is that we have different goals. My goal, and the main purpose of Timing Solution software, is: market forecast.
Here, in this article, I would like to demonstrate some results that I have got regarding technical analysis (TA) indicators. These results are expected ones, though I have got them in an unexpected way.
I asked myself a question: can we get some forecast using technical analysis indicators? Now I can say: NO, we cannot. With a high probability, TA indicators do not tell us much about future price movements. These indicators describe a current situation as it is now. As an example, RSI can indicate that some stock is overbought; and statistically it means that we are expecting some downward movement in the visible future. Is this a forecast? no, it is not; this is a statistical statement. It is the same thing, if, being here, in Canada, on February 23, I would not expect tomorrow 100 degrees of Fahrenheit weather, just because it is February. However, I can make a kind of some forecast: as in February the Sun is getting higher every day, so the temperature the next day is statistically higher than the temperature today. And this is not a forecast - this is a statistical statement based on some astronomical fact. They call it "naive forecast", and in statistics they call it "null hypothesis".
Speaking about the weather forecast, we should mention the weather stations located all over the World, information received from satellites and power computers that collect all this information together, analyze it and build the models that forecast atmospheric behavior much more precisely than my naive forecast. Forecast is when we actively work with the information, building forecasting models far beyond simple statistical statements/naive forecast.
The point of this article is: technical analysis indicators deal with naive forecast. They cannot forecast future beyond the simple statistical statements. In other words, application of TA indicators (i.e. indicators that are calculated/"cooked" from the same components: Open, High, Low, Close, sometimes adding Volume and Open Interest) can explains CURRENT or PAST stock market behavior only, never the FUTURE situation. To get closer to the future, we have to "cook" our models from more advanced components. This is why I always mention that Timing Solution is not a Technical Analysis software only. IMHO, Technical Analysis approach as it is now leads nowhere. You can read about this problem in different places, it is not just me saying that.
Let me introduce my major argument that I have got in an unexpected way.
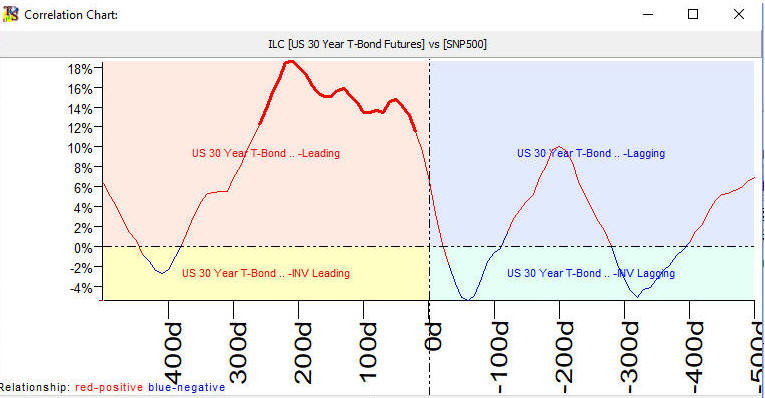
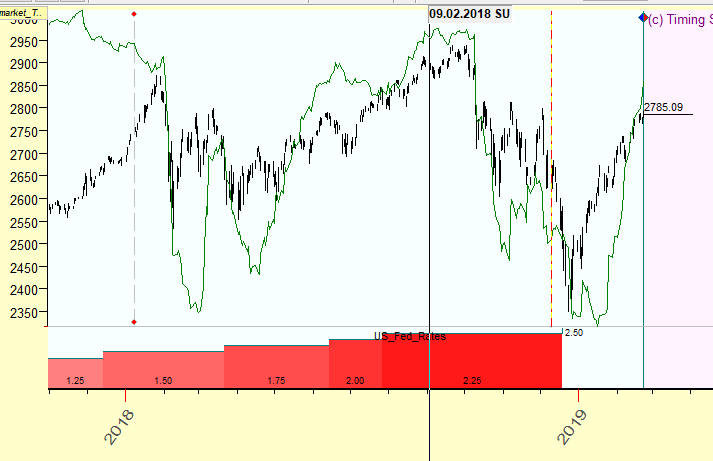
While working with Intermarket analysis module recently, the special technology has been developed, Intermarket Lag Chart (ILC). This technology is focused on finding leading financial instruments. As an example, look at this chart below. It shows that US 30 years T-bonds is a leading indicator for S&P500 with the lag 210 days:
Major peak in the LEFT part of this chart indicates the presence of a leading indicator. This is our major goal - to find the leading indicator, because it can be used to forecast future movements. Particularly this chart shows: if we shift T-Bonds chart 210 days ahead, we get a chart that correlates with S&P500 with the accuracy 18%. Pay attention, this is not a simple lagged correlation function, as we cannot apply it for trended data. More complicated algorithm is needed here. This is why it takes some time to calculate (the lagged correlation function is calculated practically instantly).
So our main goal here is to find any leading indicator, i.e. some peak (positive or negative) located in the LEFT part of the ILC chart. This technology is explained here: http://timingsolution.com/TI/Intermarket_2019/#ILC
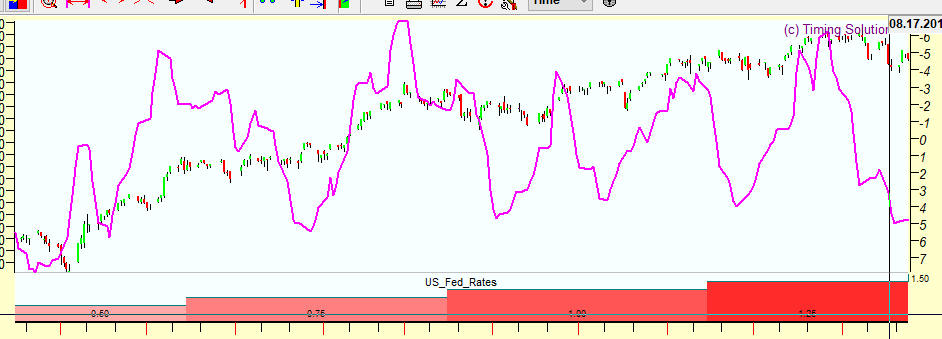
Accidentally, I have calculated ILC chart for Moving average chart for S&P500 versus S&P500 itself. This is what I have got:
WOW! This is an ideal tool to estimate the lag for the moving average. You see, we have a peak in the RIGHT side of this chart. It means that this moving average is a lagging indicator. It is not something new, we have already known this fact that moving averages always have a lag (it is how they are built). ILC chart certainly points to that: the shifted moving average correlates with S&P500 with the accuracy 90%.
Once again WOW! It means that I can easily estimate the forecasting power of any TA indicator. All I need to do is simply build ILC chart for this indicator versus S&P500 (or any other financial instrument). If this indicator is providing some clue regarding the future price movement of S&P500, we will get some peak in the LEFT part of ILC chart; the higher peak corresponds to the higher forecast ability of the indicator.
Certainty is very seldom in finance, but the result that I have got is very certain. There are no peaks in the LEFT (forecasting) part of ILC chart for TA indicators. Usually we have a big peak for zero lag (it means a high coincidence/anti-coincidence between the price and TA indicator) and some peak in the RIGHT side. It means that there is some coincidence between a TA indicator and the PAST price (price is shifted back), and no clue about the FUTURE. I have conducted a detailed analysis for major TA indicator (see Appendix below). I have got an impression that when we build TA indicators applying complicated calculations, we make some favors for the past price movements, incorporate past price movements to make the general picture more clear. But there is nothing there about the future price movement.
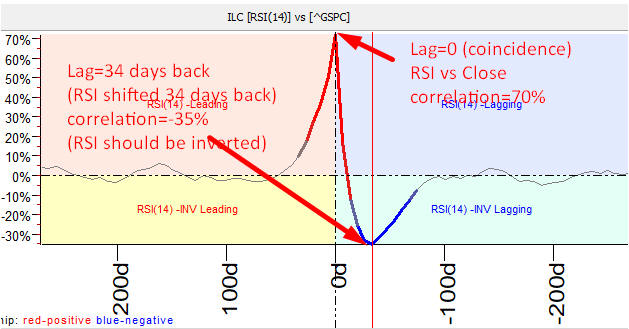
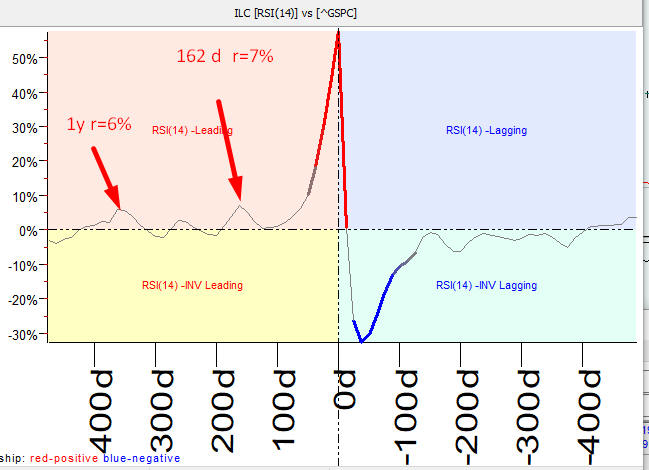
Let's me explain how it works. I have calculated ILC chart for RSI versus Close for S&P500:
The highest peak here corresponds to zero lag; the height of this peak is above 70%. It means that RSI coincides with the accuracy 70%, i.e. the average correlation between RSI and Close is about 70%. And there is a smaller peak that corresponds to 34 days lag, and the height of this lag less than 35% (negative). Mathematically it means if we shift RSI on 34 days (calendar days) back and invert it (as the peak is in the negative area), we will get a rather good correlation between RSI and Close, 35%:
Let us look at this shifted inverted RSI chart:
Thus, answering the question: "What information about the price movement does RSI bring to us?", we can say: "it reflects the current movement with the correlation 70%, and shows the correlation 35% if shifted back 34 days (this is not a mistake, the sum here should not be equal to 100%). And no connection with the future movement".
Below I put more ILC charts for major TA indicators. All these charts show the same bold fact, which can be presented in terms of the information as this formula:
Information provided by TA indicator = A1 * Current price information + A2 * Price Information %X Days Ago
We do not have any information about the future price here; this fact is confirmed by the absence of major peaks in the left part of ILC chart.
Technical Analysis indicators cannot overcome NOW point, therefore the forecast ability of Technical Analysis is restricted by naive forecast; this is 3%-5% above Chaos. To get something more, we need to apply more advanced technologies that allow to model the stock market behavior and conduct back testing of these models. This is what Timing Solution software does, and ILC charts give us clues in what direction we should go:
Let us look again at the same ILC chart above. It shows some small peaks in the forecast area: 162 days shift explains 7% of price movement, 1 year shift explains 6% (7% and 6% are correlations):
These are cycles present in S&P500 chart. You can see them calculating spectrum for S&P500 chart; here they are:
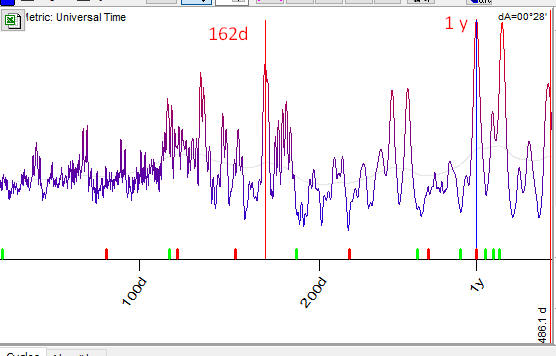
So, the findings of ILC module correspond to the results of cyclical analysis. This is another long story that took already a quarter of century of my life.
There is one more conclusion that I made several years ago: "Do not use complicated indicators; if possible, use Close itself". This research confirms that the conclusion is correct. As an example, consider cyclical analysis; there we prefer to use relative price oscillator. However, if the trend is not strong, we can use Close as a target in cyclical analysis. The latest cyclical model "Trading Spectrum" does not use TA indicators at all, it works with the price itself, and only with the price: http://www.timingsolution.com/TS/Articles/Trading_Spectrum/index.htm
Building complicated indicators, we pay inevitable price: we incorporate past price history, incorporate past patterns, - and these are useless in terms of the future.
Appendix:
Here are ILC charts for different TA indicators:
RPO(1,15,15) versus Close; here you see that the normal indicator correlates 30% with zero lag, versus 20% for inverted:
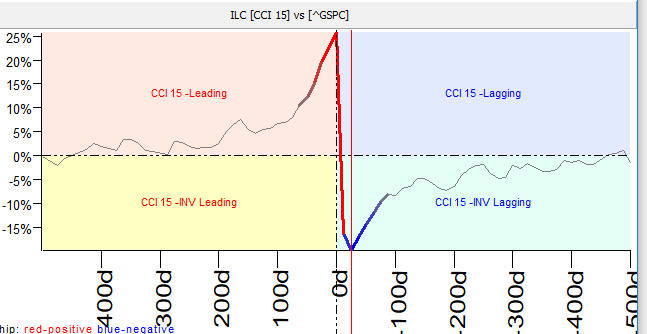
Commodity Channel Index versus Close:
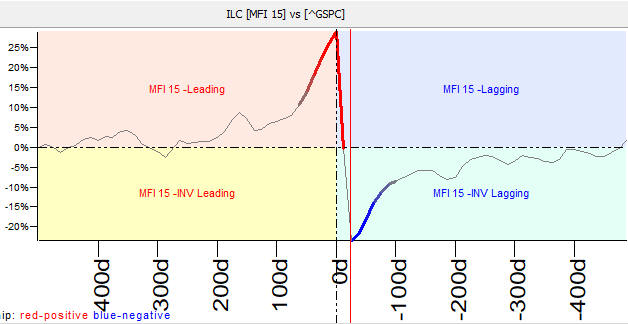
Money Flow Index versus Close:
Historical Volatility versus Close
Major negative peak with lag=0 tells us that inverted volatility explains the price with the accuracy 37%. Here is the inverted volatility together with S&P500:
Another peak says that 100 days lagged volatility (non inverted) describes S&P500 movement with the accuracy 12%:
MACD versus Close
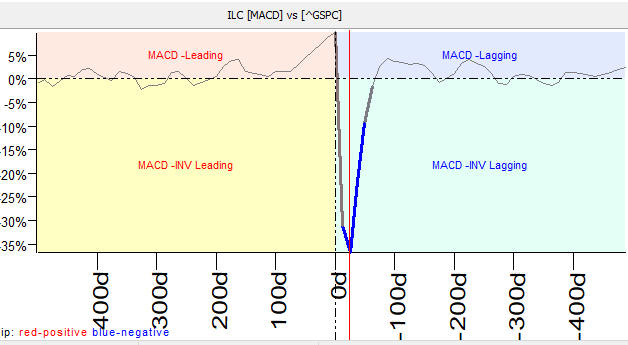
Inverted MACD with lag=25 days coincides with the price with the accuracy 37%:
ADX versus S&P500:
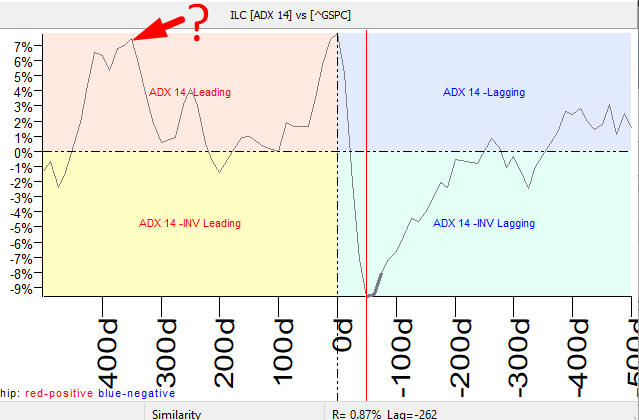
And here I have found something unusual: almost 8% peak in the forecasting area. It was an enigma for me. Maybe, ADX really is able to forecast the future, being a leading indicator?
Finally, looking at the lag value, I have recognized that this peak corresponds to Annual cycle.
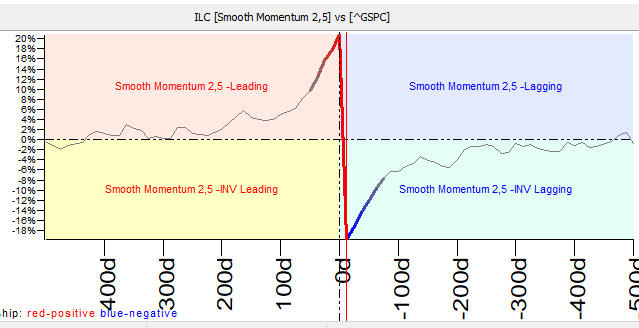
Smooth momentum versus S&P500:
Detrended Zigzag versus S&P500
February 26, 2019
Toronto, Canada