Planetary Time Metrics - introduction to the theme
� Sergey Tarassov
In this small article, I would like to introduce an absolutely new technology that allows to improve the forecasting abilities of our models significantly. We (my friends and I) have begun our first numerical experiments with this technique almost two years ago. At that time we considered this technique as a totally experimental one. During the following years, we continued experiments and created a software that can deal with it. Now we are ready to demonstrate this approach to the public. For me personally, the most exciting fact is that this approach opens our eyes to a new kind of phenomena: it looks like the stock market follows not the ordinary time that we all used to deal with and can measure by different kinds of clocks, but rather with the special kind of time; this kind of time is very related to the planetary movements around the Sun (at least, the Earth movement). This is a statistically approved fact (see the table of results below). I would like to say that the moving planets generate a kind of their own time flows, and we can think of that time and apply it using standard technique procedures, i.e. we can calculate the Spectrum in our usual way to reveal cyclic phenomena persisting in that particular time, and then create the forecast model based on that time. Also, there are already some physical experiments that provide a legitimate base for this approach (I will write more about these scientific experiments in another article). This technology presents in Timing Solution software only, and all rights regarding this approach belong to Sergey Tarassov.
To be brief, this technology deals with another kind of Time. Time is one of the most fundamental characteristics of our World. Usually, describing any process, we assume that this process has some longevity in time. We can measure the time - using atomic clocks (as we do now) or the Earth's rotation (as we did 100 years ago) or observing astronomical phenomena (as our predecessors did many years ago). In any case, measuring the time, we link it to some physical process that looks constant and even. Then we divide it onto smaller parts (years, hours, minutes and seconds, etc.) - to be able to apply these parts to other processes, to measure them and get a kind of a control over our world. Thus, for our Universe, we use our Universal time. And this universal time (as we know it) is based on the rotation of the Earth (what else could you expect from the earthlings?).
Skipping all intermediate thoughts (that is the issue of the next article), we have found that the usage of a special kind of time measure (based on other planets positions) provides the better projection line than the projection line obtained using the Universal time. This fact is statistically verified, see details below.
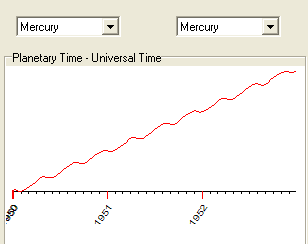
Technically, it means that we are considering the phenomena not in Universal time, but in Planetary Time. (By the way, the Planetary Time differs from local time for different planets, it is a totally different thing). In other words, the hands of the clocks designed for the Planetary Time are moving in respect to the planetary position. The most appealing feature of Planetary Time is that it is not even in respect to the Universal Time. As an example, consider the Mercury Time; it looks like this:
Sometimes this time is flowing in opposite direction. In other words, sometimes, for one point of planetary time, we have several corresponding points of universal time. There is nothing unusual in it, we simply need to change the way how we used to look at Time. It is like watching the football game and using different clocks - yours, your friend's, the watches of the gentleman in the first row, etc. How do we know which one says the "right" time? Because the "right" one is exactly like on that big clock on the wall? Or because you like your watches more? We used to live in the Universal Time, but it is just a matter of opinion. Try to consider this Planetary Time as a true time for some specific process. Then you can calculate the spectrum diagram based on this time and reveal cyclic phenomena happening in that time.
The first time when I calculated the spectrum diagram based on Planetary Time the first impression was that: this spectrum looks better. The peaks corresponding to different cyclic processes in Planetary Time look better in comparison to the same spectrum diagram in Universal time. You can trust me with this: I look at these spectrum diagrams hundreds times a day, and my eye is trained to see such a difference immediately. But to be sure that this is not an artifact/dream/fantasy, I had to conduct the statistical research. It took me one year to find appropriate math/software decisions to verify this fact.
In other words, the planets define their own kind of Time. We did not use it before - only because for all our earthly things the Universal Time was enough. But, at least, the Planetary Time is very suitable for making forecasts, and some cyclic process may be considered in this Time. This is the reason why these cycles might look irregular in the Universal time though they are regular in Planetary Time. In other words, speaking poetically, the Planetary Time is habitable, at least some regular cycles live there and we can use it for creating a projection line.
Timing Solution software provides a possibility to calculate the spectrum diagram using different time-kind metrics. You can describe your process using different time parameters:
In other words, if we do believe that price changes for some security have a cyclic nature, we can reveal different cycles for the same set of data using different time coordinates. And we can get a better projection line.
In the table below you will see the results of some experiments. You can do it yourself following these steps:
1) Download the price data for different financial instruments;
2) Divide this price history on two independent intervals - the training interval and the testing interval;
3) Calculate the spectrum for different metrics using price points from the training interval;
4) Extract the most significant regular cycles (in different time metrics) from the spectrum diagram;
5) Train Neural Network on the training interval. As inputs, use the regular cycles (in different time metrics); as the output, use the detrended price oscillator with the period of 25 price bars;
6) Calculate the Neural Network projection line and calculate the correlation between the projected line and the oscillator on the testing interval. The "future leaks" are excluded here because we keep the training and testing intervals independent.
This is the table of results; it shows the correlation between the price and the projection line based on different time models (cycles extracted from Spectrum based on Universal Time and Planetary Times):
| Regular Time Metrics | Irregular Time Metrics | ||||
|
Instrument |
model based on cycles calculated for |
model based on cycles calculated for |
model based on cycles calculated for |
model based on cycles calculated for |
model based on cycles calculated for |
|
Dow Jones from 1950 to Sep. 2005. |
r= 0.088 |
r= 0.233 ! |
r= 0.097 |
r= 0.064 |
r= -0.072 |
|
S&P 500 from 1955 to Sep. 2005 |
r= -0.042 |
r= 0.169 ! |
r= 0.068 |
r= 0.033 |
r= 0.002 |
|
NASDAQ from 1985 to Sep. 2005 |
r= 0.095! |
r= 0.094! |
r= 0.035 |
r= 0.010 |
*** |
|
EURO/USD index from 1991 to Sep. 2005 * |
r= -0.155 |
r= 0.108 |
r= 0.226 ! |
r= -0.154 |
*** |
* Before 1998, EURO/USD was interpolated as Dollar index.
The table definitely shows that the models based on Planetary Time provide better results than the usual models based on cycles in Universal Time. In any 3 of 4 cases, the model based on Planetary Time provides better results than the model based on Universal Time.
But the most reliable statistical approve for the usage of the Planetary Time was received when I did the analysis of Sun spot activity (Wolf index). I used the data from 1848 year to 2003 year (here is the source: http://sidc.oma.be/html/sunspot.htm); in total, it gives 60,000 points!!! Using the data from 1848 to 1979 (my training interval), I have created a forecast model. The other part of data, from 1979 to 2003, served as the testing interval, with 7,600 points; I used it to verify the projection line, i.e. to calculate the correlation between the projected and normalized Wolf index. Then I extracted the most significant cycles using different Times: Universal Time and Jupiter heliocentric Planetary Time. The difference between these two time metrics is caused by the ellipticity of Jupiter's trajectory.
The model based on Universal Time provides the projection line that correlates with the index 0%�1%, while the projection line based on Jupiter Time provides the correlation of 5%�2%. The big amount of testing points (7,600) confirms the statistical approval of this approach with a very high probability.
PS. Timing Solution users can see the technical details here: http://www.timingsolution.com/TS/Study/Spectrum/index.htm#A8
� Sergey Tarassov
September 30-October 15, 2005
Toronto, Canada