Next day forecast - anti-trend forecast systems
Recently one of Timing Solution users asked me a question:
What is the best way to answer the question : "Will tomorrow be an up
day or a down day?"
I realize that if projection line that's been following price, slopes upward,
it's implying up. But, is there a more specific way, taylored to the specific
up/down question?
I have decided that this small class will be my answer to this
question.
I prefer to be honest from the very beginning - I have no final answer to this question yet, though I can share with you some recommendations regarding this issue. This subject is very important to me as I have conducted, together with my friend, backtesting of many models/parameters trying to find the model that is able to forecast the next day price movement (or the next price bar - for intraday). The biggest temptation here is that this task is very clear from mathematician's point of view. If we only could find a way to define the next day price movement, it would open the door to dearest dreams of any trader/investor...
If we treat it as a mathematical problem, it has already a very effective and elegant solution -auto regression (AR).
Autoregression idea is quite simple: price today is considered as a linear combination of prices for previous days. As an example:
Close today = 1.2 x Close yesterday - 0.3 x Close 2 days ago + 0.1 x Close 3 days ago
In other words, close today is calculated as a weighted linear combination of the prices for the last 3 days. The number of days used in the auto regression formula is called auto regression order; in our example this order=3. Please do not use this formula, this is just an example. The order might be higher; it means that the formula can take as many previous days as we want. And do not forget the weights for each day. So, you see, the Holy Grail for all traders is practically here - we need just to find out the auto regression order (or how many days/price bars should be taken into account) and weights for all parts of the formula. However, the reality has prepared some surprises for us.
As you know, Timing Solution has a very powerful Neural Network that allows to model practically all variations of AR model (linear and non linear as well; non-linear regression models are using Fuzzy logic technology). We have created these models and backtested them in hope to find this Holy Grail. Instead, we have found something totally different.
Backtesting is a very tiresome and time consuming process. Several computers worked days and nights for several months trying to find a forecasting model that is able to tell the next day price movement. The program did a forecast of the next day price movement; then we compared it to a real situation and marked a number of correct forecasts against the wrong ones. Usually we have had 50-50 as a result. It means that the program has shown the correct next day movement as many times as it has provided the incorrect forecast. Thus, a forecasting ability of the system is zero. 50% of correct forecasts, this is sad...
If we would be able to forecast the next day movement with 60% probability, during last 3 years (beginning 2006 - beginning 2009) we would increase our capital four times!!! And remember - we would make this money during a terrible downtrend period of the years 2007-2009. Within 9 years, our capital would increase 47 times. Add money savings etc. - and we will look for our yacht and early retirement. If the accuracy of this system would be 62%, within 9 years the increase of our capital would be 100 times! You can continue yourselves.
My point here is that every % of forecast accuracy brings a lot of money. However, the most common result of backtesting for different auto regression models was 50%. It was discouraging.
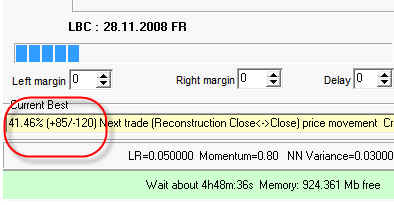
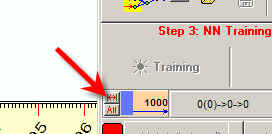
Except this:
This is a screenshot of some real backtesting process. The program pointed a correct next day movement 85 times while 120 times it was wrong. In other words, the program tends to point at the opposite movement.
We observed this "Inverse" phenomenon very often. In the beginning we ignored these anti-trend models as a game of Chaos, however detailed analysis revealed that this was not occasional. It is interesting that this effect appears only when we try to forecast the very next day (bar). And when we try to forecast the price movement several days ahead, this phenomenon disappears.
Therefore, remember:
When you create the auto regression model that forecasts next day (bar) it tends to point the opposite movement.
In terms of Chaos theory, we deal here with the antipersistent process - the next day (bar) price movement tends to reject the trend revealed by Neural Net. But when we forecast several bars ahead, this process becomes a persistent one - the real price movement tends to follow the trend revealed by Neural Net. There are some things there that I still do not understand - why R/S (which reveals persistent/antipersistent processes) analysis and backtesting show different results, but this is another story ...
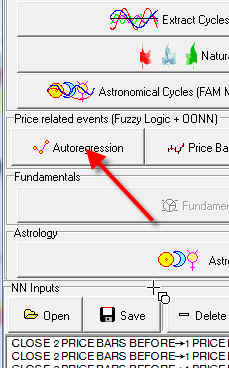
Here are some practical recommendations:
To create autoregression (AR) model, click this button in Neural Network module:
Fill out the form this way:
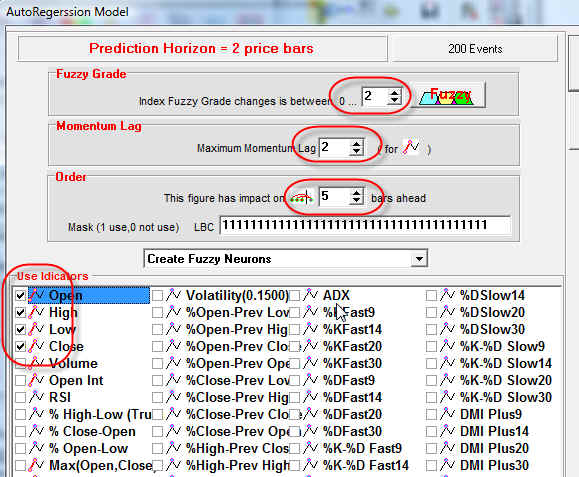
You can vary this: ![]() ;
it
is autoregression "order" parameter.
;
it
is autoregression "order" parameter.
Also you can vary training interval. It is here:
As a result you get the projection line that goes for several days after LBC. If you are more interested in the next bar forecast, do not forget to inverse the projection line pushing "I" button:
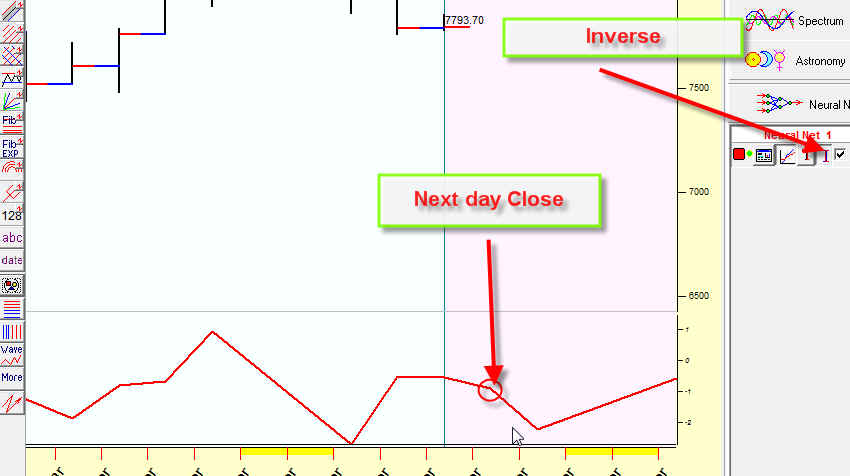
There is one small detail there: to obtain a forecast for today, you need to compare values shown by the projection line for today and for yesterday. In other words, the slope of the inverted projection line shows the direction of the movement. We can apply this approach because the value of (Close today - Open today) is very close to the value of (Close today - Close yesterday).
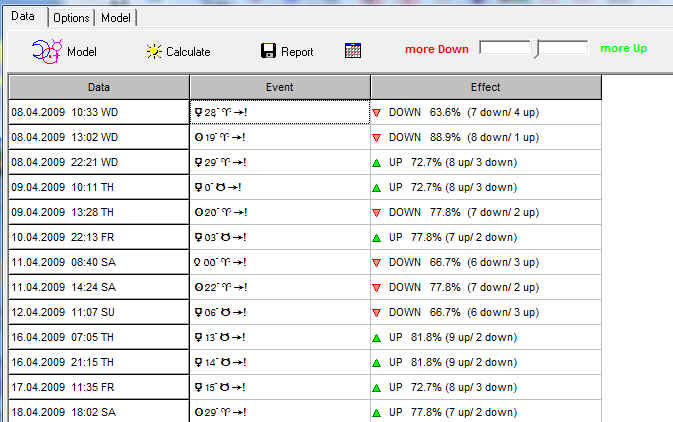
Another technique that can be used to identify Up or Down day is "Upcoming Events" module; it shows the astrological weather of the day: