This technique is an extension of a standard Technical Analysis approach. To compress the huge upcoming financial information, they use a price bar that represents the summary information for a chosen time interval. To work with the original price information (price ticks), we need to use very powerful computers. As an example I have created a file with all ticks for S&P500 Mini futures (symbol ES) for the whole year 2008; the size of this file is 1.800.000.000 bytes, not less than 50.000.000 ticks within one year.
This is a small piece of that sample data file:
TICKER,DATE,TIME,PRICE
ESH08,01/02/2008,08:30:00,1476
ESH08,01/02/2008,08:30:00,1476
ESH08,01/02/2008,08:30:00,1476
ESH08,01/02/2008,08:30:00,1475.75
ESH08,01/02/2008,08:30:00,1475.75
ESH08,01/02/2008,08:30:00,1476
ESH08,01/02/2008,08:30:00,1476
ESH08,01/02/2008,08:30:00,1476
ESH08,01/02/2008,08:30:00,1476
ESH08,01/02/2008,08:30:00,1475.75
ESH08,01/02/2008,08:30:00,1476
ESH08,01/02/2008,08:30:00,1476
ESH08,01/02/2008,08:30:00,1476
ESH08,01/02/2008,08:30:00,1476
ESH08,01/02/2008,08:30:00,1476
ESH08,01/02/2008,08:30:00,1476
ESH08,01/02/2008,08:30:00,1476
ESH08,01/02/2008,08:30:00,1476.25
ESH08,01/02/2008,08:30:00,1476
ESH08,01/02/2008,08:30:00,1476
ESH08,01/02/2008,08:30:00,1476
ESH08,01/02/2008,08:30:00,1475.75
ESH08,01/02/2008,08:30:00,1475.75
ESH08,01/02/2008,08:30:00,1476.25
ESH08,01/02/2008,08:30:00,1476.25
Within one second, the price changes several times, and it is practically impossible to control this information visually.
So, to view the summary information within a day, we use daily bar chart, within one hour - hourly bar chart, within one minute - minute bar chart. The question is what interval should be used to compose a price bar. The most common approach is to use standard intervals - one day, one hour, 15 minutes etc.
In Timing Solution we introduce a new approach: we compose a price bar using astrological criteria. For example, below the price chart for the Moon phase cycle is shown. The program calculates OHLC (open, high, low, close) for the time interval between two New Moons:
In other words, the program calculates how the price changes between two New Moons; we can see the highest and the lowest price within this Moon cycle and also the price at the beginning and the end of this cycle.
We can add one more price chart - the Moon quarters price chart:
Look how these bars are aligned within the Sun-Moon quarters:
The same way we can calculate the price bar for the Sun position in Zodiac:
or, for the long term forecast, we can calculate "Jupiter in signs of Zodiac" bars:
or Jupiter in each degree of Zodiac:
As you see the bars here have a different length: some of them cover 2-3 days, others are almost a month. This effect is caused by the retrograde motion.
For intraday data, try price bars based on the Moon position in each degree of Zodiac (it forms approximately 2 hour bars):
Also we can calculate more advanced astro based bars, like this one:
This is a bar chart based on the Sun position; we have calculated the Sun movement between two turning points A and B (60 degrees of the Sun's movement) and use this 60 degrees step to calculate other bars.
Exactly the same way we can calculate classical monthly and weekly bars:
All these things are possible with Timing Solution now.
How it works
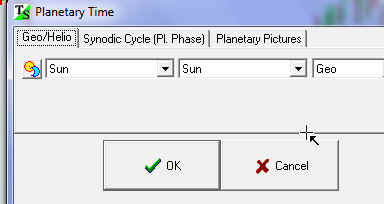
Let's start with the price bars based on the Sun movement. After downloading the price history, follow this:
choose the Sun position (Sun-Sun means here the Sun position):
and drag the mouse cursor connecting some two important turning points:
The program displays all information regarding this bar: "initial position" - the Sun's position at the point A and "Step" - the length of the Sun movement in degrees from the point A to the point B.
These parameters can be defined among Charting tools options:
For example if you want to calculate price bars based on 45 degrees of the Sun movement with the initial Sun's position at 0 degrees of Aries, set these parameters there:
 .
.