Planets movement in Price-Time Universe
2D Time-Price planetary distance technology
�Sergey Tarassov, 2009
What it is about
Let's consider a very popular astro-trade technique which is known as stepping (in Timing Solution it is "Planetary equidistant lines" charting tool). See the example below. Here I analyze the angle between the Earth and Venus heliocentric; the diagram shows the moments when this angle changes on 45 degrees. The starting point is October 9, 2009 - one of the strongest drops of the current Crisis:
This technique is used a lot to identify turning points. The restriction of this approach is: it deals with timing only. In other words, it shows the time and does not provide any information regarding price levels.
In this article we introduce the new experimental technology that allows to extend this technique onto another dimension, i.e. it shows not the time only but also the price. This is how Venus-Earth heliocentric two dimensional steps look:
We can compare these ellipses with the circles on the water; the distance between these circles is 45 degrees. These circles exist in time-price Universe, and the distance in this Universe is measured as the arc of some planetary movement.
These are not simple ellipses that you can draw with the most of charting programs. These ellipses incorporate the information about planetary movements, and it is why they differ from pure math ellipses - they are irregular.
See how these cycles look for Mars-Earth heliocentric angle:
 s
s
or Mars-Jupiter geocentric angle:
Non regular planetary movement makes these figures very funny, and this irregularity makes these line very interesting for financial analysis as well.
In this Time-Price Universe the distance between the points A and B is the same as the distance between the points A and C, and it is equal to 180 degrees of Mars-Jupiter geo angle change:
The metric of this Time-Price Universe is defined by astronomical factors, they define the topology of this Universe.
What is the benefit of this approach? We can analyze classical astrological aspects in Time-Price coordinates.
Let me show you one example. The analysis reveals that the distance between two turning points A and B is practically the same as the distance between turning points A and C:
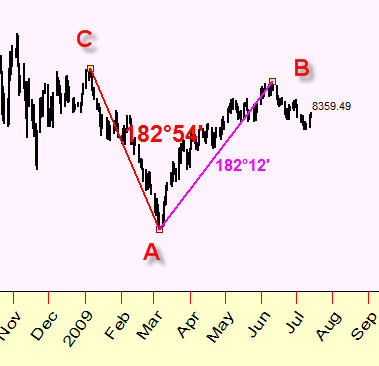
This distance is close to opposition. We use here the Earth-Jupiter Heliocentric planetary combination and scale between the price and angle changes is $1=15 degrees. I.e. these turning points are tied to the same Earth-Jupiter aspect.
Below you can see equidistant lines that show the places on the price chart where the angle between the Earth and Jupiter Heliocentric reaches 60, 120, 180 and 240 degrees in Time-Price Universe:
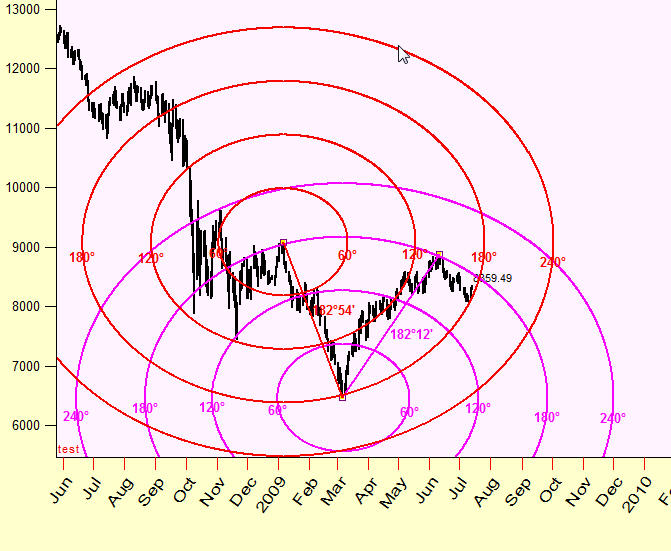
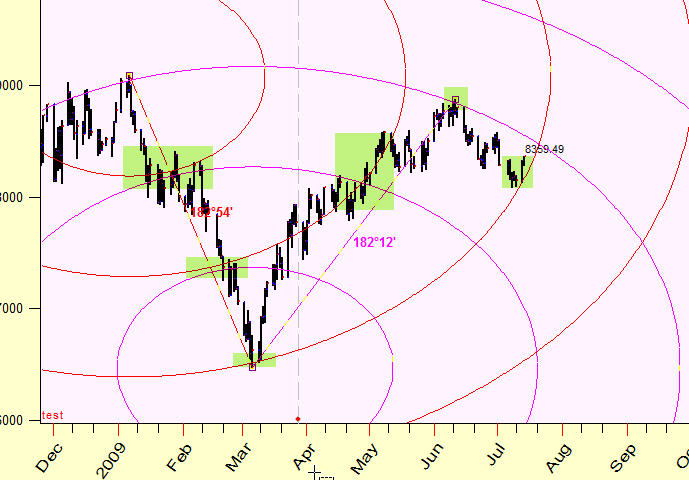
Looks like these cycles form "attraction zones"; this is a kind of support/resistance zones but these zones work in two dimensional Time-Price chart:
How it works
Let say that we would like to calculate the distance between two major turning points in the beginning of March and in the beginning of June, 2009:
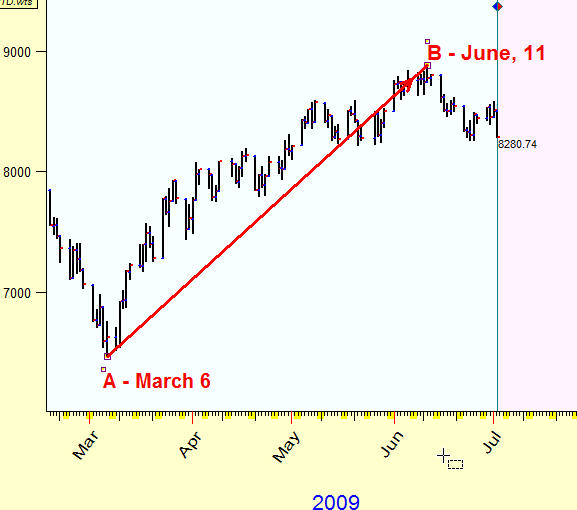
We know that since the beginning of March, within 100 calendar days, Dow Jones index gained more than 2400 points:
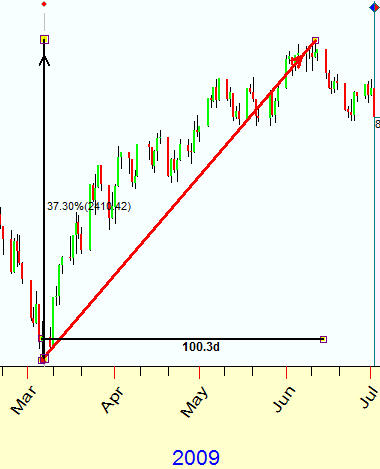
We know the distance between these two points in Time (100 days) and in Price ($2400) coordinates separately, and we need to find some way to measure the length of the vector that connects these two turning points.
Mathematically speaking we deal here with 2-dimensional space (2D space). To operate with this space we need performing two following operations:
1) Scaling - we need to find some coefficient between the price and the time. I see it as a cost of one quantum of time (like one day costs $10); this procedure allows to convert price coordinates into time coordinates and to calculate the distance between those two points.
2) Finding the unit of measure - define the unit used to calculate this distance; think about it as a ruler in this 2D price-time space.
The formal mathematical analysis proposes these possible solutions:
a) Day-Price model. First step is to convert the price into time using some scaling coefficient - cost of each day. Suppose this scaling coefficient is 10; it means that $2400 price change corresponds to 240 days interval. It means also that we can calculate the length of this vector applying Pythagorean theorem. This distance is measured in amount of DAYS. I.e. a day is a unit of measure for this approach.
b) Bar-Price model. We do the same as in the example above; the only difference is that the scaling coefficient defines the price of each bar. Now the distance is measured in amount of BARS.
c) Astro distance model. I think this method deals the price-time space the best way. We use the planetary positions as an intermediate agent between the price and the time.
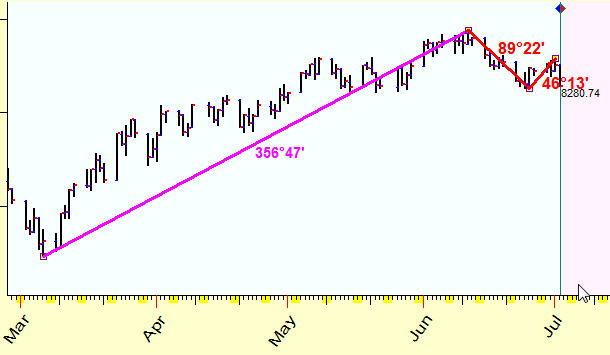
The general idea is very simple. We calculate the Sun's (or any other planet) movement for this period. In our example the Sun has passed through 94.44 degrees within this period (we look for the distance between two analyzed turning points, A (March 6, 2009) and B (June 11,2009)). Then we need to convert the price into some angle. Let use the scale 1 degree=$7 (I will explain later why such a scale is used), thus we have $2408 / 7= 344 degrees.
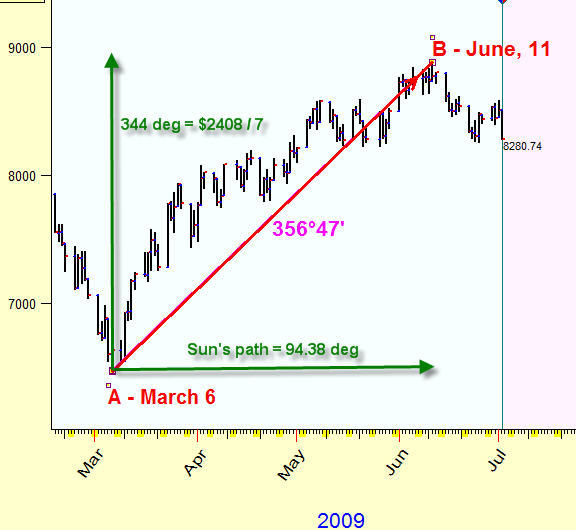
Now we calculate the distance between these points in degrees 356.47 degrees - we receive almost a full cycle, without three degrees. This is kind of the whole time-price year that is completed within 100 calendar days in time-price continuum. Using this approach, we define the price of each degree of the Sun's movement, the unit of measure is one degree of the arc.
What is the benefit of this approach? I think the main advantage is the usage of some cyclic measure - whole cycle, half of cycle, quarter of cycle etc.
Let's calculate in the same manner the asto distance between the turning point B (June 11, 2009) and the next turning point C (June 25, 29):
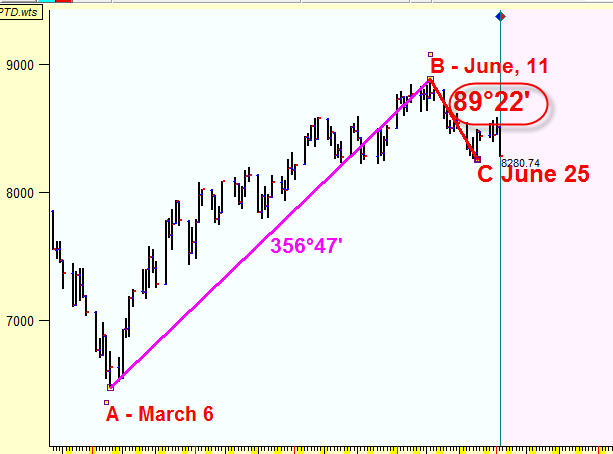
This distance is 89.22 degrees; it is very close to a quarter of a full cycle (90 degrees).
Next possible turning point, D (July 1, 2009), is separated by 46.13 degrees from the previous turning point, C (June, 25), one eighth part of the whole cycle:
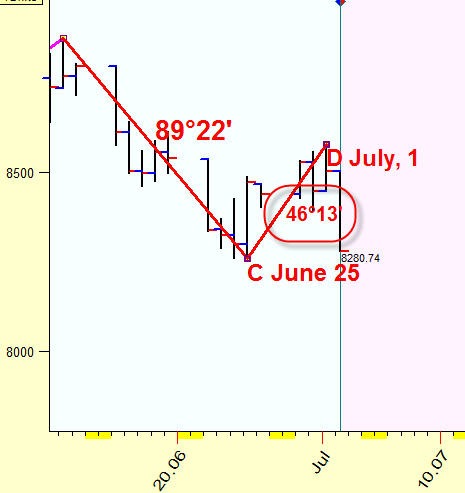
Thus we get the descending wave of 360, 90 and 45 degrees that exists in time-price space; this is how it looks:
Remember that this 360-90-45 degrees wave exists in two dimensional price-time space only; we cannot observe these proportions neither in price nor in time coordinates separately. It appears in time-price space, and the planetary position plays the role of some ruler that is used to measure the distance between two points in this space (you can use any planetary combination and any Zodiac as well).
How to do it
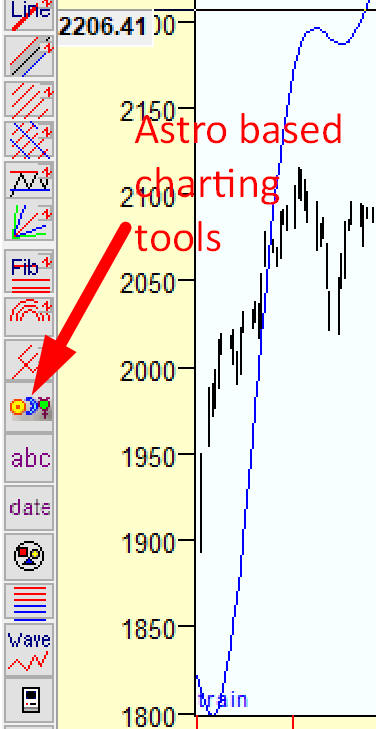
Technically you can easily draw these distance lines. Click on "Astro based charting tools" button on the charting tools panel:
and in popup menu highlight this item:
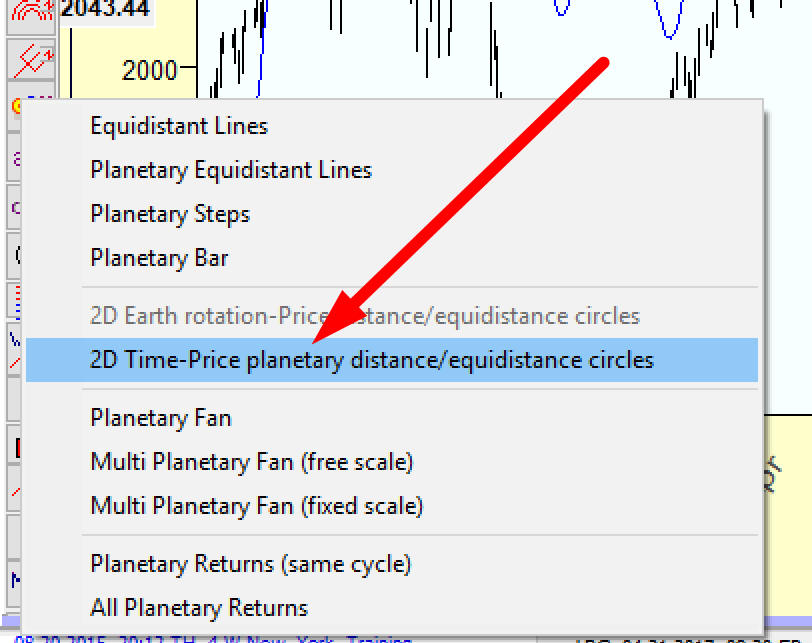
Using "2D Time-Price planetary distance/equidistance cycles" charting tool, you may apply any planet longitude to calculate the distance together with any price-time scale:
The most important question here is finding the appropriate scaling coefficient and the best planetary combination. The possible way to find these parameters is:
1) Connect two important turning points (in the example below, these are turning points A and B);
2) Vary planetary combinations and scale and watch how the 2D planetary distance changes. Pay attention to the angle separation which is close to some natural cycles (360, 720, 1080 or 180, 120 ,90 etc). Combination Sun-Sun means the Sun's position.
3) Save these parameters as default (clicking "Default" button) and then apply this astro distance charting tool to draw a connection between other turning points.
Let's say using 24H Jupiter-Earth heliocentric angle we have found the distance between A and B points 121.32 degrees - trine aspect:
Equidistant cycles
If we know how to calculate the distance between two points, we can draw a cycle in this Universe as a set of equidistant points. Back to previous example, we can draw the cycle with radius of 121.32 degrees and the center at point A. Do it this way:
Together with this cycle, we can draw half radius cycle (60.46 degrees=121.32 degrees):
or double cycle (243.04 degrees = 2 x 121.32 degrees):
There is another possibility here: you can display the cycles with some fixed radius, like the cycles with radius 30, 60, 120,150, 180 degrees. To display these cycles set these options:
Remember: when you set 50%, 100%, 200%, the program will vary the radius if you change the position of point B; while if the setting is 60, 120, 180, 240, you will get the cycles with fixed radius.
Also, when displaying the cycles with fixed radius, it is better to use "2D Price-Time equidistant cycles" charting tool, it is in "Astro based charting tools":
 *
*
The 2D Time-Price planetary distance charting tools are also available in this section.
Below you can see examples of equidistant cycles:
Mercury geo
Venus-Mars geo
Mercury heliocentric
July, 2009
Sergey Tarassov
Toronto, Ontario