Stock Market Time-Space Universe
Introduction
Here I would like to discuss a question: "In what time do we exist and in what time and space does the stock market exists?". Why is this question so important for us? It is similar to asking a scientist who prepares a spaceship flight to Jupiter why it is so important for him to know the exact distance between the Earth and Jupiter. The construction of this spaceship, the fuel tanks capacity are tied to this distance.
Let us look at how how this fundamental problem is applied to the stock market.
Here is the portrait of Great Financial crisis of the years 2007-2009 (I hope so):
We are interested in studying two turning points: A: TOP on October 11, 2007 and B: BOTTOM on March 7, 2009. The whole drama has been culminated between these two points.
We measure the distance between these major turning points using different approaches and display equidistant lines based on the measured distance.
The first example is based on the most popular time measure (which is measuring the time in days). This is the time used by physicists; it is provided by the modern technology with the help of a very precise equipment (the cesium atomic clock):
Common sense gives us a hint here that these equidistant lines show us some important moments in the past/future.
Here is another variant of equidistant lines based on trading days instead of calendar days (usually there are five trading days in a week). This time measure is more common for traders
:
Calendar and trading days are not all available time measures.
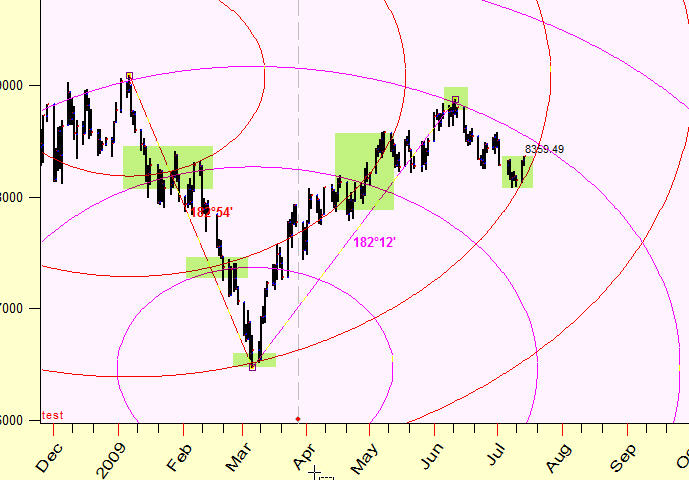
The picture below represents a totally different time measure. We can calculate that same distance between those two turning points using the angle separation between Mars and Jupiter in Heliocentric coordinates. Within these 17 dramatic months, the angle between Mars and Jupiter has changed on 210 degrees; thus we prolong these lines finding the moments when this angle is increased/decreased on 210, 420, 630 ... degrees. We do not do something special here, we simply measure the time using this angle:
I hope you understand now why the way of measuring the distance between two turning points is so important. Compared to the calendar time (that has not give us any clue a year or two years earlier in regards to the current crisis), the last example sends us back to the years 2000-2002 when very important events have occurred in the stock market. We may assume that this time measure reflects some reality, and this specific kind of time understanding fits better to the process of market forecast. However, we do not know what time representation is more appropriate for humans' everyday activity and the stock market - the time that is used be physicists to describe the movement of stars and atoms or the time described by planetary phases. This is "Magnum Ignitum" (great unknown), a big question that has yet to be answered.
Meanwhile, we can apply this idea to the stock market. Chronologically, this alternative approach is described in the articles:
http://www.timingsolution.com/TS/Articles/Time_Metric_1/planetary_time_1.htm
http://www.timingsolution.com/TS/Articles/PT/
http://www.timingsolution.com/TS/Articles/ptd/
Let me try to explain this approach in other words.
Time
The problem of time was always interesting to me; all my life I was looking for any information regarding it. First of all, it is unique. And it is strange: we need to use other physical phenomena while attempting to explain what the time is. Instead of the explanation, we have learnt only how to measure the time - by means of those other physical phenomena. For example, we can easily explain how the mechanical clock or watches work, or how the atomic clock works; we use them to measure the time, not understanding or explaining what the time is by itself. As St. Augustine said, "when somebody asks me what the time is, I guess that I know what the time is; though when I think about what the time is, I cannot truly say what it is". Time is not a motion (as Aristotle thought).
The modern concept of the time is based on Newtonian view on Space and Time. The Space and Time there are absolute realities that exist regardless bodies and their motions. This is a frame in which our Universe exists.
A hundred years ago, Einstein's theory of relativity ceased the Epoch of absolute Time and Space. Now we are told about space-time Universe where Time and Space coexist as not separate entities. For example moving clocks tick more slowly than "stationary" clocks. As an extreme example, the body that falls into Black Hole practically does not move from our Earth's point of view. One second of time for this falling body corresponds to billons years on the Earth. We cannot observe how this body reaches the surface of Black Hole (we cannot even see this surface). The time is practically stopped there from our point of view.
I did the introduction above to show that Time is not an absolute reality now; it becomes a subject of the research.
The examples above consider the physical time only (used by physicists and measured through physical phenomena). And the question still persists - how the human being sees or feels the time. IMHO the biological time follows its own rules that cannot be explained or described by physical phenomena only. The ancient man mostly used Moon calendar, it was (is?) more convenient for human needs. Also, the ancient man used day hours and night hours, and these hours were not equal: day hours were longer than the night ones in summers, and vice versa in winters. These hours were more convenient for the ancient man's activities, it would be very difficult to convince that man to use hours defined by the modern clock.
The techniques we explain in this article are very close to that ancient approach. For example, we can deal with the time using the Moon's phases, it is like "the distance of three Moon phases", Or we may measure the time using Venus phases. In other words, the arrow clock is able to points not only the year/month/day/hour, but the planetary phase (or the planetary position, or the angle between planets) as well, and we hope that the stock market's life in the time measured by this new/old way may reveal some patterns that are invisible in the commonly used time.
What does this approach give to us?
1) As you can see from the example in the beginning of this article, equidistant lines calculated in this new way of measuring the time looks differently than equidistant lines calculated in a standard way.
2) You can vary planetary combinations and find the time that is more suitable for your financial instrument.
3) Because the time calculated this way is measured in degrees, these values itself provide us some hints, like 360, 180, 120, 90 ... degrees. The example in the beginning of this article shows 210 degrees of Mars-Jupiter helio angle separation, this is 7*30 degrees.
4) Because the planets sometimes move retrograde, the time calculated in a new way can change the direction of its flow. In other words, we can come through the same place in time several times (do you remember the movie "The Groundhog day"? It works exactly the same way).
Here you can see the moments when Mars passes 5 degrees of Cancer:
Mars has passed this degree on October 11, 2007. Then, on December 18, 2008, Mars has passed this degree second time, in its retrograde motion; and it has passed this degree again on March 18, 2008 moving directly.
Space
This is an experimental approach; it is explained here: http://www.timingsolution.com/TS/Articles/ptd/
In short, here we try to use the second dimension, i,e. price. The price chart represents the map of the landscape, and we have to make this landscape suitable for the stock market's life. In our regular life, geodesists measure the distance between two points on the map. For the stock market, we can do it using the Equidistant cycles. They look this way:
Looks like these cycles form "attraction zones"; this is a kind of support/resistance zones but these zones work in two dimensional Time-Price chart:
Practical recommendations
So far (September 2009) I did not received yet enough information from users regarding the application of Time-Space approach (it has been developed recently). There was few responses on Space/Price portion, though I have got a lot of notes regarding Time module - Planetary Time module. This module is oriented to reveal turning points.
I recommend use it this way:
1) Download the price history and choose two recent turning points. Like here (turning points A and B):
2) Apply "Planetary equidistant lines" charting tool dragging the mouse from point A to point B:
Here I draw the Sun's equidistant lines.
3) The next step deals with very important issue: we need to choose the most informative planetary combination that describes well previous turning points.
Make the right mouse click on the active anchor:
4) and vary different planetary combinations in Options window. The program redraws the picture and adjusts the charting tools automatically.
Here I choose "Sun-Mercury Heliocentric" equidistant lines:
You see these lines hit very important March turning points, so we expect that these lines will work in the future.
5) Also try the next possible turning point (March, 23); it is tied with March turning point as well:
6) I always recommend to start with the most common combinations like the Sun, Sun-Mercury Helio, Sun-Venus Helio, etc ("common" - just because we discuss them practically everywhere on this website, in all our articles and lectures). These combinations are nothing else but planetary phases: Sun-Mercury cycle in Heliocentric coordinates is a simple Mercury synodic cycle, i.e. Mercury phases. Only after that try other planetary combinations.
7) When some planet is retrograde, try to use this tool:
Now (September 2009) Mercury has been retrograde, so I draw Mercury returns:
I do not think that Mercury's return is useful to reveal turning pints. It looks like it works more like a memory of Cosmos that ties together two very volatile days in August and September:
September 29, 2009
Sergey Tarassov
Toronto, Canada