Each and Every 7th Wave...
Technical notes regarding Turning Points Analyzer
The recent addition to Timing Solution - Turning Points Analyzer module - released a lot of discussion with users of the program. This small article is an attempt to answer some questions and comment some notes that I have received.
First of all, I would like to share with one unexpected observation. Working with high probability histograms, I always had a vague feeling that this activity is somehow connected with my 20 years of scientific work in the Institute of Nuclear Research (Russian Academy of Sciences, http://www.inr.ac.ru). It was a feeling that I have seen it already somewhere.
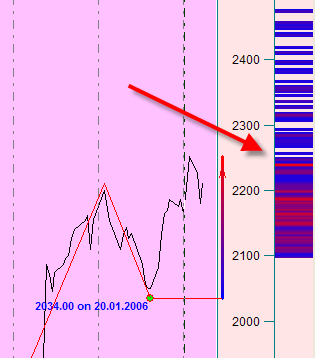
Finally, I have found why. The understanding came to me one day. Looking at high probability diagrams in Timing Solution that reveal possible turning points (like this):
I have figured out that they have a strong resemblance to Spectral Lines which can be observed at physical experiments:

These are universal things. These bright vertical lines are subject of interest for physicists and chemical scientists as they can be explained by quantum energy levels for electrons in the atom (the Niels Bohr's discovery, 1913). If these levels help scientists to develop and confirm their theories regarding the chemical structure of stars far away, they might help traders to make their money. At least, it gives some ground to traders' obsession with ideas like Fibonacci levels and different types of waves. Sure, there is a lot of work to do on testing and confirming these theories. In Timing Solution, the bright red zones on high probability diagrams give us an idea where the next price reverse point might occur.
So, back to traders' needs.
Working with Turning Points Analyzer, the most important thing is to understand what wave is most informative.
Let say that we are looking for the end of some uptrend movement. In other words, we need to figure out what will be the height of BC up swing (the examples are for corn prices, 1949 - 2006):
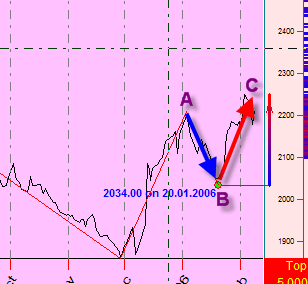
The simplest variant is to obtain the height of the upward BC swing using the height of the previous AB downward swing. This is the closest wave, and it should be definitely considered.
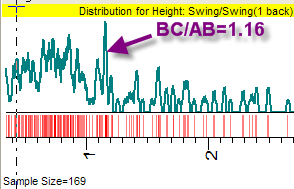
The high probability diagram shows that for this sample of data we should pay our attention to the price level corresponding to the proportion between the upward BC swing and the downward AB swing equal to 1.16 (it is the brightest red line on the high probability diagram and the highest sharp peak):
The interesting issue is that the market sometimes has longer memory. Sometimes the distant swing has strong impact as well:
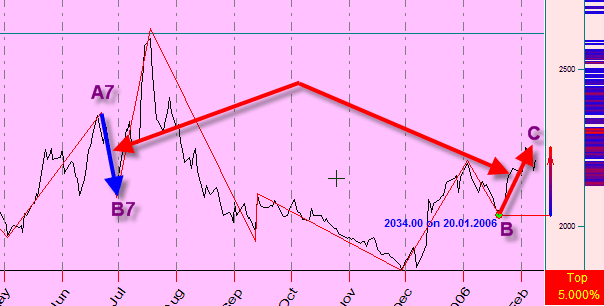
In this example, we analyze each 7th wave. In other words, we analyze proportions between upward BC swing and 7th downward swing A7-B7 (7 swings back). The statistics shows that this pair provides valuable information for corn:

The histogram shows that we have a cluster around 1. It means that the height of BC upward swing is often equal to the height of downtrend 7th wave back. Other levels are 1.9 and 0.8. I don't know why the corn remember his 7th wave. But I have some guess...
Timing Solution allows to do this research in a moment. You can check yourself any informative waves. The waves are defined here (Order parameter):
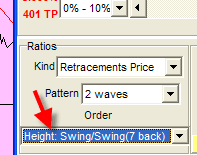
I recommend to check all waves. Each financial instrument has its own informative waves and its unique spectral lines picture.
One more observation. Sometimes the "quiet" zones on high probability diagram can be useful for a trader as well:
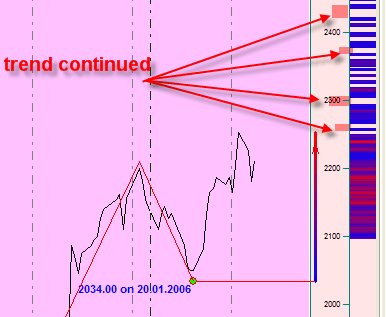
The white zones indicate that there are no turning points here, and the price will continue its trend movement.
One very important issue is the risk management. For example, if you would like to make you trading decision based on 1.16 level turning point:
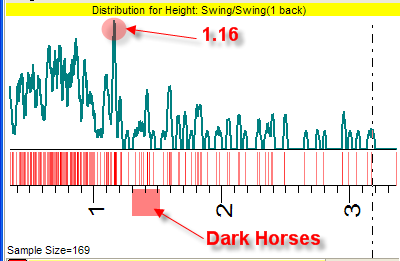
you need to remember that we talk here about the probability. There is a high probability that the turning point will occur there. However, besides the cluster in the region 1.16, there are many other levels where the trend has changed before, and these points are distributed almost randomly. You need to keep these "dark horses" in your mind, otherwise they can ruin any smart trading strategy.
It is interesting to see how phenomenological theories (such as Elliott Waves and Fibonacci levels and any other level or wave idea) become connected to solid mathematical grounds nowadays. It is true that only backtesting can provide statistical base for these (and any) ideas. And it is also true that we need phenomenological models (based on some observations). Statistics gives the solid ground while Phenomenology gives understanding. Together they work.
March 1, 2006
Sergey Tarassov
Toronto, Canada