Trading Signals in Timing Solution - fast introduction
Moving averages model: Daily data.
Speeding time model: Daily data.
In this article I will explain in brief how to generate buy/sell signals with Trading Strategy Constructor module. The main idea of this module is explained here http://www.timingsolution.com/TI/1/index.htm
Now let me show how you could use this module. All findings that I share with you are based on the extensive back testing of the models. However, Back Testing - though it is very important and it is the most advanced feature of this module - is not discussed in this article. You will find here ready for implementation solutions based on back testing that has been done already for you.
Models discussed below were tested on S&P 500 mini futures data, daily and 1 min charts. I also tried to to analyze EURO/USD ratio though I did not get any impressive results. The good news is the fact that it is better to use Turbo Cycles module for Forex data (this is a result of another back testing). So, Forex trading signals will be a subject of some other article.
Moving averages model: Daily data. If you deal with daily data, download at least 5 years of price history data (better 10 years, if it is possible). I tend to think that inverted triple moving averages strategy still is the best for daily data.
Run Trading Strategy Constructor module and click this button; the program will find the best moving averages crossover strategy analyzing 550 moving averages combinations:
For S&P futures daily data since its beginning (September 1997), the program analyzes 550 moving averages and finds the best one; it takes only 3 seconds!!!! The program's ability to do fast calculations is crucial especially when we deal with intraday data (to back test intraday models, we need to analyze the chart with one million bars).
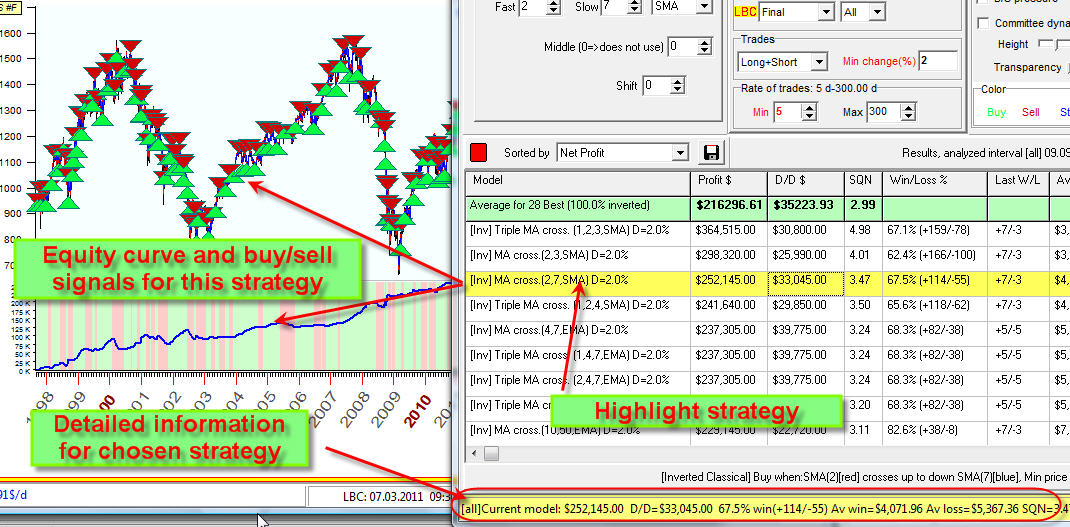
In 3 seconds you get a ready solution with best trading strategy found:
Here it is: ![]()
I know this strategy very well; it has been found a year ago (spring 2010), and it it still working (spring 2011).
If we would follow this strategy for 13 years, this model would give us 364% profit, win/loss=67%.
I recommend to click this button  to run a stand alone window with this strategy (Trading Strategy module), and this
strategy will be always displayed together with other Timing Solution
techniques.
to run a stand alone window with this strategy (Trading Strategy module), and this
strategy will be always displayed together with other Timing Solution
techniques.
One very important parameter for this model is "Min change" parameter. It works as a filter for whipsaw trades:
For volatile financial instruments this parameter is higher. The program sets
this parameter automatically, though I would recommend to vary it, i.e. set this
parameter as 1, then 1.5, 2.5, and 3 and every time click the optimization button ![]() to see the strategy provided by this model with the changed "Min.
change" parameter..
to see the strategy provided by this model with the changed "Min.
change" parameter..
How to decide what strategy from the list is good? The answer is a compromise of different factors. Here are these factors:
a) Watch total profit; it should be high enough while drawdown is not scary
b) Watch the equity curve together with the price chart. All models work very good when the market has up trend, so it is better to watch how your model overcomes hard periods, like the latest Great Financial Crisis.
c) Do not believe any "average" value, like the average Annual return. For example the average Annual return for this model within 2001-2010 period is 22%.
However, if we look at real return year after year, it is a very different story:
To get a report, follow these steps:
Always compare Annual report with buy and hold strategy. In our particular case, our model is able to make 364% within 13 years. But - in 2005, this model was losing the money, and in 2003 and 2006 its performance was a bit worse than buy and hold strategy. This is still a good model, you simply have to understand the risk behind impressive digits.
d) Do not forget about the commission and slippage, for intraday this issue is critical.
Speeding time model: Daily data. This model was proposed by Timing Solution user, Peter Palaskas. Thiemodel is based on astronomical phenomena plus quantum model. As so far, I do not quite understand why it works, but it works... The Sun can be considered here as a time counter, though this is accelerating time. This model now trades faster than 10 years ago. Maybe this model simply reflects the increasing tempo of our life?...
To get buy/sell signals based on this model run the template this way:
in several seconds you get this model:
Intraday data (a draft). Trading intraday is a totally different story. The difference is in finding a model for 3 thousands price bars (daily S&P500 futures since 1997) and a model for 3 million bars (1 min chart). It is obvious. (You may want to see the results of a real back testing provided for more than 1 million bar charts: here )
As it is now, I recommend to do these steps:
1) Download as much 1 min bars as possible. If you use eSignal data feed, download all 40K bars that eSignal allows to download:
2) Follow these steps:
This is how this model trades:
Though there are a lot of models with more loss trades, like 43.6% win/loss factor, they are still profitable.
The logics behind these signals is not obvious, it seems to me this model tries to catch deceptive motions in the price movement and plays against them (this is why we have more lost trades than win trades, while win trades give more profit).
Remember that there is one big problem with this model:: it is very sensitive to volatility, and to calculate the exact value of this volatility we need a lot of price history data. This is a very time consuming procedure; when I do it, it takes the whole night to my computer to do all calculations. (The volatility in question is a special thing; it is not a historical volatility. I guess we can take it as a value of a deceptive motion that is necessary to make a trade profitable.)
I think that in the future all calculations will be performed on one central computer, and Timing Solution users will be able to download the latest parameters for models that provide the best trading signals.
First of I will remind how Trading Strategy Constructor module works. While the price history is downloaded run this module and click this button:
In several seconds you will get the ranked list of best trading strategies. Simply highlight these strategies one-by-one to browse how this strategy works:
When the best trading strategy is found, I would recommend to run Trading Strategy module clicking this button:
This module provides pretty much the same information: trading signals, equity curve, win/loss zones ... However, there is one difference between Trading Strategy Constructor (TSC) and Trading Strategy (TS) modules. TSC module is oriented mostly on back testing while finding the most tradable strategy. TS module is developed mostly for real trading. When the best strategy has been found, you can put this strategy in TS module (as described above) and concentrate on trading features.
Pay attention to Buy/Sell function, set this option ON:
You will get this curve that indicates how close/far to a trading signal you are.
This curve is colored by red and gray colors. The trade signals appear when this line is red (and bold) and crosses zero level.
Buy signals correspond to the moment when buy/sell function crosses zero level from down to up (we are expecting the price to rise), like this:
Vice versa: when this curve is red and bold and crosses zero line from up to down, we have SELL signal.
When this curve is grayed and crosses zero level - there are no trading signals at that time:
Thus using a colored style of displaying buy/sell function, you get more important information that can be read this way:
Actually buy/sell function can be used as a regular technical analysis indicator; just pay attention when this curve (buy/sell function) crosses zero level. You can run the program in real time and watch how close this indicator is to zero level.
To inform you about newly coming signals, use "Alert" feature:
It is very interesting to study stock market behavior with buy/sell function. In the picture below you can see two buy/sell functions calculated for moving averages crossover strategy and for quantum strategy:
Moving averages crossover sees a stock market behavior as "a la" wave movement, every mathematician will see a "track" of harmonic function here.
Quantum function crosses zero level very fast: for a long time this function may be practically flat, and in some certain moment it changes drastically. Quantum model works better for intraday data, it looks like it reflects the severe stock market reality: decisions should be made very fast. Everything looks like pretty much the same (buy/sell function is flat), then something changes in the stock market behavior suddenly (buy/sell function jumps), and the transaction should be performed very fast. We deal here with a kind of a fading model; more information is here: http://www.timingsolution.com/TS/Study/fading_cycles/index.htm
Also, I need to remind you that - though you read MY recommendations and I share MY ideas with you, it is YOUR responsibility to decide what course of action you choose in your trading. In brief, all the above is not a trading advice.