Timing Solution Scanner - beyond the Technical Analysis
What is this article about?
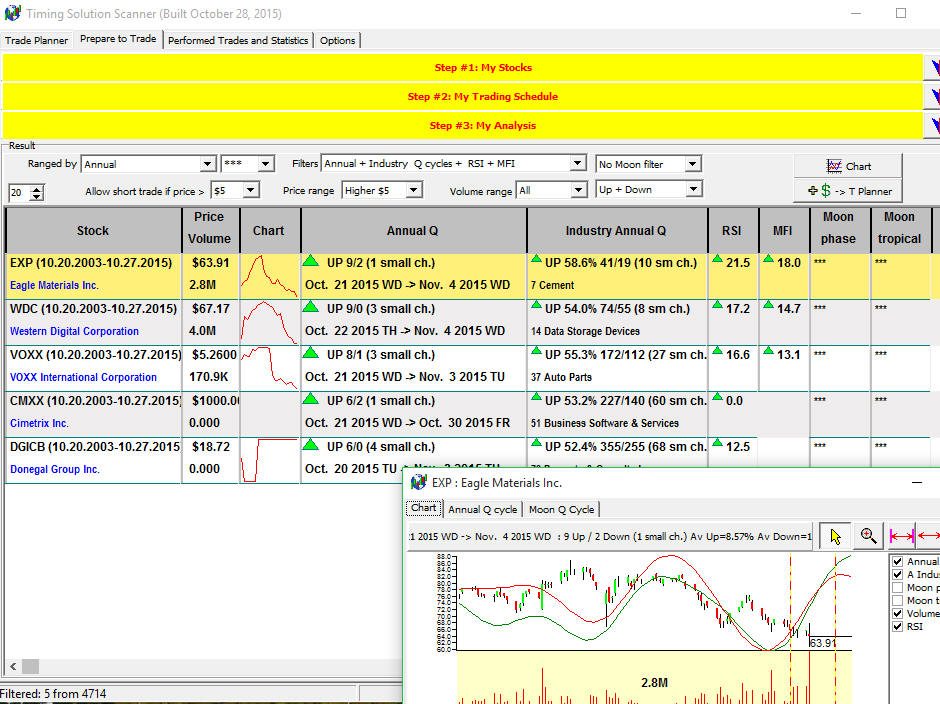
The screenshot below shows the typical output of Timing Solutin Scanner software:
To get this information, the program has analysed 4714 USA stocks downloaded from Yahoo financial sevice; for each and every stock from those 4714, it calculates Annual cycle, Annual cycle for the whole industry which this stock belongs to, and it calculates two Moon based cycles - Moon synodic and Moon tropical cycles.
Based on these cycles, the program finds the best tradable zones for each stock. Here they are:
And as an addidtional confirmation, it calculates two Technical Analysis indicators that describe a current condition of the stock: Relative Strength Index (RSI) and Money Flow Index (MFI).
This is a totally diferent approach than commonly used tools may provide you. You can easily obtain a list of stocks rated by their volume, price change, P/E ratio and many other fundamental/technical analysis parameters. Our approach is to perform the full cyclical analysis of the stock, and this fact makes possible to get a timing, trading plan.
Several years ago I did my first attempt to solve this task. It was a kind of "Difital fortess" for me then, as too many calculations had to be done. Later, step by step, I developed very fast algorithms for the calculations. And then 64bits computers appeared; it allowed to allocate more memory to speed up this task. So, what we have now is not only a tool that rates the stocks according to some fundamental/technical parameters. This program models the movement of each individual stock and it gives you a timing, the feature that cannot be obtained by commonly used techniques.
Scanners (screeners) based on technical/fundamental analysis
Scanning the stock is one of the most used by traders features. You can find it practically everywhere.
For example, let's look at Bloomberg website. There you can see stocks with highest gain or loss or stocks with highest volume. The general idea of all scanners is pretty much the same - we watch a lot stocks and pick up stocks that fit some criteria of our choice. Very often these stocks are rated by volume and price or price change to pickup the most traded stocks.
It is another example, the screenshot from eSignal scanner:
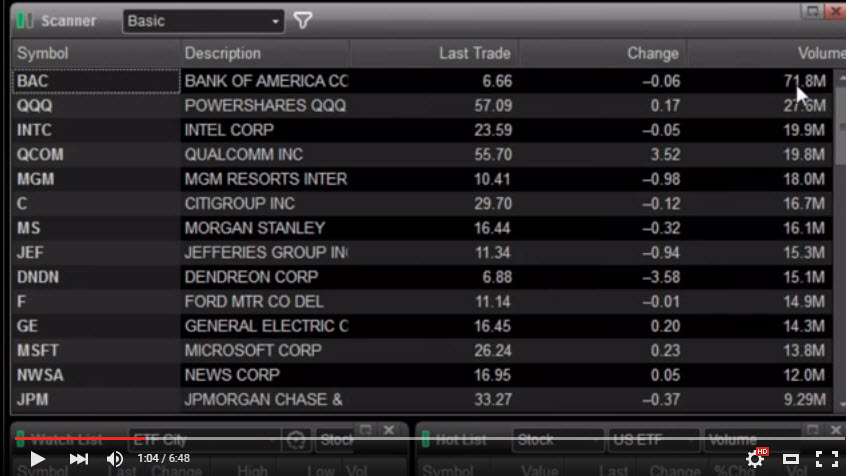
It pickups stocks with the price higher than $5 and volume no less than 5M shares. Here we simply filter the stocks that are not interesting for us.
In practice, any investor/trader looks at those screeners trying to find the stocks that look more promising for him. In this case, all information about these stocks is important: capitalization, alpha and beta, P/E ratio, corporative reports and many other factors. The investor/trader has a big variety of different tools that deliver him/her this information.
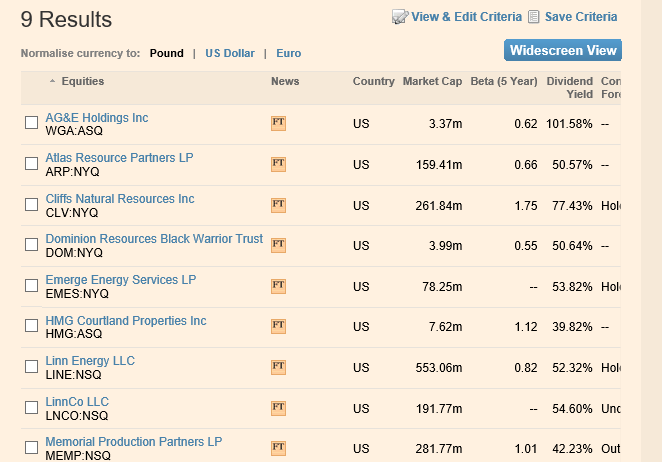
Here is one more example of the screener (from the website http://markets.ft.com/screener/customScreen.asp). It shows 9 USA stocks with the highest dividend yeld:
Or look at this example of a more sophisticated scanner (from the website ):
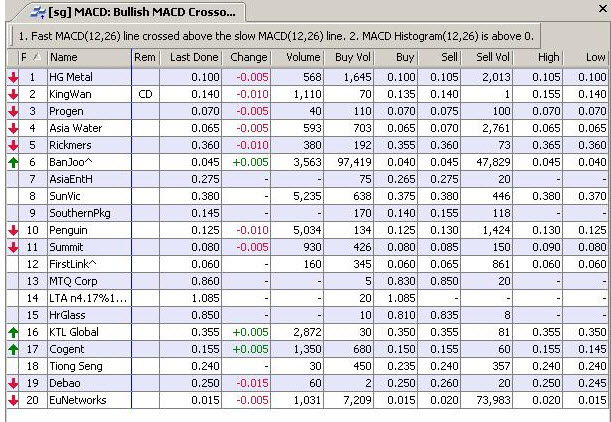
Bullish crossover scanner here pickups the stocks that have a fast MACD(12,26) line crossing above the slow MACD (12,26), while MACD histogram is above zero.
This scanner applies technical analysis rules. The stocks that match these rules are considered here as good one for trading stocks. There are a lot of scanners similar to that, they apply different technical analysis rules, sometimes a very complicated rules, with a hope that this approach helps to pickup the stocks the most suitable for trades.
Timing Solution Scanner - beyond the Technical Analysis
We introduce you something totally different, the scanner that applies totally different principles of choosing stocks. For each stock here we perform the cyclical analysis and give you a list of the stocks more promising from the cyclical point of view.
In other words, the stock scanner gathers the new dimension. Together with the standard parameters that give us some ideas regarding current health of some stock, we provide some additional information about a future movement of this stock. Every investor/trader knows very well that big return that some stock provided last year does not guarantee a good return for the next year. If you use technical or fundamental analysis only to pick up the stock for your trade, you always have a feeling that you are too late: the good stock that worked very well for several years in row has stopped working so well when it was bought, technical analysis indicators that showed a good performance in the past work not so good now, etc.
It is a very typical problem to financial analysis (whatever you prefer, technical or fundamental analysis), and the only way to overcome this problem (IMHO) is this: build up the model for the analyzed stock, build the model that generates the projection line for this stock. We apply here a new class of models here than just "seeing" the future; it crosses this magic NOW point. Having the projection line that sees the future, it is logical to apply it together with technical/fundamental analysis criteria that describe the current situation.
Now let me demonstrate how this approach works. This is a screenshot from Timing Solution Scanner software:
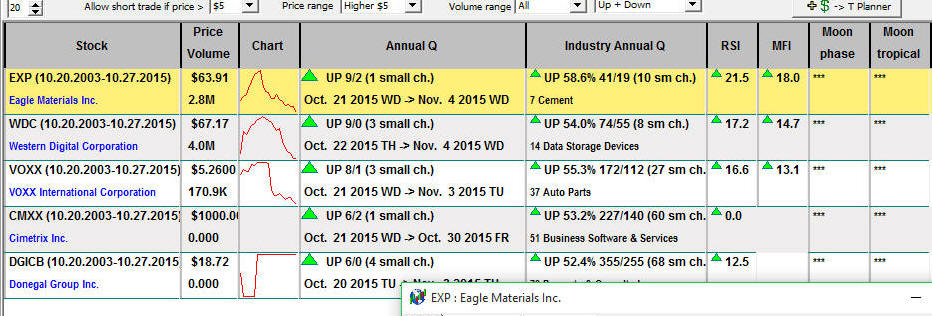
To get this table, the program has conducted a huge job. It has downloaded
4714 USA stocks, and for EACH ONE(!) of them it has performed the cyclical analysis, i.e. for
each stock we have several (four in this example) projection lines, lines that
forecast the future price movement for this stock. From all analysed stocks, the program pickups
only those with future up or downward movements confirmed by several criteria.
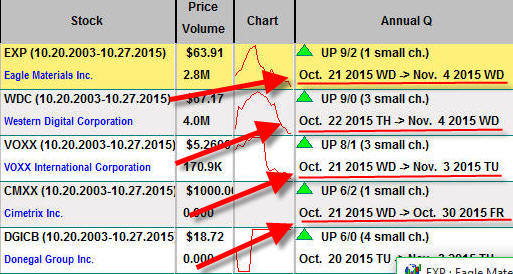
In our example, it is in total 5 from 4714 stocks: 
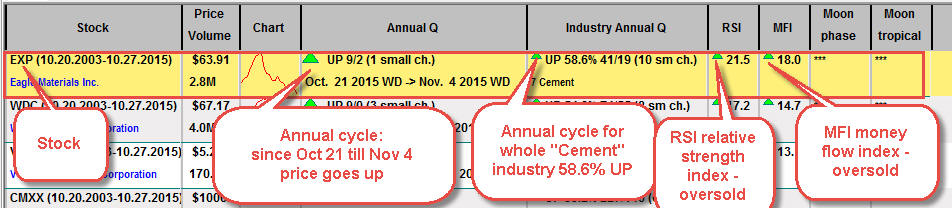
Look at this record in the table:
 Lo
Lo
This is what it means:
From analyzed 4714 USA stocks, the program recommends to pay attention to EXP stock (Eagle Materials Inc. company).
Why? Firstly because the Annual cycle for EXP shows a strong probability of Up movement since October 21 till November 4 of the current year. Historically within the last 12 years it moved up within this period 9 times versus 2 years down and one year when the price practically did not change (less than 1%) . Second reason is the sector analysis of the whole industry ("Cement" industry that involves 7 USA stocks) that indicates up trend movement as well. All these calculations are based on the projection line for this stock, i.e. the models that see the FUTURE price movement.
These records
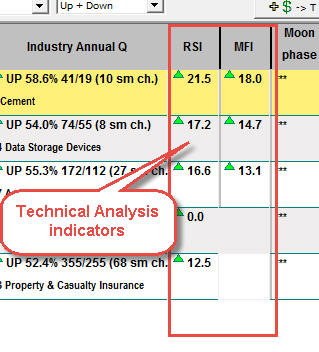
show what is going on NOW with our stock. Relative Strength Index (RSI) shows that this stock is oversold, i.e. we expecting that this stock will go up. This is one more confirmation for our long strategy (expecting up movement). Pay attention, RSI itself has nothing to do with timing, it just tells us that this stock is oversold, it is cheap enough and we expecting up trend movement. But it does not tell us WHEN it will happen, it may stay in oversold area for a very long period of time. This is "Achilles' heel" practically of all Technical Analysis (TA) indicators - they say "expecting the price moves...", though they do noonet say when, and this is why practically for each TA indicator you will find some kind of a disclaimer like that (from Investopedia website)
The RSI is best used as a valuable complement to other stock-picking tools.
With Timing Solution Scanner we tried to find the right balance between the projection line and Technical Analysis tools. Projection lines do timing, we are expecting that the price should go up since October 21 till November 4. While RSI (as an example) does pricing, it shows that this stock is cheap enough (oversold), and it is ready to go up.
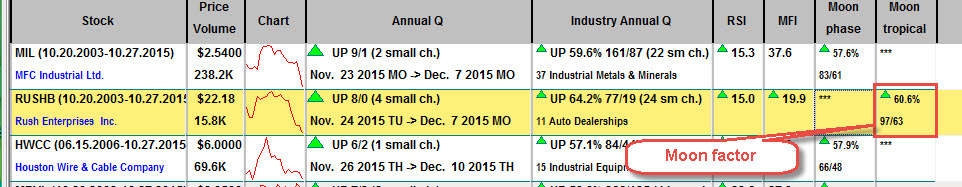
Moon factor
In example above we used Annual cycles and two Technical Analysis indicators only. There is one more possibillity here that I still consider as experimental. This is Moon factor.
You can easily find materials about Moon influence on the stock market. This is a really statistically approved fact, though there is some problem there. The effect of the Moon is very weak, typically the influence of the Moon is less than 5% (in terms of Pearson correlation). I do not think that the trading system that is based 100% on the Moon is possible. However, you can use the Moon factor as an addidtional confirmation factor; and you can employ this factor in Timing Solution Scanner.
In the example below, the program has found a strategy for RUSHB stock that is confirmed by Annual cycle, Anuual industry cycle, RSI and MFI indexes and also is confirmed by the Moon tropical cycle:
Sergey Tarassov
October 20, 2015
Toronto, Canada