Very basics of harmonic analysis:
Periodical function, Cycles Period, Cycles Waveform, Fourier Series, Harmonics (Overtones)
written by Sergey Tarassov
In this class I would like to explain you the basics of cyclical (=harmonic) analysis. I will try to do it as easy as possible from one side and following standard scientific procedures from the other side.
After reading this article, you should know these things:
- Cycles are not only sinus waves;
- Periodical function;
- Cycles Period;
- Cycles Waveforms;
- Harmonics (Overtones);
- Fourier Series;
- How to calculate a phase of the cycle;
- How to calculate a waveform of the cycle.
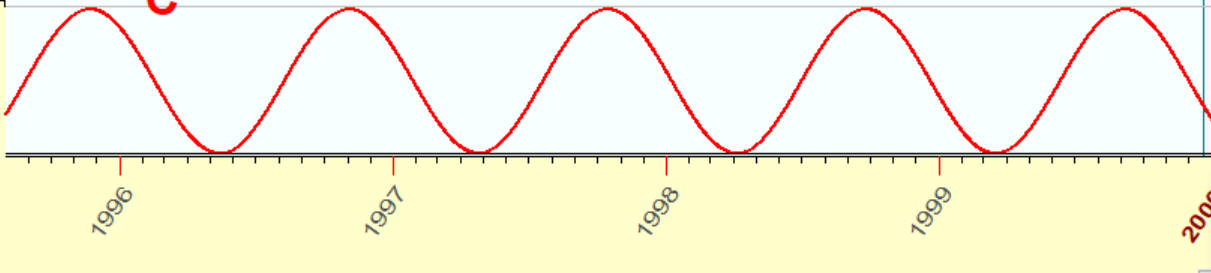
Very often people understand a cycle as an ideal sinus wave similar to this one:
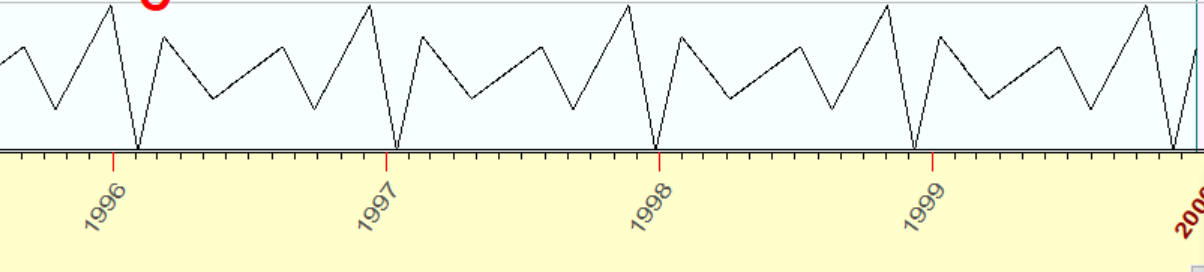
while a wave may look like that one, and this is also a cycle:
Both these curves (i.e. an ideal sinus wave and an irregular wave above) have the same feature: if we shift any of these curves on 346 days, we will get exactly the same curve:
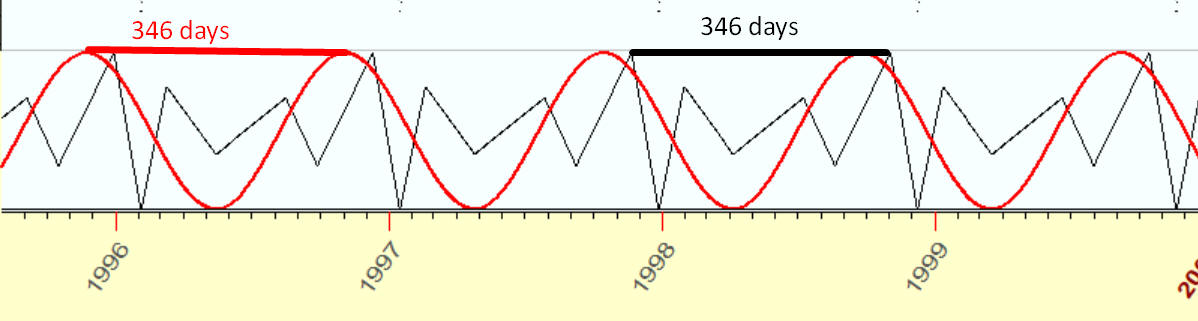
This is a PERIOD of this cycle, and these curves are called PERIODICAL FUNCTIONS. Both these curves represent cycles with the same period though different WAVEFORMS.
The main point of this article is: to analyze these irregular waves, and you do not need to apply some other math techniques here. Any ideal sinus wave is analyzed using the same math procedure as an irregular choppy wave.
The mathematical basis of this approach is FOURIER SERIES technique. For our case with 346 days wave, it may be formed this way: any periodic wave with the period of 346 days is calculated as a sum of sinuses and cosines HARMONICS (or overtones). For 346 days, i.e. 346 days wave, the overtones are 346/2=173 days wave, 346/3=115.3 days wave, 346/4=86.5 days wave, etc. This is the formula:
A0+A1*(346 d sinus wave)+A2*(346 d cosine wave)+A3*(173 d sinus wave)+A4*(173 d cosine wave)+...
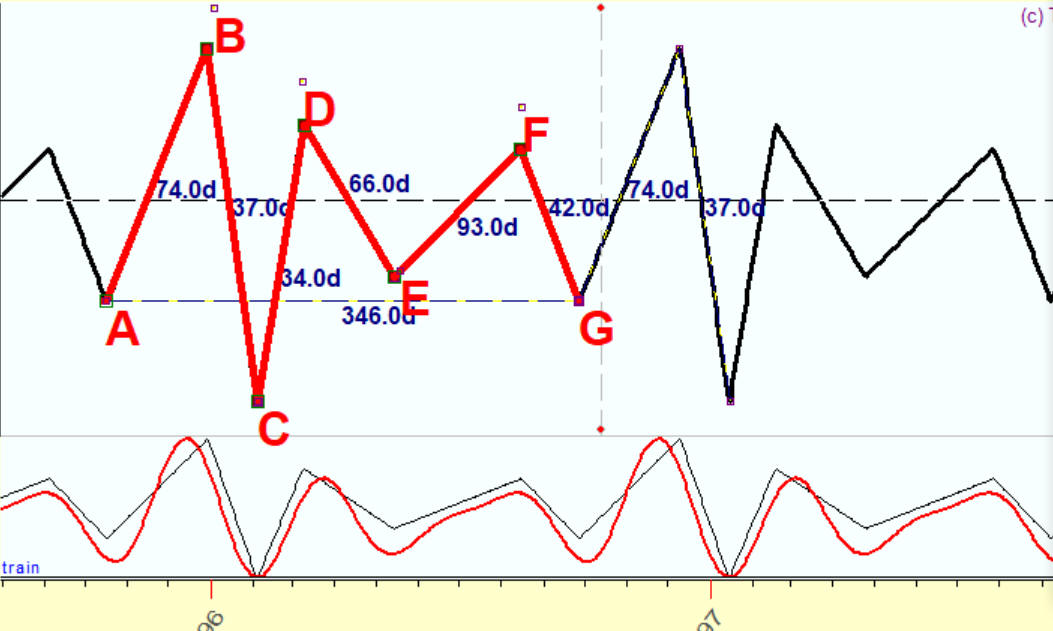
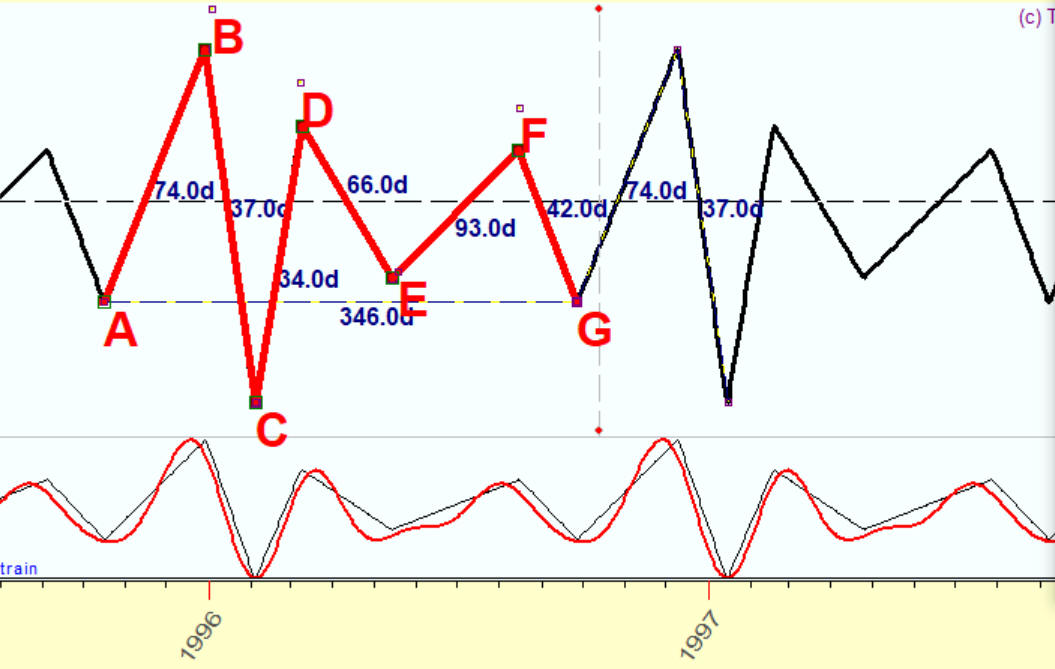
Now I want to demonstrate how this technique works with Timing Solution software. I have created manually a price history dataset with this periodical pattern:
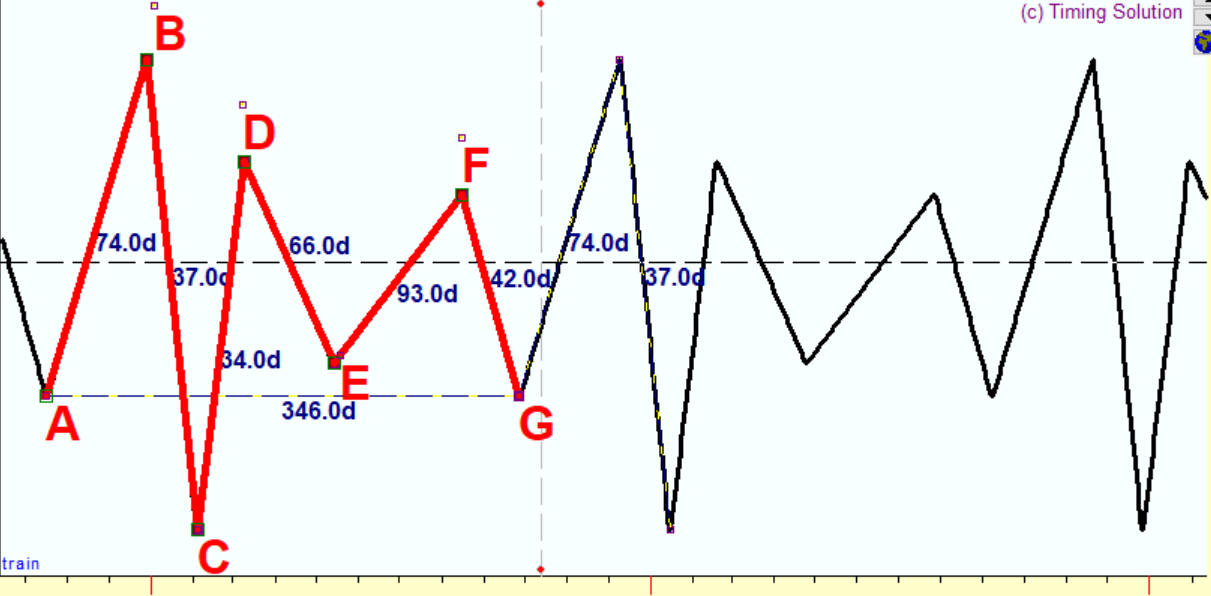
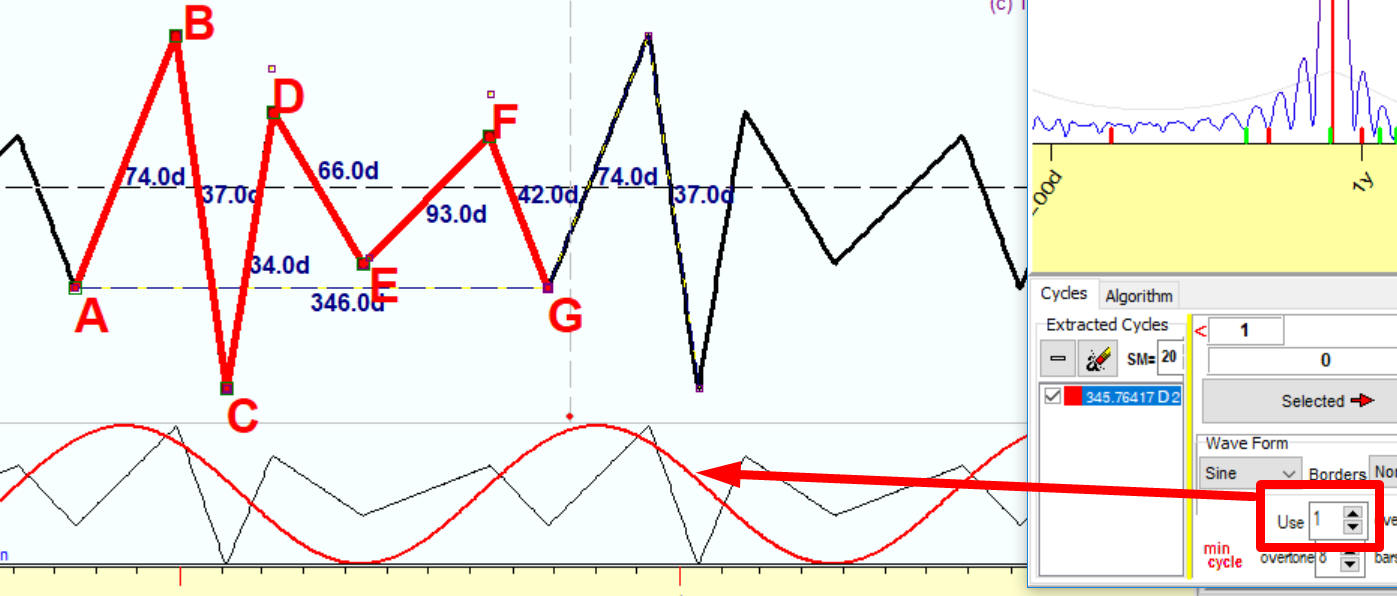
In 74 days after the bottom A we have the top B; then in 37 days after that we have the bottom C, in 34 days the top D, in 66 days the bottom E, in 93 days the top F, in 42 days the bottom G. In total, this patter covers 346 days; it repeats itself every 346 days.
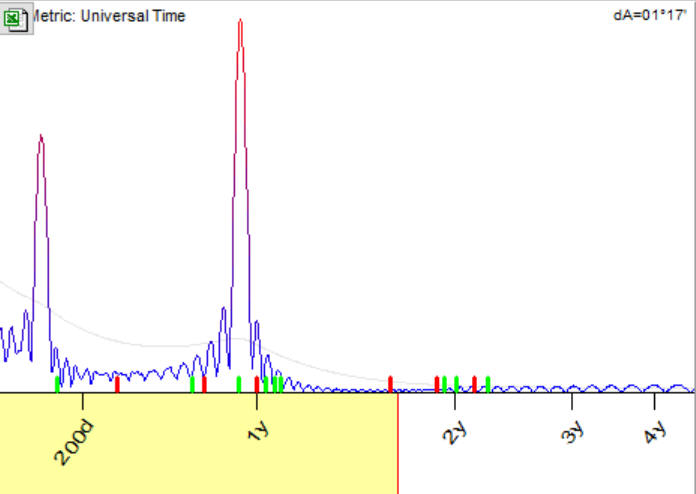
I run Spectrum module. Immediately it reveals a presence of 346 days cycle; you see the peak there:
Now I have picked up this 346 days cycle and ask the program to build a projection line using one overtone only; i.e. this projection line is calculated as a superposition of two waves: sinus 346 wave and cosine 346 wave. Here it is:
Now please pay attention to some small lesson on harmonic analysis; it is one of the often asked questions. How the program finds the phase of this 346 wave?
The answer is: the program does it automatically, you do not need to worry about finding the phase. Two waves: sinus 346 days and cosine 346 days - form, as mathematicians say, an orthogonal basis. In other words, any 346 wave with any phase can be calculated as a superposition of sinus 346 and cosine 346 waves. Like this:
any 346 days way = A1*sinus 346 days wave + A2*cosine 346 days wave
The only things you need to calculate are those coefficients A1 and A2, and this is what Timing Solution actually does. Having coefficients A1 and A2, you can easily calculate the phase (it is a well-known trigonometric formula).
OK, I hope this issue with phases is clear now, but what about waveforms? The sinus wave above does not fit our irregular wave well enough. It just shows a very general tendency.
Do not worry about the waveform either. Overtones perfectly do this job, and I think this is the fact that have amazed Joseph Fourier in 1807 when he invented Fourier series (trigonometric series).
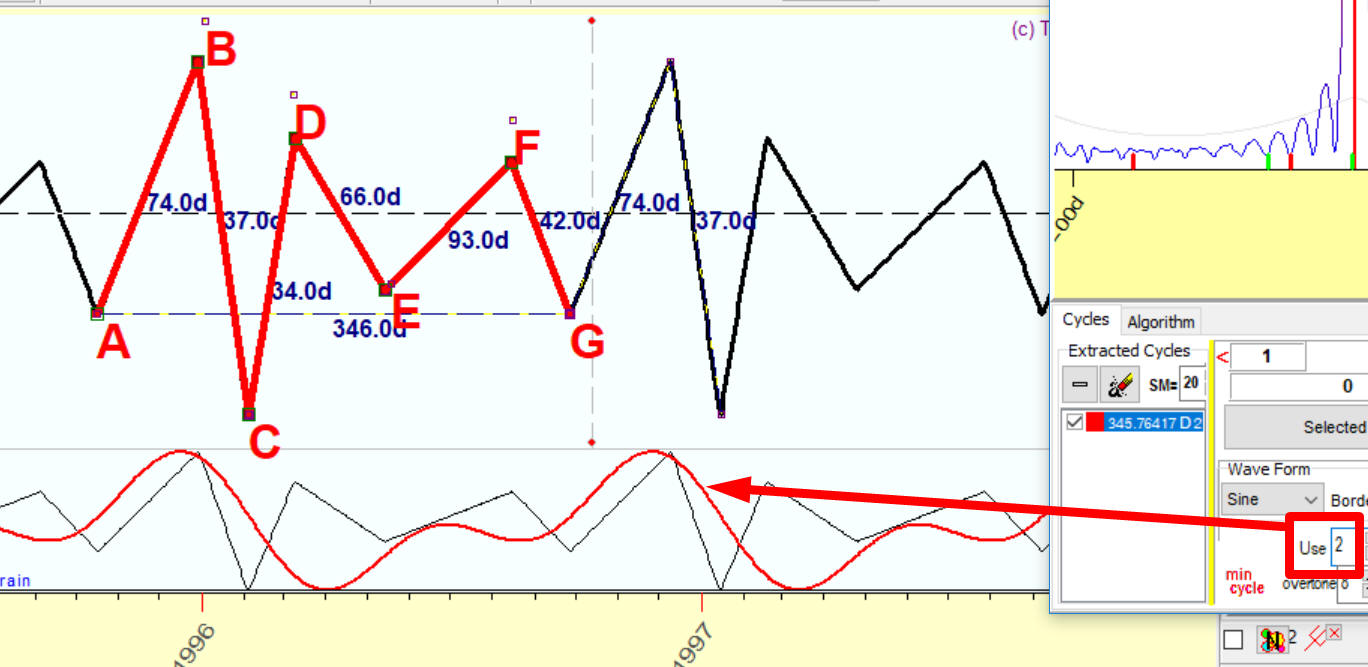
Let us add to our projection line a second harmonic (overtone), i.e. 173 days sinus and cosine waves. See how our projection line looks now. 173 days wave makes it closer to our original irregular wave, is not it?
Add the third harmonic, 115.3 days wave. It shows all turning points though not precisely:
This is not surprising, as our irregular wave within one period covers 6 turning points. Accordingly, the third harmonic within a full 346 days cycle covers 6 turning points as well.
Now I have added the 4th harmonic, i.e. 86.5 days cycle; and you see a red projection line that shows irregularities much more better now:
The 5th harmonic is added:
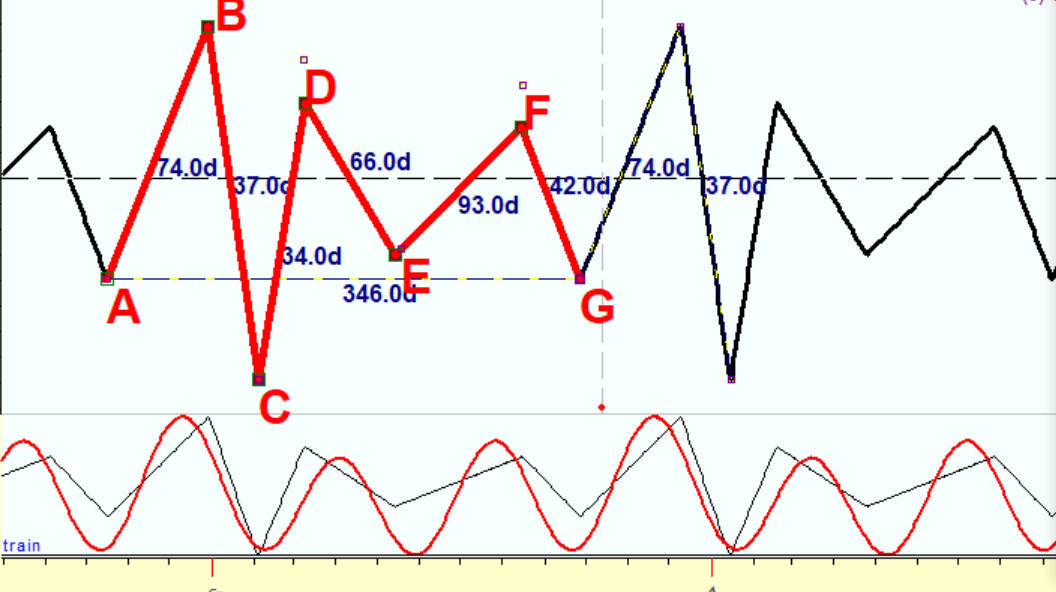
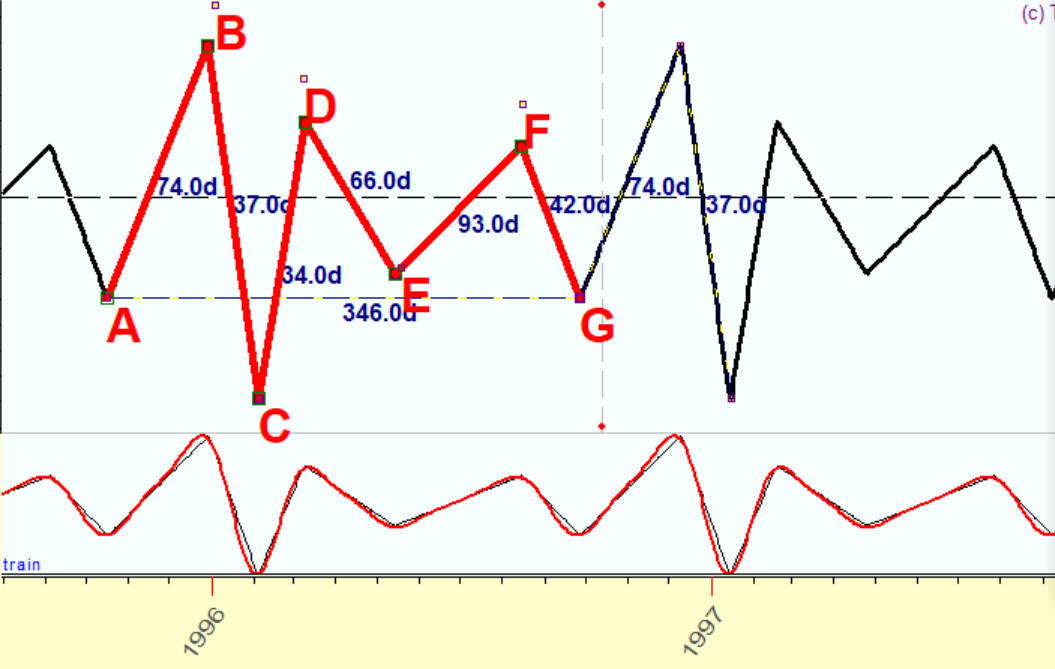
Make 8 overtones, and the red projection line and the black original irregular wave are practically identical:
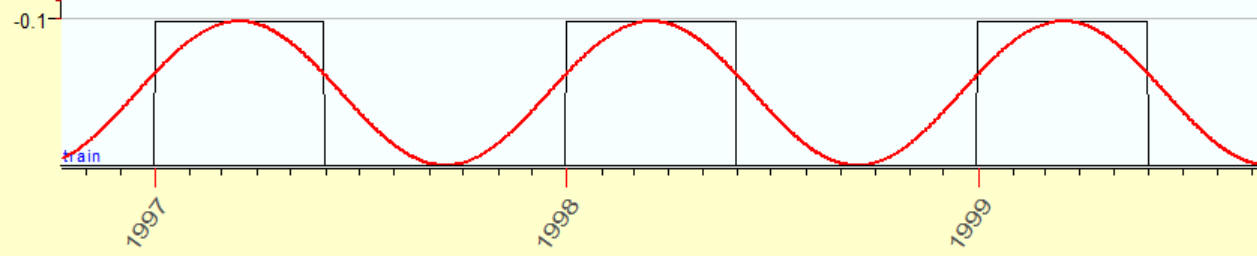
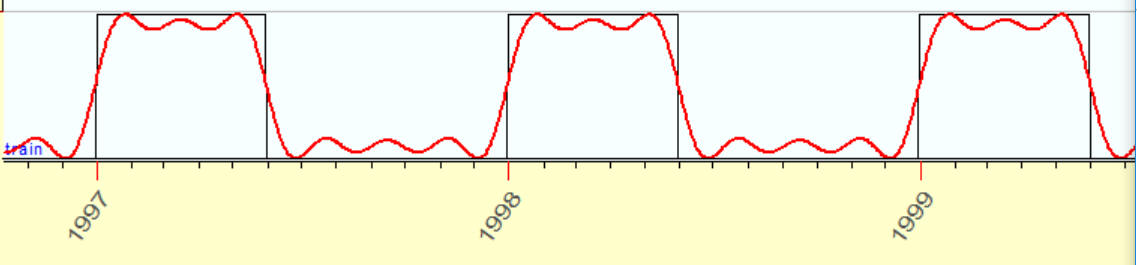
As an example, I will show how you can model a square wave. Here is an example of a square wave:
\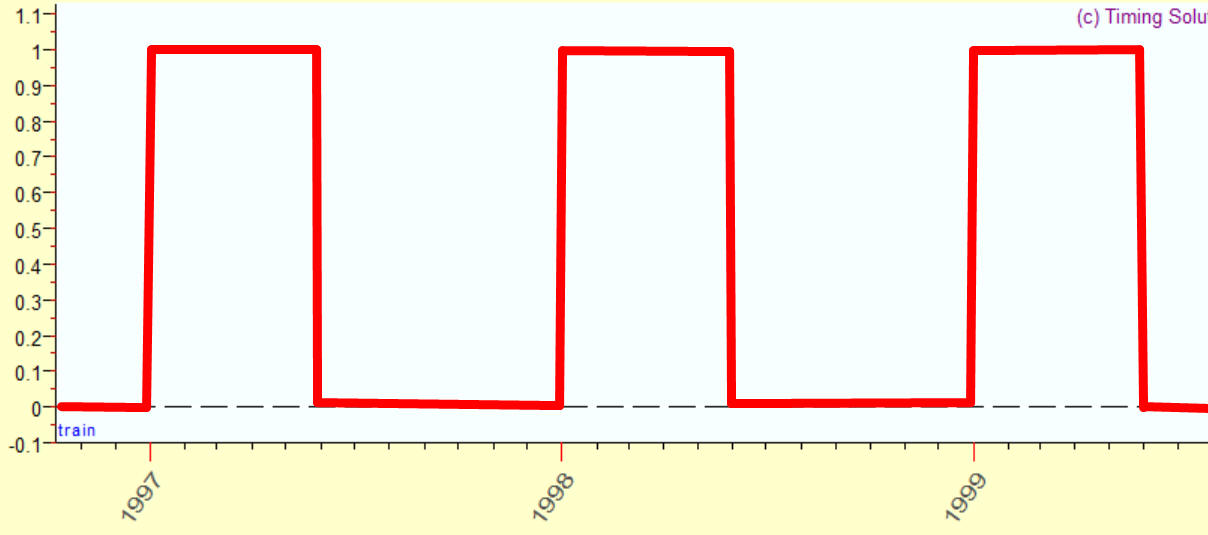
This function equals one since January 1 till July 1, all other months it is equal to zero. This is a classical example, you can find it practically in all books regarding harmonic analysis. Let us do it with Timing Solution.
Using 1 overtone:
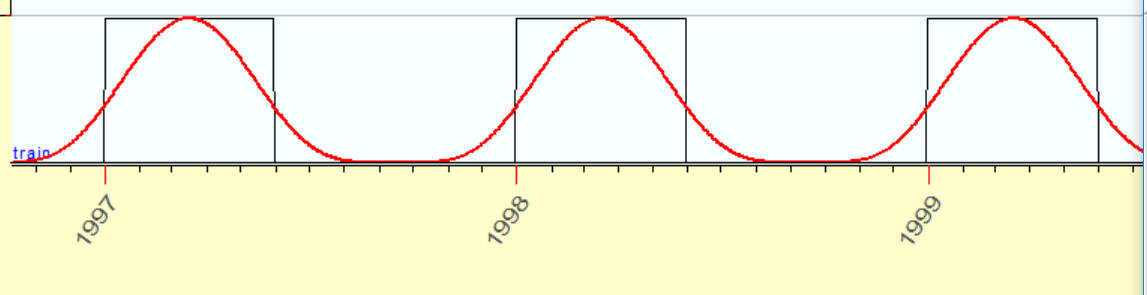
2 overtones:
3 overtones:
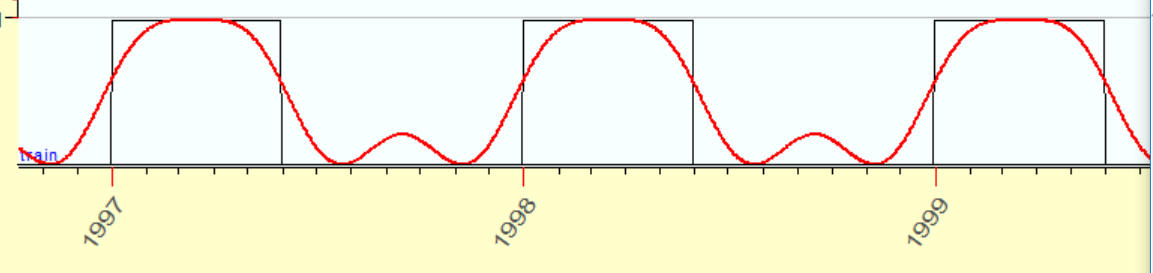
4 overtones
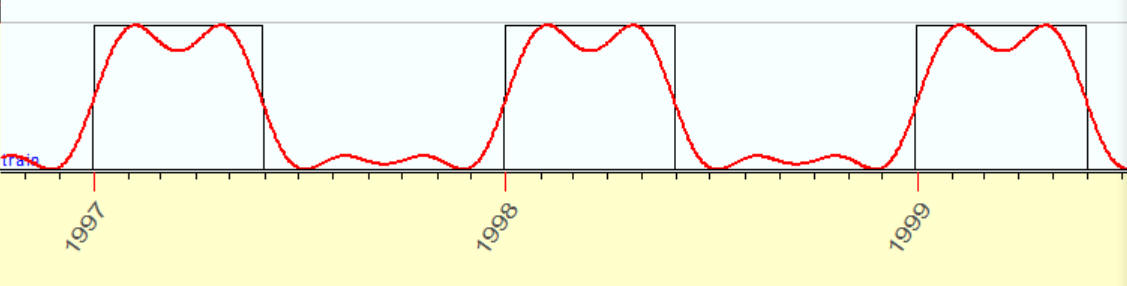
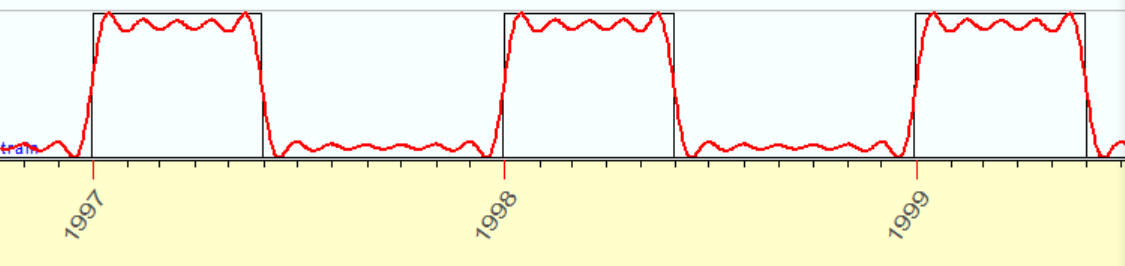
6 overtones
12 overtones
I hope that now you can see all the beauty of harmonic analysis as I do. It is a complete system, and it does not need any new additions to it. Yes, there are still some problems, but - they all are related to specifics of financial mathematics.
September 20, 2017
Toronto, Canada