Logarithm, Square Root scales in Timing Solution
written by Harvey Hahn
WHAT DOES THIS OPTION DO?
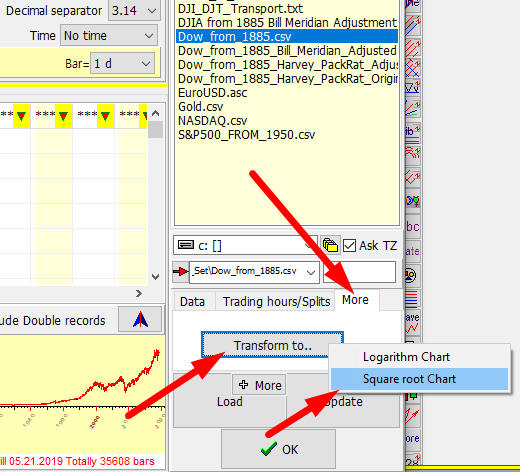
Choosing this option transforms your market data after you have clicked "Load"
to import it into TS, but before you click "OK". You click "More", then
"Transform to..", and then "Square root Chart". This option automatically
converts the original OHLC prices (that you just loaded) to the square roots of
those values. After conversion you can complete the download process as usual by
clicking "OK". Because Sergey has said (in a TS message about logarithmic
scaling) that changing the actual chart scales is impossible, the data is
changed rather than a chart's price scale being changed. (The end result looks
the same with either approach.)
IMPORTANT: This means that any price values (tops, bottoms, etc.) that you are
interested in on a chart need to be SQUARED in order to know the ACTUAL value!
(Be aware that recovering the actual value of a converted value will be very
close, but it may not be exact due to rounding issues in conversions both ways.)
WHY PROVIDE THIS OPTION?
History and description of Square Root Scale charting:
There are two well known ways of charting market data--using an arithmetic scale
(the default method) and using a logarithmic scale. The problem with arithmetic
charting is that it exaggerates the fluctuations of stocks at high prices. The
opposite problem occurs with logarithmic charting because it exaggerates the
fluctations of stocks at low prices.
However, there does exist a "middle way".
In early 1931, Frederick R. Macaulay, a statistical researcher with the National
Bureau of Economic Research (NBER), noticed that price movements of stocks
tended to be proportional to the square roots of their prices. Homer Fahrner,
originally an analyst at the San Francisco office of Dean Witter, promoted
square root charting during the 1930s through the 1950s. H.M. Gartley (of "Gartley
pattern" fame), in his 1935 book, "Profits in the Stock Market", stated that, in
contrast to arithmetic and logarithmic scales, "The square root scale, measuring
changes in increments of square root, tends to allot equal graphic distance to
price movements at all levels." At least one market advisory service used the
square root scale in all of its charts from the 1940s through the 1960s, and at
least three market authors, John Fillmore Locke (1946), William Dunnigan
(1952-1957), and Franklin Paul Jackson (1972), wrote works about success in the
markets which promoted and depended on square root charting. Nowadays, an
example is the Trading Fives web site
http://www.tradingfives.com/articles/squareroottheory.htm , which gives
their take on square root theory and especially how it relates to W.D. Gann's
ideas. Because Gann dealt with squares and square roots, there *may* even be a
possibility of finding some new insights into his work by using square root
scale charting.
Timing Solution is one of the only market software programs that offers all
three types of scales--arithmetic, logarithmic, and square root.