Evolution of Bradley Model
The model proposed by Donald Bradley (he called it siderograph) in 1947 is the most fractionated technique in financial astrology. I personally believe that Bradley opened for astrology the door to financial analysis. At least, since that moment the financial astrology started speaking the language understandable to somebody else, not only to astrology fellows.
Technically speaking, the siderograph is nothing more than a curve based on transiting aspects. So
we can consider the siderograph as the summary effect of transiting aspects.
The aspects are divided on three groups:
middle term - the aspects that include the Sun, Mercury, Venus and Mars;
long term - the aspects for slow planets (from Jupiter to Pluto)
declination factor - "..half the algebraic sum of the given declination of Venus and Mars ..."
This article is devoted mostly to technical issues of using the Bradley type indicators for traders needs.
If you would like to know more regarding the history of Bradley barometer. please see this interesting article by Larry Pesavento:
http://www.esignallearning.com/education/marketmaster/archive/0706/070706.asp
Of course, the original book of Donald A. Bradley is highly recommended.
When the theory comes to the open World, the first question that usually arises is: how to improve this theory. Regarding Bradley model, there have been a lot of questions there:
- do we need to take into account the North Node?
- what orb is better (Bradley used 15 degrees orb)?
- what about heliocentric aspects?
- what about creating a model based on Natal Chart?
- what weights for different aspects are better to use?
In 1947, when most of the calculations were performed manually, it was practically impossible to answer these questions. The only available computers (like ENIAC) were used for army and nuclear physics needs only.
Nowadays, we can answer these questions. Each one was a step in developing the Bradley models as we now them now.
So, this is the story of developing Bradley models. The Bradley model has been presented in the earlier versions of Market Trader software (see http://www.alphee.com). In 2004, it was developed as a stand alone Bradley Barometer program. This program allows to create all possible Bradley type models (with Natal chart, Heliocentric Zodiac on others). You can find Alphee Lavoie's video explanation regarding this software here: http://www.alphee.com/videos/index.htm
The most interesting feature here is that we can adjust the weights for all terms and immediately see how the projection line changes:
Now, as a part of Timing Solution project (http://www.timingsolution.com), the Bradley models use genetic optimization procedure. It helps to find the best fitting projection line based on these models. The idea of optimization is pretty simple - we are looking for the weights for all aspects in order to describe the past price movement in the best way.
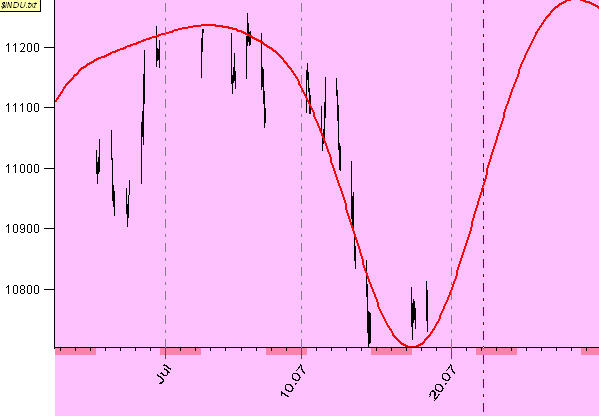
Let's demonstrate how to get the optimized Bradley model. We do just one example. Download the Dow Jones Industrial Index from February 2006 to July 17, 2006. This is short price history, five months only. The Neural Network does not allow to make the projected line based on such a short price history. However, Bradley module does this job very well.
The classical Bradley provides this projection into the future:
Let's optimize this Bradley model. Click ![]() button. You will get this window:
button. You will get this window:
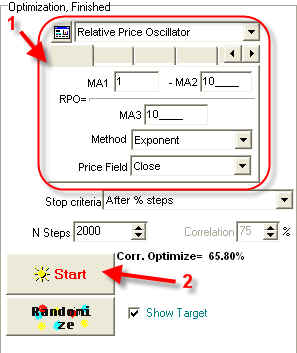
Here you should define the "target" - it is what we need to forecast. In this example, I work with the relative price oscillator with the period of 10 price bars. You can try to make forecast for other indicators like volatility, ADX, RSI, etc.
Click "Start" button to see how the red projection line changes while adjusting to available price history.
Be advised that to optimize we use the price data on TRAINING INTERVAL only:
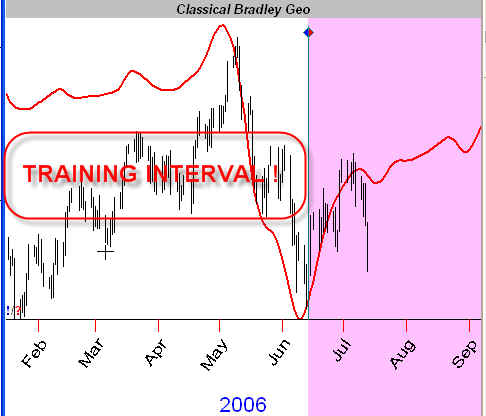
The red zone is TESTING INTERVAL to verify our projection line.
After the optimization procedure, the projection line looks:
Now, I would like to add some technical notes regarding the usage of Advanced Bradley Barometer in Timing Solution software.
When you work with long price history data, the program shows you the projection line not for ALL available price history points, but for the LAST %x price bars only:
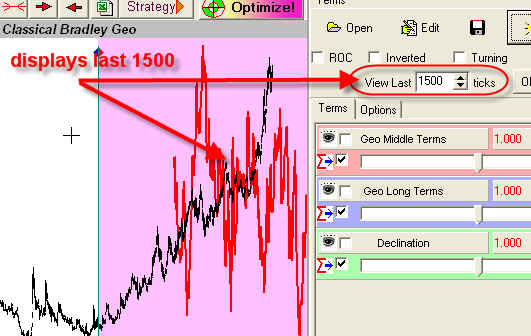
We have done that to speed up the process of recalculation of the projection line when you vary the weights corresponding to different terms.
You can increase this parameter like this: ![]() to see the projection line for all available price history (do not forget to
clock "OK" after the increase).
to see the projection line for all available price history (do not forget to
clock "OK" after the increase).
When you run the Bradley model, choose one of the following models:
"Custom FAM 1" model allows to create so called FAM model that analyses the active zones of Zodiac.
Try to apply this type of models (I mean, Bradley models) for the short price history data. Comparing to Neural Net based models (that need a lot of data for training), this is a very important and unique feature.
Have a happy trading!