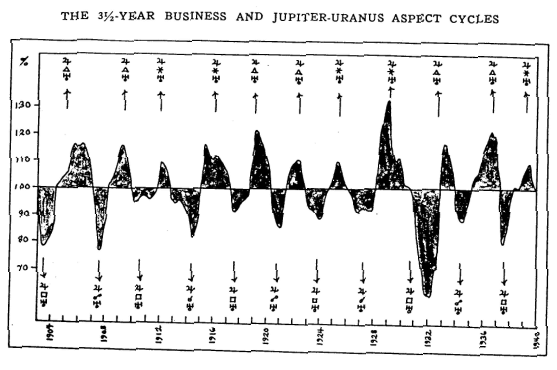
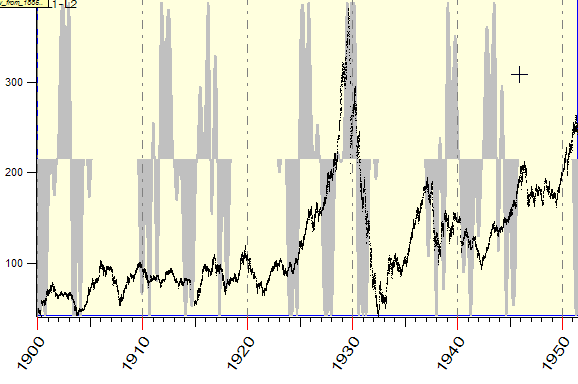
According to this diagram, its maximums coincide with trine and sexstile aspects, while the deepest downs correspond to conjunctions, squares and oppositions. So, we have here two groups of events (they all are aspects, though their effect on market differs).
So, let us define the aspects of the first group: aspects that correspond to the highest points. It means the event "Jupiter makes a sextile or trine to Uranus", we mark this event as L1:
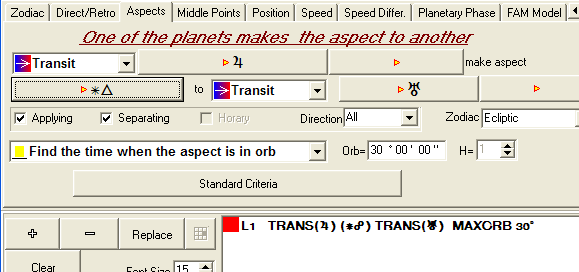
I used a very wide orb here - 30 degrees. (I know the regular values for orbs of different planets, I choose 30 degrees intentionally: it provides a nice looking picture. You can play with lesser orbs, and see yourselves what you get.)
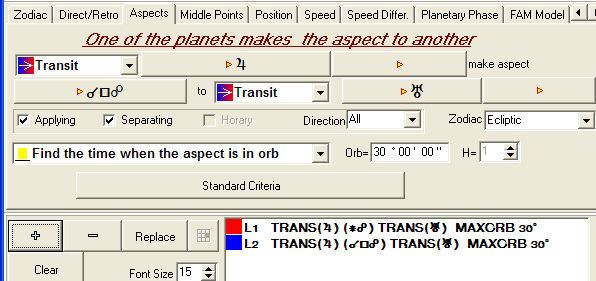
The next step is to define events for the bottoms of Dow diagram that coincide with conjunctions, squares and oppositions. It will be L2:
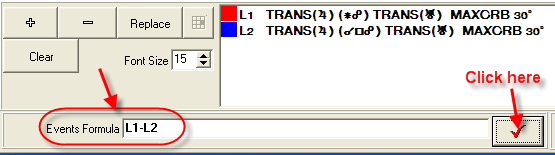
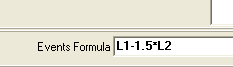
The final formula should look as "Positive aspects (L1) minus Negative aspects (L2)":
After the calculation, this cycle looks like this:
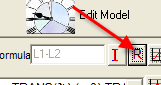
We can check how this cycle fits the real price movement clicking this button:
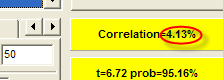
We get this window:
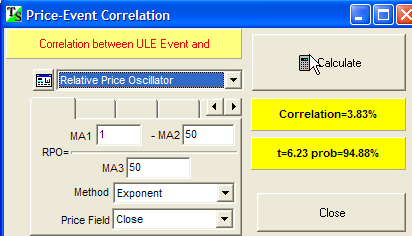
As you see, this cycle describes almost 4% of price movement. This is a very good addition to annual cycles that usually provides about 10% correlation.
This figure: 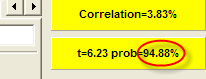 means that this fact may occur with the probability 94.88%. It does not mean that
we explain 94.88% of price movements, it is only about the fact that this cycle
does affect the real changes in DJI with the probability
94.88%, and the input of this cycle
is approximately 4%.
means that this fact may occur with the probability 94.88%. It does not mean that
we explain 94.88% of price movements, it is only about the fact that this cycle
does affect the real changes in DJI with the probability
94.88%, and the input of this cycle
is approximately 4%.
There is something else we can do. We can play with weights for positive and negative aspects. For example, I have an idea that the input of negative aspects on DJI is more than we have considered. Let's say, it is 50% higher. Add a coefficient to this formula:
calculate this cycle and see how it fits the price movement. It fits a bit better:
In this example, the confusing part is the influence of the aspect of conjunction. We are in better position than Mr. Bradley as we have now twice longer Dow Jones index history and we have this software that allows to perform our calculation millions times faster, I believe.
So, let put different aspects into different "boxes".
L1 - sextiles and trines;
L2 - squares and oppositions;
L3 - conjunction.
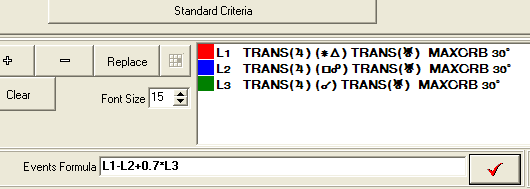
We can assign different weights to different aspects (here I give to the conjunction a positive weight (70%)):
![]()
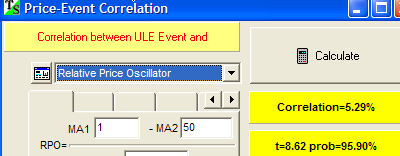
This model describes the real price movements better (correlation 5.29%):
Now you know how to deal with Bradley models. As you see, there is nothing complicated, just use Universal Language of Events (or SuperSearch module).
You can do the same to other financial instruments.