Lesson 6
Composite - Introduction
The effect of astronomical cycles on the stock market is the most enigmatic phenomenon that I know. It is enigmatic in many ways. First of all, my 10 years research of financial data definitely shows that the most reliable projection line is provided by astronomical models. And this is the enigma for the scientific community: they cannot accept this and they cannot prove that there is no such influence. This is enigmatic for astrological community as well because very often the statements of classical astrology do not work while being applied to real financial data. So I think that the best way is to study these phenomena without any preliminary assumptions and any prejudice, to study them as they are.
This is what we will do now - study astro cycles. We start this study with the most familiar astro cycle - Annual cycle. The annual cycle is formed by the Sun passing through all signs of Zodiac. This cycle was well known to humans for thousands of years. Actually, we use it to measure the time. Let us look how the annual cycle may be applied to financial data analysis.
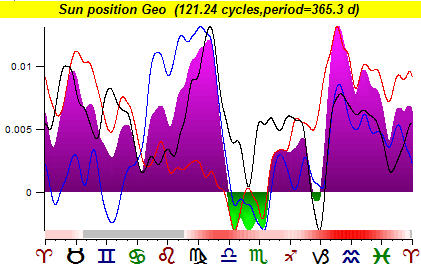
Download Dow Jones Industrial data from 1885 to the year 2006. To reveal Annual cycle, click "Astronomy" button. You will get this picture:
This diagram shows how DJI changes when the Sun goes through different signs of Zodiac. You see here that sometimes the value of DJI is very high, while for some other periods it is very low. This is the solar breath of the stock market, and its rhythm is caused by the movement of the Sun.
This diagram allows to make some conclusion regarding DJI movement in respect to the Sun's position:
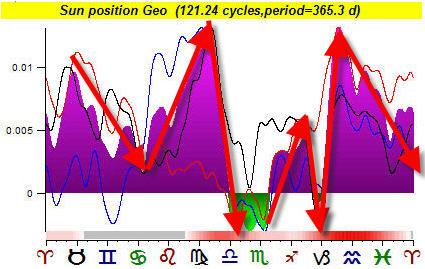
From the end of April to the end of June, the price usually goes down. From the end of June to the end of August, we see the up trend followed by short though strong September correction etc.
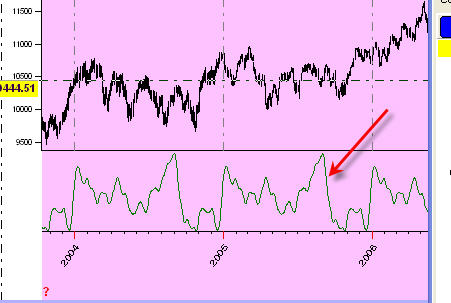
The picture above is a "planetary portrait" of Dow index, or, more precisely, its solar portrait. However, for practical needs, we are more interested in the information on real price movement in time. You can find it on the Main screen: look at it now to see how this Annual cycle appears in time:
This cycle is just one of many possible cycles. We can create composites for every planet and compare these cycles to the actual price movements. Plus we can consider more complicated (and more interesting) cycles, like cycles of the mutual movement for two different planets. For example, one important cycle for DJI is Jupiter - Saturn cycle. Its period is 20 years. Therefore, having 120 years of DJI historical data, we can try to determine the effect of this cycle on DJI behavior. To do that, set these options in "Terms":
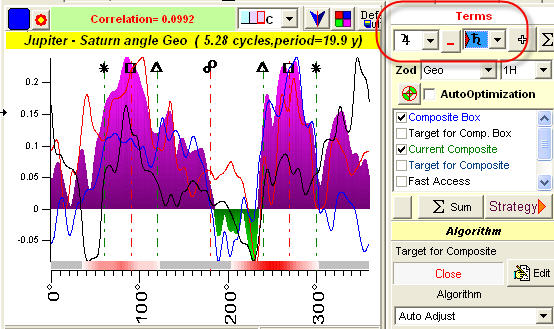
Here you can see the DJI movement (Y axis) in respect to the angle between Jupiter and Saturn (X axis). This is Jupiter-Saturn portrait of DJI:
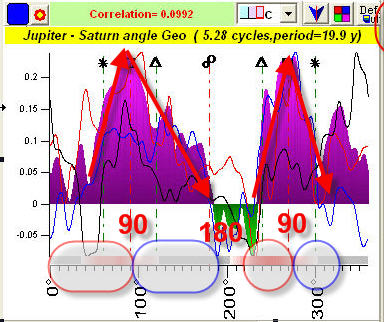
You can select four major periods on this diagram.
Period #1 - the angle between Jupiter-Saturn is 50deg-90deg; the market is growing during this period.
Period #2 - the angle reaches 90 degrees (square aspect); the market changes the trend and follows the downtrend tendency. It reaches the bottom on 180 degrees.
Period #3 - the angle is 230-270 degrees providing the DJI more opportunity to grow. The peak is reached at 270 degrees (another square aspect).
Period #4 - 270-310 degrees; a fast downward movement.
This technique gives us a general outlook of this cycle. The most important conclusion here is that this 20 years cycle exists. However, if you truly decide to make a forecast based on astrocycles, you need to consider other cycles as well and then pick up the most important cycles only. This issue will be discussed in the next lesson.
Now, some technical notes regarding Composite diagram:
Analyzing any astro cycle, always keep in mind the period of the analyzed cycle. The program displays this information here:

You see here the period (19.9 years) of the analyzed cycle and a number of cycles considered (in our example, we use 6.11 full Jupiter-Saturn cycles).
Pay attention you can analyze many zodiacs here:
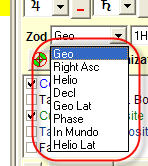
If you research the long term cycles (like Jupiter-Saturn 20 years cycle), maybe it makes sense using Heliocentric zodiac. Geocentric zodiac causes many irregularities due to the annual retrograde motion.
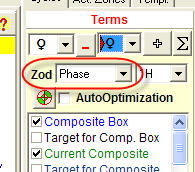
Also I highly recommend to apply Phase Zodiac:
I have found that practically all financial instruments are affected at least
by one phase cycle. I recommend using single planets phase cycles, like Moon phases 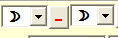 ,
Mercury phases
,
Mercury phases  etc.
etc.
I believe that this table of periods for planetary phases is very useful, you may would like to remember it:
| Planet | Phase period | Geo period | Helio period |
| 365.3 d | 365.3 d (i.e. Earth) | ||
| 29.5 d | 27.3 d | ||
| 116 d | 365.3 d | 88 d | |
| 584 d | 365.3 d | 225 d | |
| 780 d | 687 d | 687 d | |
| 399 d | 11.9 y | 11.9 y | |
| 378 d | 29.4 y | 29.4 y | |
| 370 d | 84 y | 84 y | |
| 367.5 d | 165 y | 165 y | |
| 366.7 d | 245 y | 245 y |
The most used cycles are marked by the red font.
There are a lot of different astro cycles out there. I often been asked how select the best cycles. Let us say that you have decided to analyze some new financial instrument (FTSE100). Start with Spectrum diagram - to get a general outlook on the cycles' structure. As you can see below, there are 2 peaks marked (among the other ones),114 and 767 days cycles:
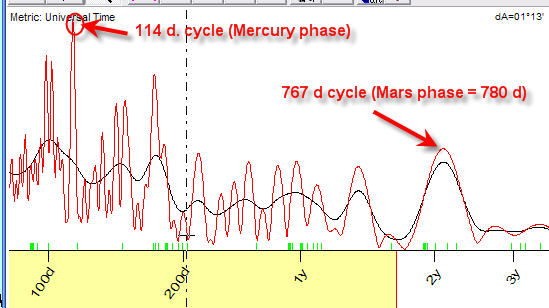
It is very possible that these cycles are connected to some astronomical cycles (see the table, I chose Mercury and Mars phases). This way you can reveal the major players for this market.
However, there is no proven method yet of choosing the appropriate cycle
for some financial instrument. It is a brand new field for research on markets
and economics (mostly because of the absence of proper tools for the analysis,
including a proper software; this situation is changing now, due to the efforts
of different researchers and TS users among them). So, now we can only try
different planetary combinations, using different types of Zodiac in attempt to
find a good correlation to available historical data.
It is a very interesting thing to see how the stock market responds to different astro
cycles. Very often the
"pure" astronomical cycles are much stronger than the well known to
economists
Annual cycle. If you study the financial data attentively, you will find that very often the strongest
cycle is not the Annual cycle, but a cycle that is close to it. As an example, for S&P500
index, one of the strongest
cycles is 403-days cycle (it is found by Spectrum analysis). Why is it so, why
is it not the Annual
cycle? No answer now. We can only assume that the S&P500 index shows a very
strong reaction to Jupiter synodic cycle (which is 399-days cycle). So,
right now we are in empiric stage of the market cycle research, we simply
collect and record the cycles that have some effect on different financial
instruments. The more financial
instruments and data we analyze, the more we know about the astro cycles
affecting them.