Lesson 8
Composite - playing around
In this article some nuances of Astronomy module usage will be explained.
Working with harmonics
For most financial instruments, we cannot use cycles of the slowest planets, because we have not enough price history data to make a conclusion as to how these cycles work. As an example, consider one of the longest historical data set available: Dow Jones Industrial index from the year 1789 till now. (The data before 1885 have been developed by Foundation of Cycles Research and Bill Meridian.) In total, we have 218 years of historical data to research the American stock market. Unfortunately, we cannot use the Neptune cycle for these data as Neptune's 165-year period is too long compared to the available data. For a proper research on Neptune's cycle, we need at least 500 years of price history. However, there is a way out. We may apply some kind of analogy: let us assume that the impact of Neptune in Aries is similar to its impact in Cancer, Libra and Capricorn (the signs of Cardinal Cross). The impact of Neptune in Taurus is similar to Leo, Scorpio and Aquarius, etc. In other words, we research the impact of a slow planet going by crosses.
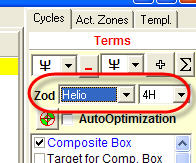
To research this cycle, set 4H harmonics:
If our goal is a long-term forecast, it is better to work with Heliocentric Zodiac( to exclude the Annual retrograde motion). This is the composite for Neptune 4H cycle:
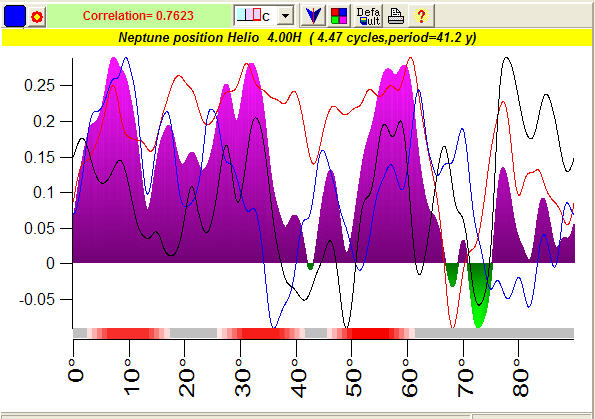
As you see, there is some consistent pattern (split criteria) there, and this cycle provides a good projection line (see correlation criteria).
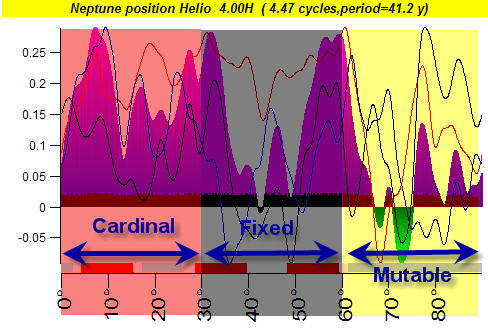
Do the same thing to other crosses. This diagram shows Neptune's impact according to its position in different crosses (cardinal, fixed, and mutable):
Consider another popular harmonics, 3H. It allows us to estimate the planetary effect according to their positions in different elements. For example, analyzing 3H Sun composite for gold prices in 1975 - 2007, we have received this diagram:
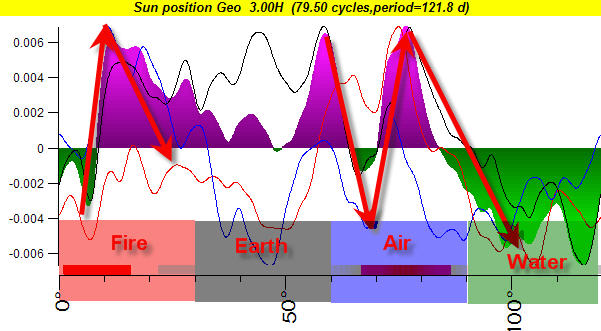
It gives us some hints regarding gold prices, like when the Sun is in Fire signs (Aries, Leo and Sagittarius) the gold price goes up first two weeks and then it goes down. So we only need to know when the Sun ingresses the Fire signs (it happens around March 21, July 23, and November 22).
Another possibility is the usage of fractal harmonics. For example, the Moon phase cycle is 29.5 days. Let us assume that the Moon may affect some market with 59-days periodicity. In other words, we assume that the cycle in question lasts two Moon phase cycles. To create such kind of a cycle, set this option:
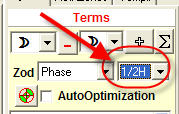
It means that you will see the 720-degrees scale instead of usual 360:
The diagram represents how the market moves while the Moon makes 2 full cycles (i.e. 720 degrees).
You can work with cycles of single planets and/or you can research cycles that are based on the angle between two planets. Just a note: for gold prices, the angle between Venus and Mars is important:
Transit Line
When you click at any place of the price chart, the vertical line appears on the composite chart. That line corresponds to the planetary position:
In other words, you can see at any moment of time how this composite works at that moment.
Also look at the chart attentively; there is a horizontal arrow as well. This arrow indicates the direction of the movement of this planet.
Look at this composite curve for Mercury position: left horizontal arrow means that Mercury moves retrograde for the chosen data:
Active Zones
The Active Zones feature allows you to get the answers to questions like this one: "Has the angle between Mercury and the Earth heliocentric any effect on DJI turning points?".
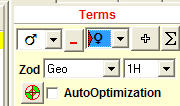
Let me show how it works for DJI data from the year 1885 till now. Download the data and set these options:
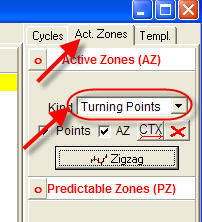
Click on "Zigzag" button to set the minimum swing for zigzag (that is used to calculate turning points). Let it be 15%.
Now you can see an additional panel with red and blue stripes on the composite diagram:
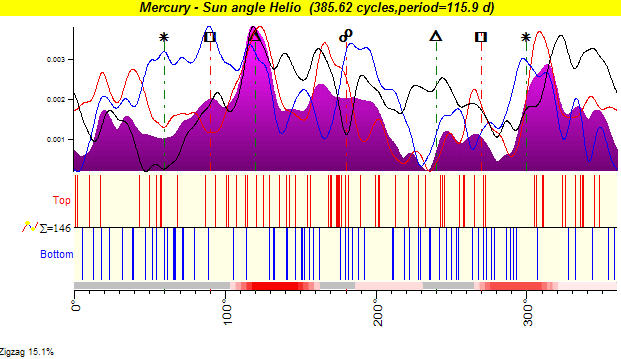
These stripes correspond to the top (red) and bottom (blue) turning points in respect to the angle between Mercury and the Earth helio (in heliocentric system, we use the Sun sign to designate the Earth).
As you see, there is a cluster of red stripes around Mercury-Earth opposition:
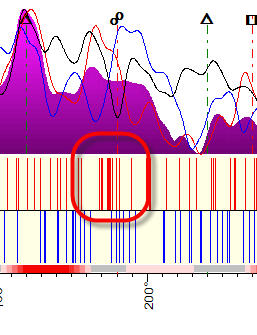
It means that this aspect may cause top turning points.
But you should be very cautious while working with this feature, as planetary motions are irregular. For example, if you would research Mars-Sun geo cycle, these stripes are distributed like this:
There are practically no points around the opposition, but this effect means nothing as it is caused by irregularity of Mars's motion.
Another application of active zones module gives the answers to the questions like this one: "When within a year DJI may make a big move?". It is easy to answer this question, simply set these options in "Active Zones" tab:
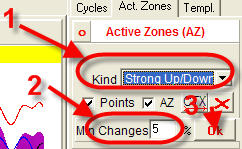
You will get this diagram for the Sun composite:
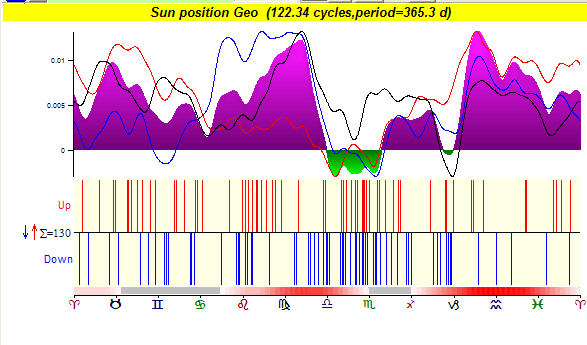
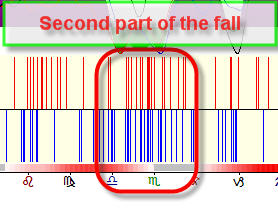
The red/blue stripes correspond to big up/down points in respect to the Sun position. This diagram definitely shows that the big movements are more probable in the second part of the fall:
All these features allow you to obtain the full astro portrait for any financial instrument. Next lessons will be devoted to calculation of the projection line based on these cycles.
Beware of artifacts
When we do a research of astro cycles, we should always look at the results attentively; not only on results, but as well at the hypothesis that we explore. We should do it because of artifacts. The existence of just one artifact can destroy the results of many hours of research. What is an artifact? (My wife insists that I need to explain more clearly what the artifact is. Of course, I can cite Wikipedia. But - you can do it too, can't you? She gives this simple explanation: Imagine that you are in downtown; there are a lot of women in silk clothes. Can we assume that women prefer silk? No! - because it is July. Once again, this is my wife's explanation; I am not sure that I know the difference between silk and - whatever it is.)
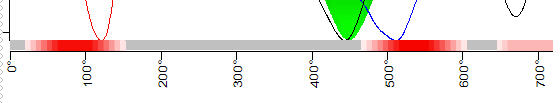
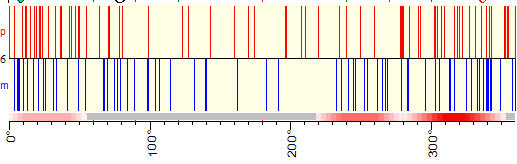
Let's look at one example. We calculate the active zones for Mars-Sun geocentric composite, here they are:
As you see there are a lot of vertical stripes (i.e. turning points) around the conjunction and practically no stripes around the opposition. Does it means that turning points take place more often when Mars conjuncts Sun? Yes, it does! But it happens not because this aspect works this way, it simply means that the conjunction aspect lasts longer than the opposition for Mars-Sun aspect. Look at this diagram with the conjunction together with the opposition:
In other words the active zones here simply represent the irregularity of Mars movement. This effect appears very often, For practical use if we have dense zones for BOTH tops (red stripes) and bottoms (blue stripes) with high probability it means that we deal with planetary irregularity effect.
Target - what forecast
"By default" the program uses Relative Price Oscillator to calculate the projection line. This is obvious - to reveal cycles we need to eliminate trend component from financial data. Another important question is: "what period of oscillator we should use".
Let's create Annual cycle, the program shows the period of oscillator here:
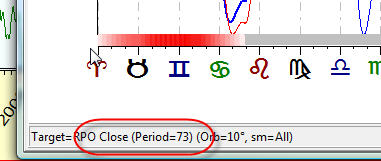
In other words, to calculate the 365 days cycle the program uses the oscillator with period 73 bars.
If you analyze Moon phases cycle (period is 29 days) the program will use shorter oscillator with period 5 days only:
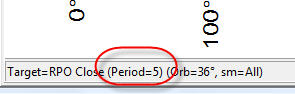
So the program uses long term oscillator to to reveal long term cycles and short term oscillators to reveal short term cycles.
As an example at the picture below you can see two oscillators, red - oscillator that has been used to calculate Sun cycle and blue - to calculate Moon phases cycle:
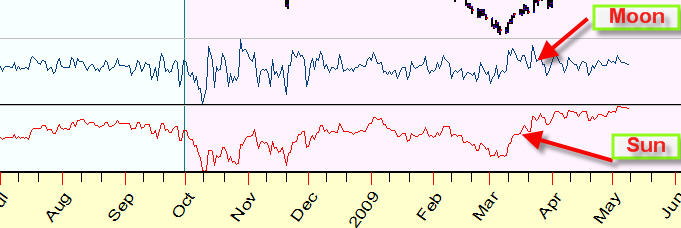
If you would like to smooth the projection line we recommend to set ON this option in "Target Function" tab:
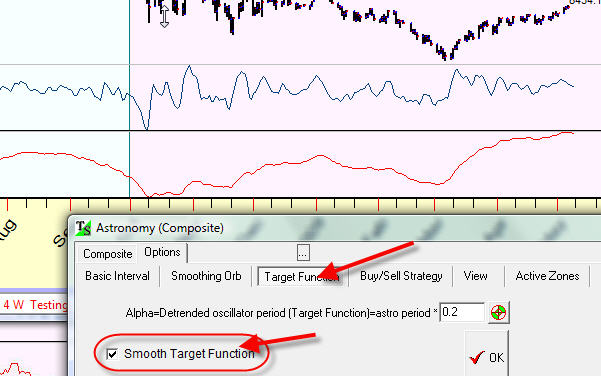
You see the red and blue lines became smoother now.
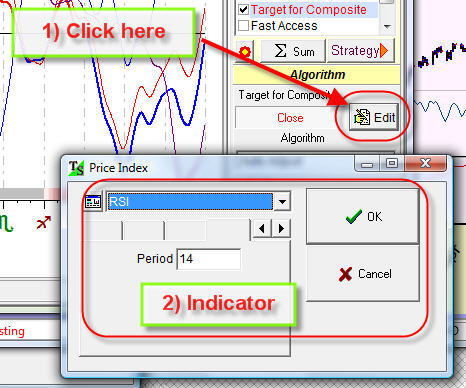
If you plan make projection line for non trend indicators, say MACD, RSI, ADX, Volatility etc. you need to click this button and set the indicator you want to research:
More information about this issue you can find here: http://www.timingsolution.com/TS/Mini/8/index.htm
One more parameter is "Alpha" 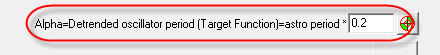
This is simply coefficient between target oscillator period and astro cycle period. Like for Sun 365 days cycle program uses oscillator with period
365 x 0.2 = 75 dyas.