 .
.Lesson 9
Composite Box - Projection line
Fast introduction
This is one of the most impressive technologies in Timing Solution. The composite module allows you to construct the projection line based on several astrocycles.
As an example let's create together the projection line based on three astro cycles: the Sun cycle (its other name is Annul Cycle), the Moon Phases cycle and the cycle of Mars phases.
We do it for Dow Jones Industrial from 1885 till April 2009 year.
After downloading the data, click "Astronomy"
button: .
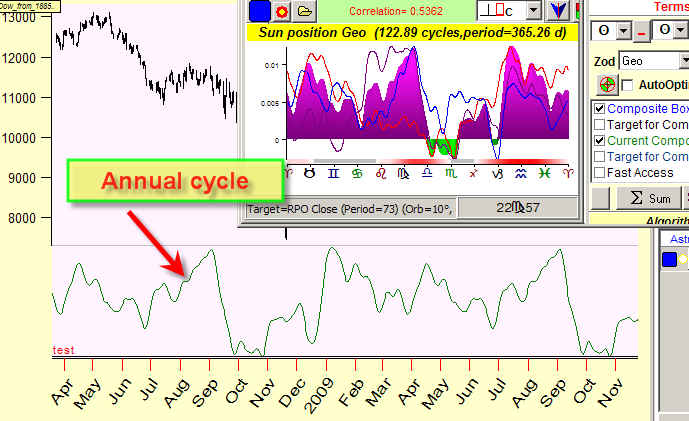
Immediately we get the Annual cycle (Sun-Sun geo), it is shown on the Main screen:
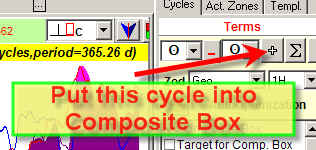
Now, put this cycle into the "Composite Box" clicking this button:
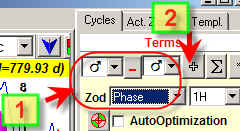
It is there, and we can repeat the procedure for other two cycles. First calculate the Moon's phases cycle (the Moon - the Sun in Geo) and send it into "Composite Box":

Finally calculate the Mars phases cycle (Mars-Mars phase) and send it into "Composite Box" as well:
Look at the Main screen now. You can see two projection lines there:
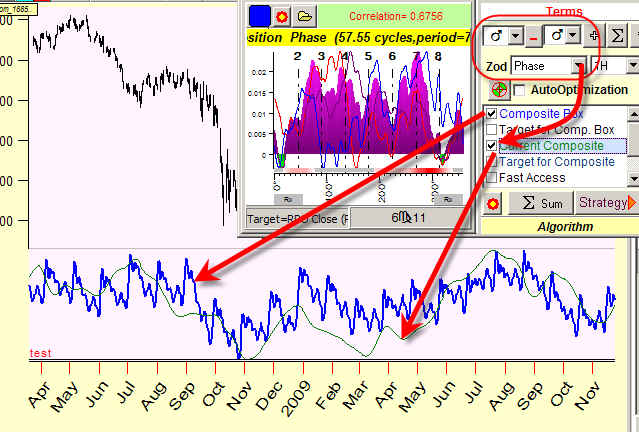
One of them, the blue line, corresponds to the "Composite Box" projection line, i.e. this is a superposition of three astro cycles (that we have created a minute ago). The other (the green line) is a projection line for a single cycle. It is called "Current Composite", and it is the last cycle added to the Composite Box. For our particular example, the "Current Composite" corresponds to Mars phases cycle.
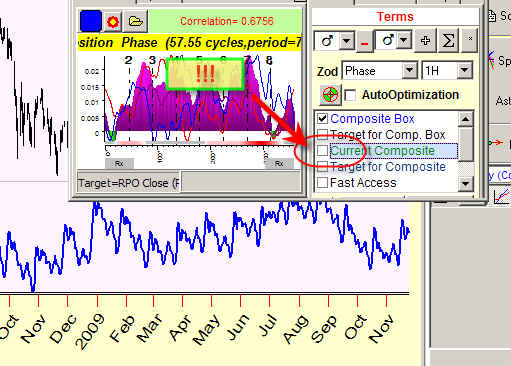
We can hide "Current Composite" and display only Composite Box's projection line. Do it this way:
Now look at "Composite Box" window (the program displays it automatically when you click "+" button):
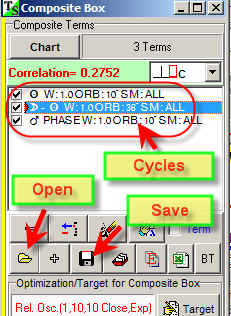
You can disable/enable any cycle there, save your work into some file or open a previously created and saved variant.
If "Composite Box" window is closed, you can open it any time clicking this button:
Simple backtesting
The most interesting question is how this combination of cycles really works in the future. Remember that we always can obtain a good projection line that perfectly fits to price movements IN THE PAST (it is just a test for your tools).
Timing Solution provides you "no future leaks" technology that allows to get the answer to the question above. Let's do it together:
1) Set Learning Border Cursor (LBC) on some date in past, Let it be the beginning of February 2004:
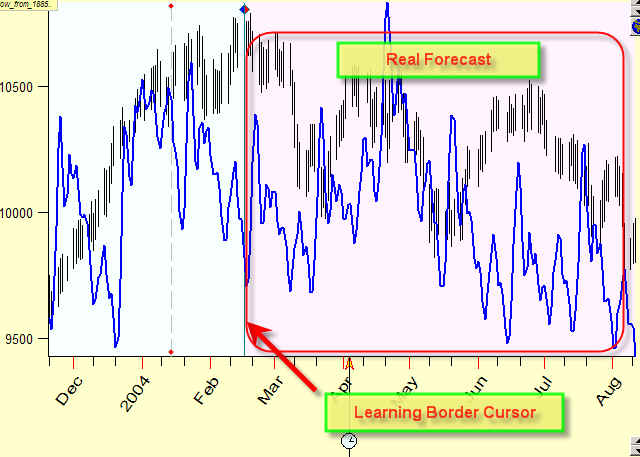
2) In a moment the program recalculates the projection line.
3) The data beyond LBC (February 2004) represent the REAL FORECAST. "Real" means that the program "does not know" the price history beyond LBC (though you can see it on the screen). It does not use the price history after LBC. The program is "blind" in respect to the future. (If you choose some other position for LBC, you start a new case, and now the program uses the data before LBC to generate a projection line AFTER (BEYOND) LBC.)
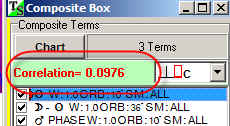
4) We recommend to vary LBC position several times to figure out how the projection line works after LBC. Look at the "Composite Box" module, it shows how the Composite Box projection line fits the price. The correlation coefficient tells you that; "by default" it is calculated using the price history after LBC:
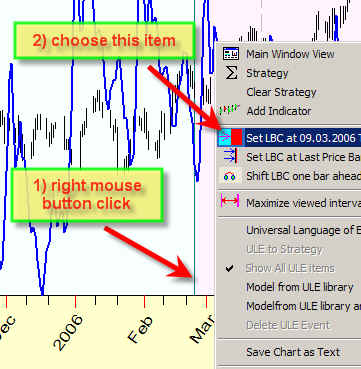
5) Remember that you can set LBC at any place clicking RIGHT mouse button and choosing "Set LBC at ..." item:
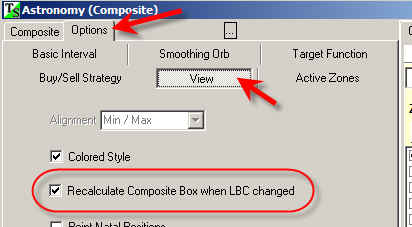
Also in Options->View, set this option ON:
The most important cycles
This is a very important and the most difficult question - what cycles are more meaning than others.
I always start with the Annual cycle:  .
.
Then I check the phases of inner planets (Mercury and Venus):  .
.
After that I check phases of Mars, Jupiter, and sometimes of Saturn. The phases of slow
planets Uranus, Neptune and Pluto are very close to the Annual cycle, so I do not use
them.
If you have 30-40 years of price history, I recommend to check Jupiter cycle, it is
close to a well-known Juglar cycle.
What cycles are better to use? There is no simple answer. I recommend to look through Lesson 7, you can find there some useful information.
Let me show one example. The downloaded price history is Dow from 1885 year, and LBC is set at the beginning of the year 2008. It seems to me that for the whole year 2008 Mars heliocentric cycle has worked very well. See yourselves (a red curve):
During 2008 and in the beginning of 2009, the correlation between this projection line and DJI is 0.7099 - this is a very high correlation. The analyzed interval (2008 - the beginning of 2009) covers a bit more than the half of Mars Helio cycle's period.
Does it mean that Mars Helio cycle always works for Dow?. The answer is NO! The time interval 2008 - the beginning of 2009 - is too small to make this conclusion. The random mistake is too high here.
To demonstrate this to you, let us set the LBC in the beginning of the 1999. The program uses now 10 years of price history to calculate the correlation between DJI and our projection line; it is more than 5 Mars Helio cycles:
You see that the correlation for Mars Helio cycle is negative now. In other words, for the last year Mars cycle works very well, though it did not work well for 10 last years.
Does it mean that this cycle is no use? Not either. May be this cycle has started to be involved in the last year, and before that it has been inactive. In other words, this (and many other) cycle is not providing the same results always, it really works from time to time. There are more persistent cycles, they just work most of the time. So I recommend to start with the persistent cycles.
This is one working example. Let's consider Mars phase cycle:
LBC is set at the beginning of 2008
Looks like this cycle works in 2008 year. Can we get more confirmation regarding the workability of this cycle?
Yes, we can. Set LBC on the beginning of 1999. You get this:
The projection line is still working, correlation 0.2 is good. 10 years cover about 5 full Mars phase cycles, it is enough to evaluate the cycle's importance.
In other words you vary the LBC and watch how this cycle correlates to the price chart. The whole procedure looks like this: you click the right mouse button on different places of the price chart and watch how the correlation coefficient changes:
If this cycle "passes" this examination, consider it as a working cycle and put it into your "Composite Box"
"Garbage in - garbage out"
Be very picky while choosing the cycles. Do not use too many cycles in your Composite Box, use only several the most important ones. Adding more cycles that are non working, we add more Chaos to your model. In this case, you should not be suprized getting nothing in the end.
I also do not recommend to use "Auto selection" button:

It picks up dozens of astro cycles. Usually the projection line based on these cycles works good in the past and does not work in the future. This button appeared in one of the previous versions of the software; at that time I thought it might be useful. Then practice and research showed its useless, I even deleted it once, but still some users wanted to see it. So, it is in the program, though I do not recommend using it.
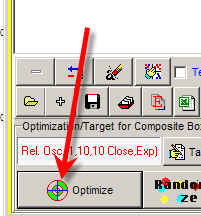
Optimization
There is the additional feature "Optimization" in the "Composite Box":
There are four possible optimization algorithms in the program:
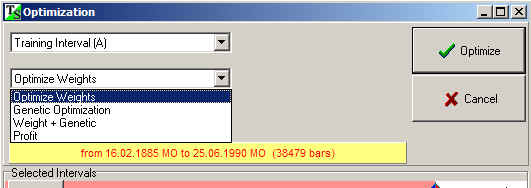
Weights optimization finds the best weights for all cycles that are present in the Composite Box. Genetic optimization finds the best combination of these cycles, it disables cycles that do not improve the projection line (in other words, the projection line is not changing with or without those cycles).
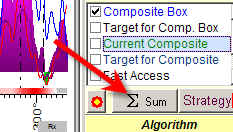
If you conduct the final projection line, i.e. the projection line that is based on ALL available price history, click this button:
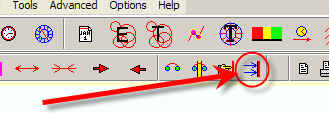
The program will set LBC on the last available price bar.
Also I recommend these classes:
about correlation - see here
about non future leaks technology, training and testing intervals - see here