Lesson 2.
Simple Trading Strategies based on ULE
You have learned in the previous lesson how to deal with the factors that might have an impact on the stock market. And you have learned how to make conclusions, at least regarding their quality. Now you can add some real digits to your conclusion. It is important as we can use this knowledge in real trading. Let's consider one example:
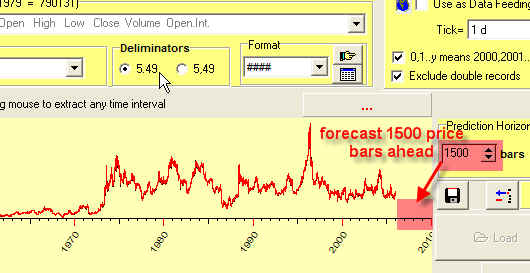
#1: This is the corn prices file from 1949 to 2006. When you download this data, set the limits to the forecast horizon; suppose it is 1500 bars:
Thus we inform the program that we would like to make the forecast for corn prices for 1500 price bars ahead.
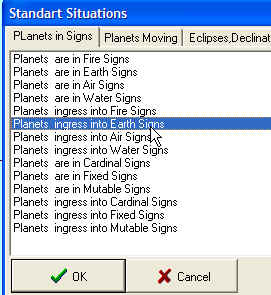
#2: Now do the same study as discussed in the previous lesson. I have found that the price goes up a week before the Sun ingresses the Earth signs (Taurus, Virgo, Capricorn). You can set this event in Events Editor this way:
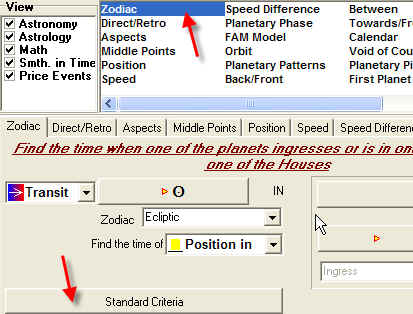
and chose this option:
#3: Calculate the Efficiency Test clicking on this button: ![]()
It looks like this:
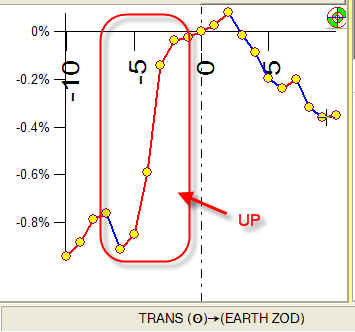
It definitely shows that the price goes up more than one week before the Sun ingresses the Earth signs.
#4: Let's consider the trading strategy: "buy 6 days before the ingress -> sell at the day of ingress":
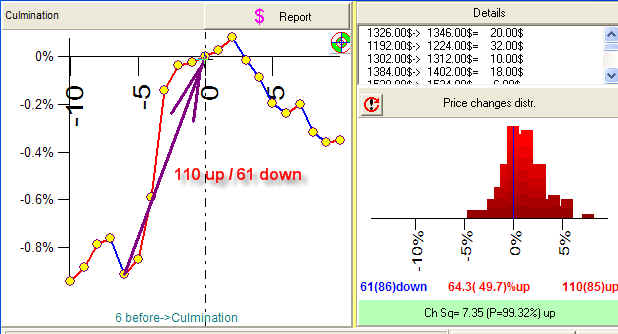
If we would do that, this strategy would give us 110 winning trades against 61 losses. Not too bad, but let's try to improve these results.
#5: Click on this button:
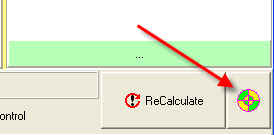
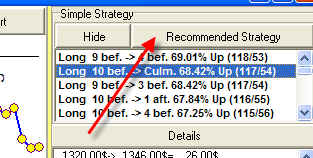
and you will see the best strategy for corn:
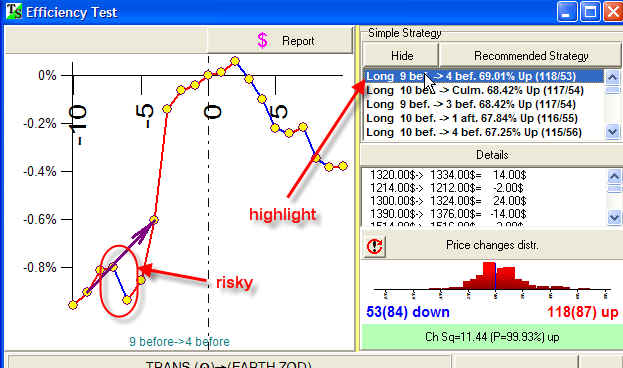
The best strategy is "buy 9 days before -> sell 4 days before". It gives us 118 winning trades against 53 losses. However, the Efficiency Test shows at least one strong down during one of these days. So, we can follow this strategy though it is a bit risky. Let's diversify this risk, putting a sell signal further from this risky point. Highlight the next item in the list:
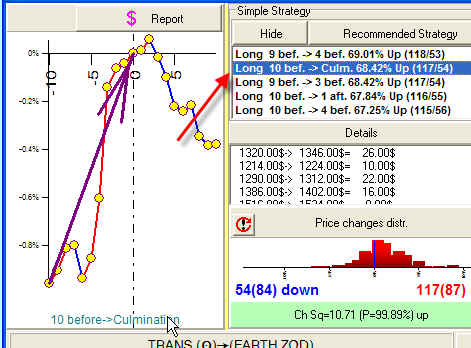
We buy corn 10 days before the Sun ingresses the Earth sign and sell it exactly at that day. This strategy promises 68% winning trades.
I called this model "a simple strategy" because it cannot be considered as a trading system. This strategy provides trading signals only once in 3 months. Any other time you cannot do trades. So, the model based on only one astronomical factor has no practical sense. In reality, we have to consider hundreds of these single factors.
However, you can memorize this info and use it when the time is appropriate. Do the next step - keep this info in your trading calendar.
#6: Click this button:
You will get the list of buy/sell signals for the future (beyond available price history):
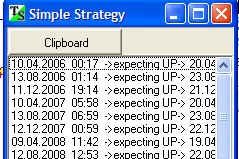
This is the power of astro trading: if you know (or find out) the single factors that are working for your financial instrument, you know days, months and years ahead when they will occur.
#7: Timing Solution has an additional tool to visualize the risks. Look at the up/down stripes in the bottom part of the Efficiency Test window:
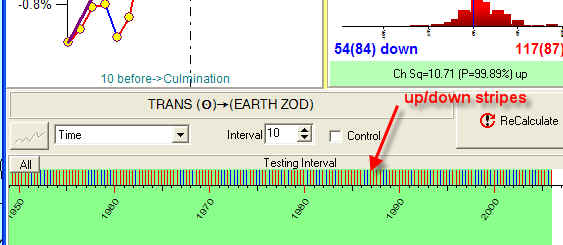
The red stripes correspond to upward price movements, the blue ones indicate downs (with the strategy "buy 10 days before -> sell when ingress"). Thus we can see how winning and losing signals are distributed in time, how they are balanced. If you prefer long positions, you would like to see here more red stripes. If you do short trades, you would like to see here more blue stripes.
Look at this scale:
In the year 2001 and the beginning of the year 2002, this strategy would provide us 4 losing signals in row, i.e. the price went down. These stripes allow us to see the periods when the old market pattern does not work and the new tendencies appear.