Lesson 3
Working with ULE
I would like to start this class with one example that proves to non believers
that astronomy cycles have an impact on the stock market. I will conduct it in an
academy
manner (how I was taught in the university). It means that the arguments for non
believers are expressed by a dry language of numbers and statistics. The math related issues will
appear in italic font to make this reading easier for those who would prefer to skip
these parts and still be able to get the
general idea.
The most beauty of this approach is that it gives you the additional information
regarding possible ways of price movement; this information can be prolonged
into the future as far as you need. This not a suddenly occurring
fundamental factor which comes from the News and mixes all cards and
nobody knows when this factor will come up again. This is not an annual cycle
either - that thing is well known to anybody knows. This is something special,
only our users may know it.
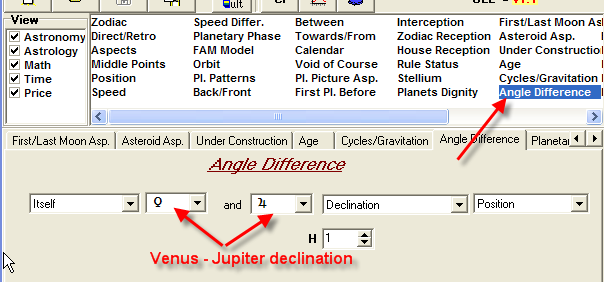
I state that the difference between Venus and Jupiter declination has its impact on Dow Jones Industrial index, and this fact is proven with the 98% probability. This fact has been tested for DJI data from 1885 to 2006 (it covers more than 120 years of DJI history).
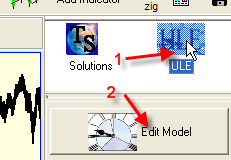
The declination shows how far the planets are located from the Equator's plane. Let's run the ULE Model Editor:
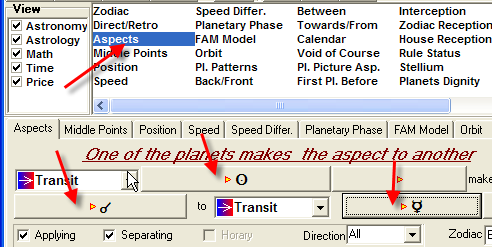
Fill out the form this way:
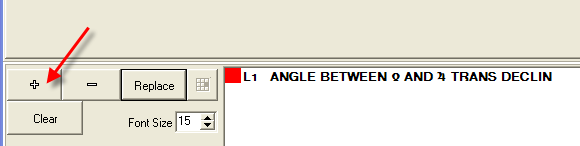
Add this event to Events Box clicking "Add" button. If you have had some events in the Event Box already, click "Clear" button to clear it:
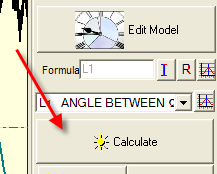
Now go to the Main Screen and click "Calculate" button:
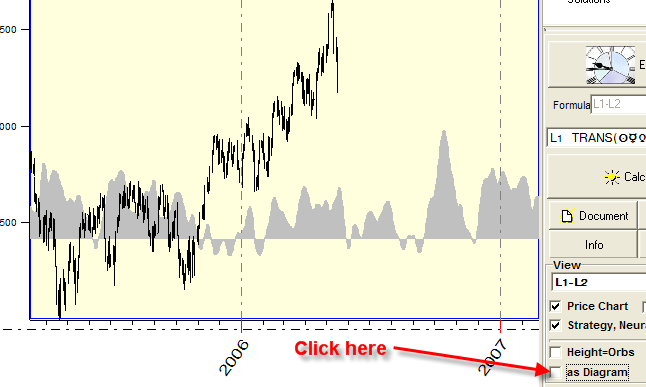
Look at the screen now:
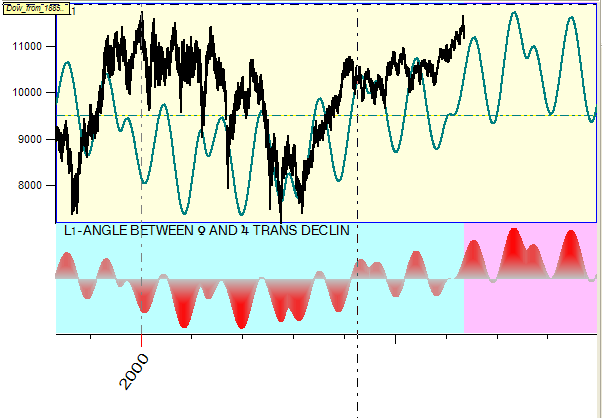
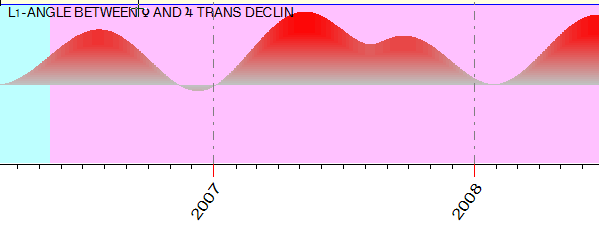
This is the picture for the difference of Venus - Jupiter declination for the last 8 years and the next 3 years (it is written in June, 2006). I remind you that manipulating the mouse you can choose any piece of the chart to see the details.
For 120 years DJI history, this diagram looks like this:
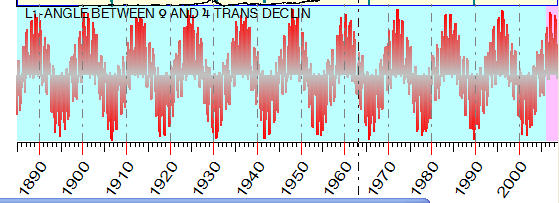
I state that this diagrams reflects the movements of DJI index, it describes 9.5% of movements.
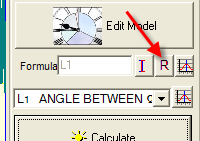
Now I show how to check how this diagram fits to the DJI index. Click this button in the Main Screen:
You will get this window:
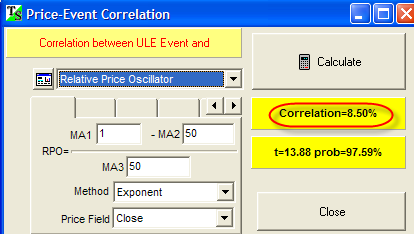
What the program does? It calculates the correlation between the price
oscillator with 50 bars period and the Venus-Jupiter declination diagram.
The line ![]() shows that the correlation between the price and Venus-Jupiter declination is
8.5% (See in doc the explanation regarding the correlation coefficient).
Practically it means that we can use this diagram to predict the price movement.
But we need also to keep in mind that this indicator explains 8.5% of price
movements only
shows that the correlation between the price and Venus-Jupiter declination is
8.5% (See in doc the explanation regarding the correlation coefficient).
Practically it means that we can use this diagram to predict the price movement.
But we need also to keep in mind that this indicator explains 8.5% of price
movements only
To provide the statistically complete verification of this fact I used the t-statistic criteria (Student distribution). For correlation coefficient 8.5%, sample size = 33.000 price bars we have t=13.88. It means that with probability 97.59% this fact is not occasional. Also this correlation cannot be explained by seasonal artefacts, because the average period for this cycle is about 400 days and it is pretty irregular.
To be more practical, we need to keep in our minds just this diagram:
It is not a forecast, it is a portrait of one of the players that pushes the ball 8.5% of the total game time.
A la Bradley Model
Now we discuss something that is one of the true treasures of the financial astrology. I refer here to Donald Bradley and his work. I am really fascinated by the great ideas that he has been able to express in a such condensed form. The most amazing thing is that he has done all his calculations and diagrams manually, before the era of total computerization. I can only guess what he would be able to do nowadays.
Anyways, let us try to follow the steps that Donald Bradley would perform if he would have Timing Solution software.
We will look at the aspect of conjunction between the Sun and Mercury. Using ULE, you can record this event this way:
Look at the Main Screen to see how this aspect "sounds" in Time:
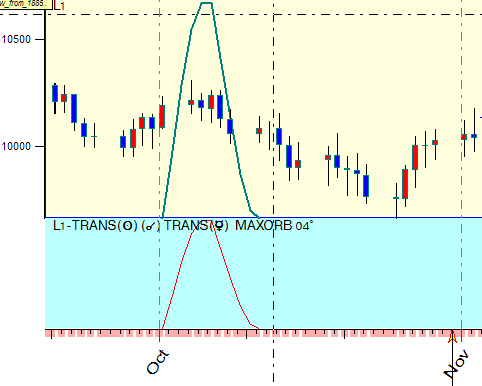
This diagram shows the degree of the strength for this aspect. The aspect reaches the maximum of its influence at the culmination:
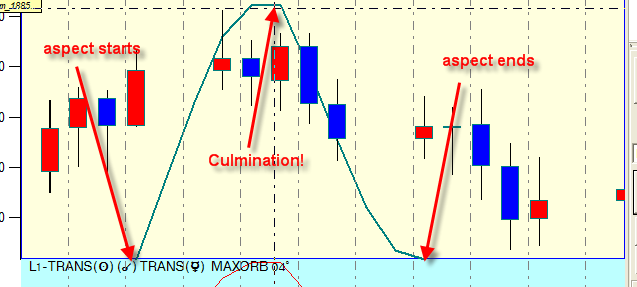
So you can see all phases of this aspect.
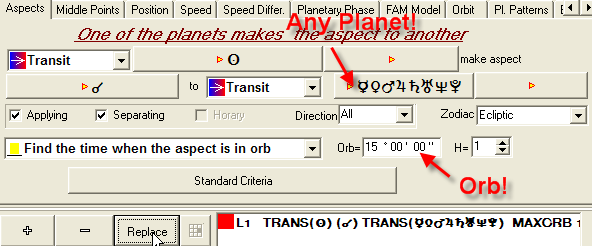
Let's make our model a bit complicated and consider the event: "the Sun conjuncts ANY planet (except the Moon) with ORB=15 degrees". Set the form this way:
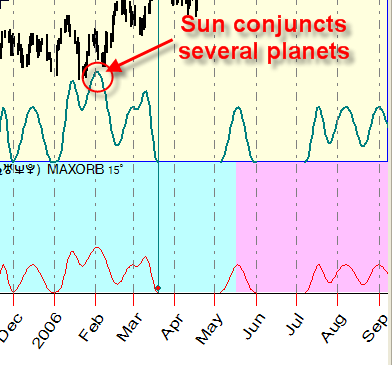
This event sounds more interesting, because sometimes the Sun makes the aspect to several planets at the same time (like in the beginning of 2006):
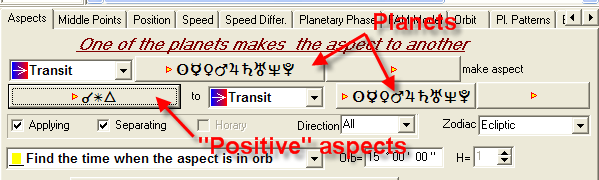
Now we are ready to create a more complicated event: "Planets make positive aspects between themselves" (here we consider as the "positive aspects" conjunctions, sextiles and trines though for conjunctions this statement is not 100% correct):
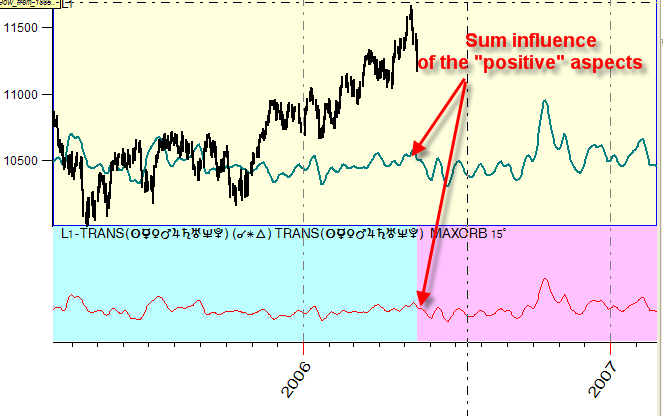
This event is much more interesting:
Now we are close to our final goal. Let us create the event "Planets make negative aspects to each other" and consider it together with the previous one. Remember that ADDING this event to the "Events Box", click "Add" button, not "Replace":
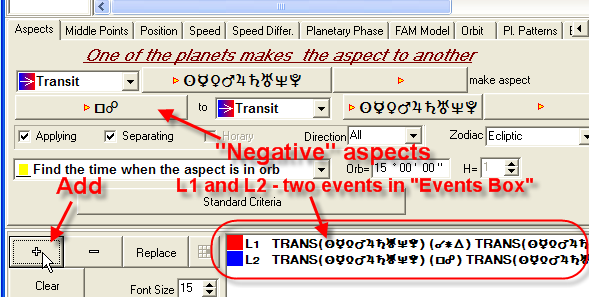
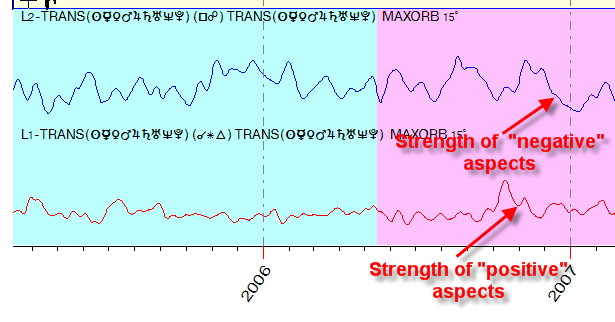
So, there are two events in the "Events Box" now: L1 -Positive aspects and L2- Negative aspects. Let's calculate them:
The final step is to calculate the balance between positive and negative aspects. To do this, you need just subtracting negative (L2) from positive aspects (L1).
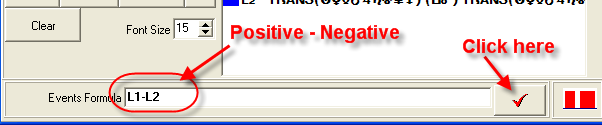
Do not forget to click ![]() button.
button.
Calculate these events:
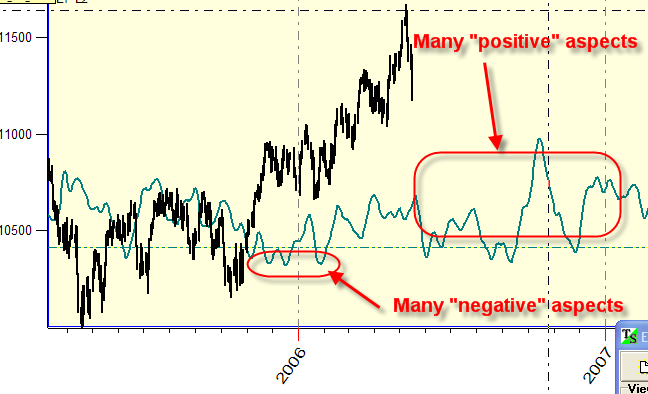
You can see here the balance between positive and negative aspects. The higher diagram the more positive aspects are in the sky, the lower - the more negative.
Clicking this option, you can change the diagram view:
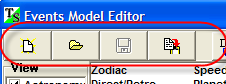
Also you can save this model and open it next time using this set of buttons:
You can create very complicated models with this module. For example you can modify L1 event above using as positive aspects sextiles and trines only, leave L2 as it is (for negative aspects of square and opposition), and add two new events: L3 - a conjunction with "good" planets (the Sun, Venus, Jupiter, Neptune) and L4 - a conjunction with "negative" planets (which are Mars, Saturn, and Pluto).
ULE provides you fantastic opportunities to try and actually feel the power of cycles - without using any sophisticated modules (like Neural Net). It is a very flexible tool. I would not suggest using Universal Language of Events for forecasting. However, it is a base for any model. To be able to create successful models, you have to know the ULE very well. I have included into it everything that I know at this moment regarding the movement of celestial bodies. The good thing is that ULE is not a closed system. It is opened to new types of events, and can be extended any time.