Lesson 4
ULE - Algebra of Events, Part I
When I was a student, the Chaos theory was very popular among my peers. What we liked the most was the idea that the whole world can be understood as the interaction of events. If we assume that every event is a word, the world is formed by the words' combination (grammar). This grammar was found to be context-dependent. And the fascinating part is that every word (event) changes its meaning according to the context. Speaking differently, our world is formed from events that depend on the context.
In the previous Lessons, you have learned to record the words - astro events. Now, we will learn to read them in the context. The time for grammar has come. Let's go!
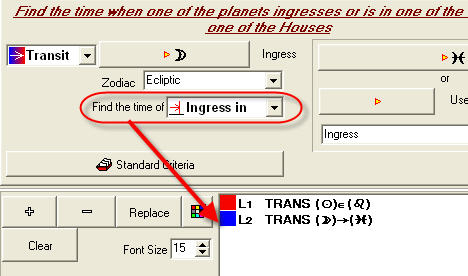
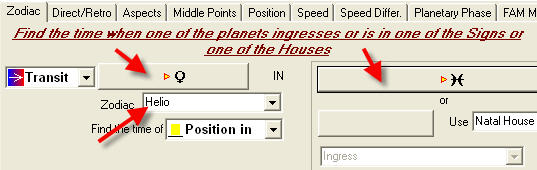
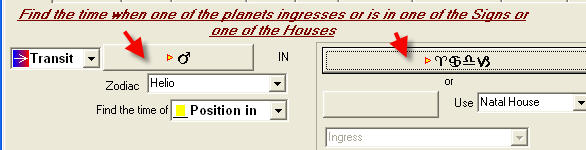
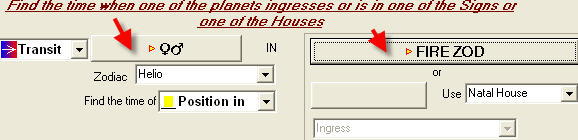
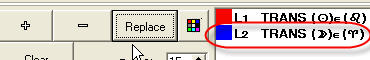
Let us consider this situation: "find what happens to Dow Jones Industrial Index when the Sun is located in Leo and the Moon is in Pisces at the same time". If you have studied the previous lessons, you will easily create two events: L1 - the Sun located in Leo and L2 - the Moon ingresses Pisces:
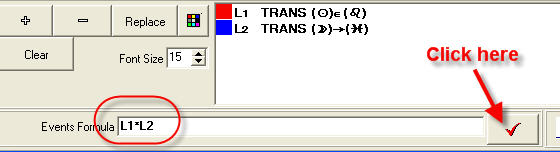
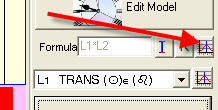
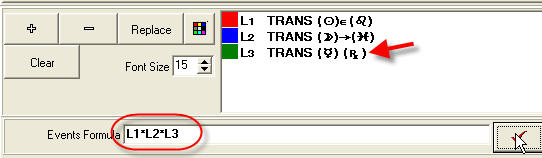
Now remember this rule - if we want two events happening together, we should multiply them. It means that you will type this in "Events Formula": L1*L2 (use * symbol for the multiplication).
Do not forget to click confirmation ![]() button, thus you inform the program that you have finished the typing of the events
formula:
button, thus you inform the program that you have finished the typing of the events
formula:
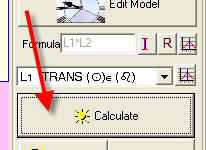
Now go back to the Main window and click "Calculate":
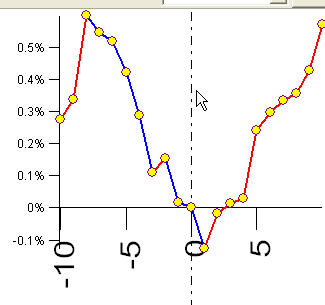
Look at the Main screen now:
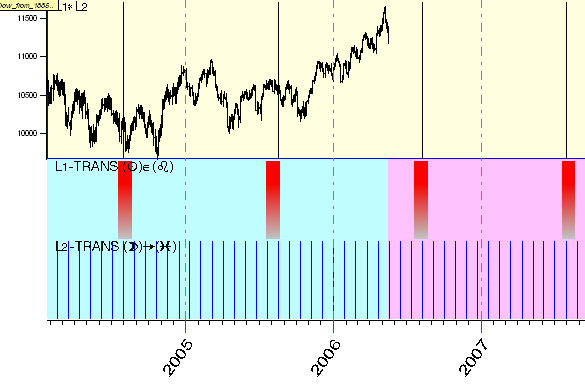
You see the red regions where the Sun is located in Leo and blue stripes that correspond to the moments when the Moon ingresses Pisces.
The black stripes on the upper part of the screen correspond to the moments when the Moon ingresses Pisces while the Sun is in Leo.
Please be very attentive now: we are dealing here with two different kinds of events:
the Moon ingresses Pisces - this is a triggering event; it happens in some
particular moment
of time, just a moment;
the Sun located in Leo - this is the context as this event lasts in time
(takes some time, not just a moment)..
Clicking this button, you can easily calculate the Efficiency Test for this combined event:
It looks like this:
It gives us some clues as to what might be happening to DJI when the Moon ingresses Pisces while the Sun is in Leo.
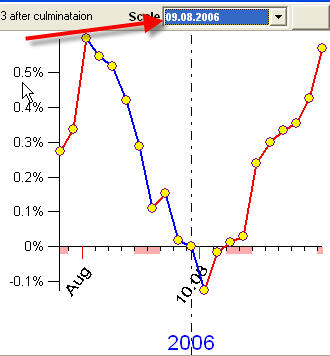
One useful hint: you can display this Efficiency Test in the real time, just choose the culmination date here:
Now lets modify the context event L1, trying different variants for research:
We will consider the event "Moon ingresses Pisces and ...
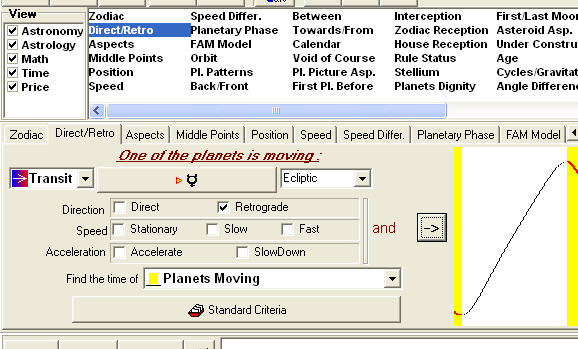
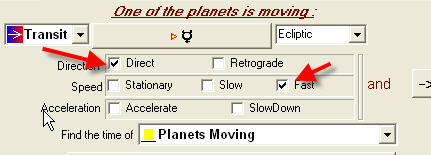
and many many other conditions... We are able to do it thanks to this very powerful tool. We can do it really quickly. What does it give to us? At least, the ability to check any hypothesis or any rumors/hints and then research the actual effect of all these astro factors in different combinations. When you will go to any lecture/seminar, take the laptop with you. While the lecturer will change the slides, you will be able to verify her/his statements. When you read a book, let your computer run the search on the discussed subjects. You will be able to make informed decisions, not just following celebrities. And you will gain your own sense of the markets in respect to the astro events.
Next part of this lesson is advanced, so you can skip it in first reading.
OK. Let us modify our task once again. Now we are looking for the impact of the Moon in Pisces on the stock market in context of the Sun in Leo and retrograde Mercury at the same time.
To the event above, just add one more event, L3 - Mercury is retrograde - and type L1*L2*L3 formula:
You will see at your price chart one more row with the stripes for Mercury being retrograde and different resulting lines (compared to the previous diagram) that correspond to the moments when all three events occur. Then you can calculate the Efficiency Test for this combined event.
At the end I would like to show you how we can solve one very practical task using this ULE module. Assume that the Moon's position in Zodiac has some impact on stock market volatility and this depends strongly on the seasons. Let us do analysis for the Moon influence in August (more exactly, when the Sun is located in Leo).
Create this formula: L1 - the Sun is in Leo, L2 - the Moon is in Aries (not ingress, its position):
In the Main window click "Calculate" button and after that click "R" button:
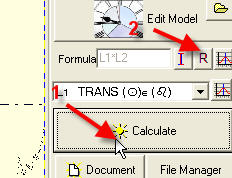
You will get this window:
Here you should define the relative true range (as % (High-Low)/Close) that shows the variation of the price during the trade day. Clicking "Calculate" button, you ask the program to estimate the influence of our event (Moon in Aries + Sun in Leo) on the true range.
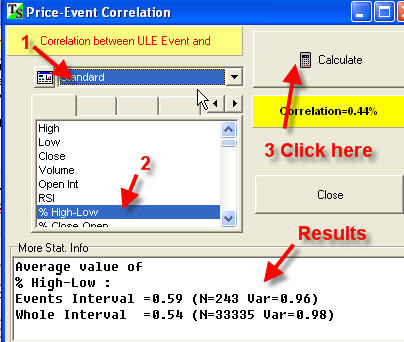
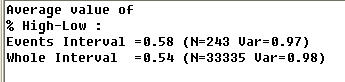
How to read these results (the information window in the bottom part of the screen)? Read this carefully:
Events Interval=0.59 (N=243 Var=0.96) line means that while the Moon is in Aries and the Sun is in Leo, the average value of true range is 0.59%; 243 trade days have been considered to calculate this statistic.
The next line, Events Interval=0.54 (N=33335 Var=0.98), means that
the average value of true range for all available price data (DJI 1885-2006) is
0.54%.
It means that while the Moon is located in Aries, the true range is a bit higher than
the average value (0.54% against 0.59%).
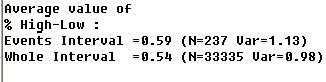
Next step is to modify the formula using the event "the Moon is in Taurus". I have got this result:
![]()
The Moon in Gemini and Pisces seems producing the most quiet periods:
Gemini:
![]()
Pisces:
![]()
On the contrary, the Moon in Sagittarius and Aquarius provides the most volatile periods:
Sagittarius:
Aquarius:
In the following classes you will see how this task can be solved in more elegant way using the Composite module. However this approach gives you the universal tool to analyze situations like the Moon's influence on the market when Mercury is retrograde, the Moon's influence on Mondays and many others.
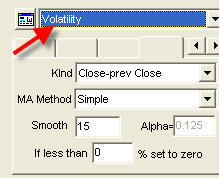
The same manner you can research Volatility index:
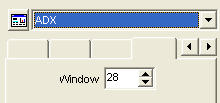
or ADX index exploring the Moon's influence on the trend's stength:
Also you can work with other indicators like RSI, MACD, Stochastic and many others.
I believe that now you will easily explore the New Moon impact on volatility in August. Let it be your homework.