Timing Solution: Forecasting Abilities
Update February 20, 2005
written by Sergey Tarassov
Introduction
Regular Models:
Spectrum
Model: Revealing Fixed Cycles
Fractal Dynamic
Model: Revealing Price Mosaic
Wavelet Model:
Cycles Interaction
Astronomical Models:
FAM Model
Dynamical Model
Auto regression and Japanese Candlestick models: forecast a few days ahead
Multi Scenario Forecast
What is Next?
This publication is devoted to the research project I work on now. Here I introduce three different groups of models that represent three possible approaches to the creation of the models based on different patterns. All calculations are made by Timing Solution program, and this article can be used as a learning tool for those who work with this program.
The research is not finished yet. The Back Testing for different stocks, indexes and models still is going at the moment I write these words. For this particular reason, I put "Update February 11, 2005" into the heading. The content of this article will be changed from time to time, when the new information becomes available. So, while reading this article, please look at the date of the last upgrade. I have decided to share some ideas with TS users now, not waiting till the end of the research project, due to two reasons: 1) there are things that we can discuss now; 2) the proper research will take more time and efforts, I mean years, computer time and the workforce; at least, the new portions of Back Testing for other stocks/futures/indexes and new models are waiting for their turn
This publication starts with the discussion of regular models. Also, some information regarding astronomy based models is provided. The brief discussion of these models as well as the discussion of the third type of the models will be revealed soon. After publishing the brief discussion of three types of the models, I will provide the Back Testing results received for different models and different securities.
The discussion of any model consists of two parts: it starts with the description of the model's core idea and then explains how this idea is designed in the Timing Solution program.
Also, I will appreciate your questions, arguments, ideas that are related to this project.
Before any discussion, some clarification of terms is needed. When speaking about a regular pattern, I mean any kind of regularities (i.e., events that repeat themselves on and on) that might be presented in the price chart and can be expressed by some math equation/equations. Sometimes these regularities are pretty obvious (like the annual cycle), sometimes they are hidden and chaotic at a first glance. In any case, these regularities are attributed to the analyzed process as opposite to astronomical models where the analyzed process is compared to some outer phenomena. Auto regression and Japanese Candlestick models form the third group - because these methods do not produce the projection lines, they are able only to forecast several price bars ahead.
Spectrum Model: Revealing Fixed Cycles
Core idea: This is one of the oldest approaches to market analysis developed by Joseph Fourier in early 1800's. Its main idea is that analyzed processes can be expressed by one or another mathematical equation (i.e., a math function) and we can represent almost any function as a superpose of sine and cosine waves. As an example, look at the sum of two sine waves with periods 300 days (red) and 510 days (blue) respectively:
This approach is based on two
assumptions: a) any process (and the wave associated with it) is considered
ideal and ever-lasting; it means that the wave goes to infinity unchanged; b) we
deal with the linear combination of waves; it means that any resulting
wave is a simple sum of its components. In the example above, the resulting
function contains of 50% of 300-days wave and 50% of 510-days wave.
This was the idea humans believed in early 1800's. They considered the Future as
something that can be determined by the laws settled in the Past. The analyzed
process was considered as a standing-alone and following its inner rules. The
only problem for the researcher was to reveal the correct laws that describe
this process and its future (i.e., to find the right equation for the process).
It was the way of the science (and technology as well) during last 200
years. It is still applied nowadays and can be applied to the market analysis.
How Timing Solution deals with this idea: Let us show you now how the key waves/cycles can be revealed and how to create the forecasting model based on these cycles. The idea is very simple: instead of studying the process of price changes for the stock and searching for the equation, we extract the most important cycles by methods of the spectrum analysis. It is pure math operation, and we can trust its mathematical accuracy. Then these cycles are used as inputs for the Neural Net, to create the forecasting model.
It is very easy to do in the program. Download the price data that you are researching, run the Neural Net module and define inputs clicking this button:
.
The program will calculate the spectrum of the analyzed index (or, to be accurate, its periodogram). Remember that we do not use the price itself, but its detrended oscillator:
In this example, I use Dell shares price history from 1988 to 2004. To calculate the spectrum, I took the price bars for the years 1988 - 2003. The most strong cycles are marked by vertical lines. You may vary the algorithm of the spectrum calculation, use different amount of overtones used as inputs for Neural Net, but this does not change the whole picture significantly. The following diagram shows the Neural Net projection line based on fixed cycles (in accordance to the idea by Joseph Fourier):
The most common problem with this model is that it usually gives rather good forecast for some time ahead (about a month), but later the picture is "melted".
Something to think about: If you would ask me five years ago what cycles inside price data I expected to see as the strongest ones, my answer would be: the annual (one year) cycle and 4-year Presidential cycle. The more detailed investigation has shown that things are not so simple. I am definitely sure that the factor called NON LINEARITY is very important here. Her majesty NON LINEARITY is messing up all the cards in the nice picture of the Universe painted by Joseph Fourier.
Look at the spectrum above. We do not see the 1 year cycle here, there is 325 days cycle. Why this cycle is so shifted? I am sure it is because we deal here with the phenomenon of the nonlinear interaction between different cycles. It looks like the shifting in major fundamental cycles (like annual or Presidential) is responsible for this.
As another example, we can consider the price data with the annual cycle existing a priory (like for Ford or Disney shares). Let us look closer at the Disney shares, from 1962 to the year 2004.
Here is the spectrum:
As it has been expected, the one year cycle is presented (the
spectrum module specifies this one year cycle with accuracy of 4 hours). But,
besides the one-year cycle, we have two additional cycles, 309 and 393 days.
This splitting can be explained by nonlinear interaction of the annual cycle
with some other long term cycle.
Also, instead a 4-year cycle, we see 3.6-year cycle. Some possible explanation
of this phenomenon is suggested here.
Fractal Dynamic Model: Revealing Price Mosaic
Core idea: This model is based on the assumption that a kind of regular mosaic pictures might be presented in the price chart. These pictures may be very sophisticated. We have designed a special way of describing these pictures. During the training procedure, the Neural Net is able to reveal these mosaic patterns and uses them later to create a projection line. The detailed description of this model is here. The first time I have heard about this idea, I took it as the "crazy" one. The thorough research has shown that this model is very valuable. It reveals all possible fixed cycles that might exist for the analyzed market. Moreover, it reveals the interaction between different cycles as well. The disadvantage of this model is that now it does not take into account long term cycles (it is in my working plans, I will research this feature, but it takes some time).
How Timing Solution deals with this idea: It is very easy to create the Fractal Dynamic model. Click on this button:
Here you should set the parameters of Fractal Dynamic model.
The program creates a set of basic price patterns. The "Max order" parameter corresponds to the maximum period of these patterns (32 price bars in the example).
As inputs for the Neural Net, we use these elementary (basic) patterns:
During the training procedure, the Neural Net constructs a graph from these elementary price patterns. This graph is similar to the real price movement. It is like the "Lego" blocks for the children that allow to construct rather complicated designs combining just a few dozens of elementary details.
There is one parameter that I recommend to vary - the amount of hidden neurons:
This parameter can be considered as a related to the complexity of mosaic patterns.
Wavelet Model: Cycles Interaction
This is the latest model that combines the best of the two models described above. Like the Spectrum model, it reveals any fixed cycles; like the Fractal Dynamic Model, it allows to reveal the interaction between the cycles. Besides, it does not have the restriction of the Fractal Dynamic Model - it is capable to work with any time length cycles.
What the wavelet is: Before any discussion of the model, I would like to explain in brief what the wavelet is. I will try to do it as simple as possible. My apologies to the specialists in the wavelet theory for a possible profanation of this great idea. My only excuse is that it is extremely difficult to find simple words and images to illustrate this very sophisticated concept.
Generally speaking, the wavelet is nothing more than a part of a sine curve, "a small wave". It has been invented by physicists who dealt with real physical processes in a real time. Remember the model of the process introduced by Mr. Fourier (see above)? The scientists have found that it is very difficult (or, maybe, even impossible) to find the right equation or the one law (or a group of laws) for any real process - because everything in our world is connected to and interacts with everything. So, they suggested to use many basic pieces of the ideal function and construct the whole process from these small parts. To make it clear, think about the human voice and the scientific theory of the sound. When we speak, we produce sounds. Any sound (and there is no doubt in it) is a vibration that can be considered as a sound wave, can be described by the wave equation and can be represented by an infinite sine/cosine curve (like it has been discussed above). But - the human speech is much more complicated than that. Scientists have learned to record it, and they have found that the human voice is also represented by the sine curves. And each sine curve in our speech is not infinite, it has some definite location. So, the physicists have asked a question: what if instead of combining different sine curves in attempt to get the right final one, we can take one by one the small parts of different curves? This idea has turned out to be a successful one. It works now in our everyday life: any time you use your cell phone, small wavelets (pieces of the big waves) fly through the space and transform into your voice in the ears of your correspondent.
We have applied the same idea to the market analysis. There is a special group of models based on this idea that you are able to create and use in the Timing Solution. Unlike the Spectrum model, the Wavelet model analyzes the simple functions called basic (mother) wavelets. Let us consider one of them, so called Morlet wavelet (it is shown on the left diagram, picture (a)):
The Morlet wavelet is calculated as composed of a simple Sin curve (the green one on the picture (b)) and Gaussian bell (the red one). The general idea of the wavelet analysis is that we try to find the presence of this wavelet (or another wavelets) in any time series data.
For example, let us consider this data (I have found this example on this web site: http://paos.colorado.edu/research/wavelets/wavelet2.html):
This is the record of sea surface temperatures in equatorial Pacific Ocean. Suppose I make this wavelet from the elastic (rubber) material. I take it and start stretching and shifting it to get the best coincidence between the diagram above and the wavelet's image. It is very easy to do for some areas of the diagram and is totally impossible for some other parts of the same diagram. In other words, doing the wavelet analysis, we try to find zones where we can get a good coincidence between the wavelet and the analyzed diagram (temperature changes, in our example).
When such zones are defined, we get the resulting diagram:
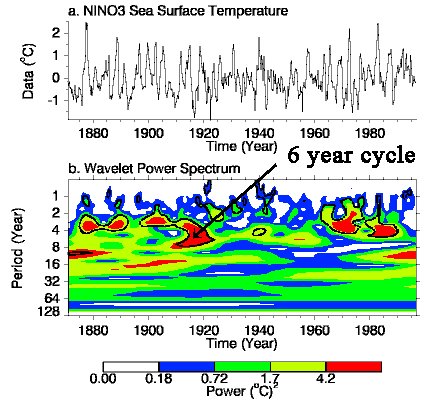
The diagram b represents "Wavelet Power Spectrum". Here, the x axis represents the time. The y axis corresponds to the period (in years) of the wavelet; it shows how much we should stretch our wavelet to get the good coincidence between its image and the analyzed diagram. Thus, this picture reveals to us the existence of cycles inside the process that we analyze. For example, in 1905 - 1920, we have got a good coincidence between the temperature and Morlet wavelet with the period 4 - 8 years. In other words, from 1905 to 1920, there were temperature cycles with 4 - 8 years period.
How do we use wavelets in the Timing Solution? Very simple: they serve as inputs for the Neural Net. In other words, we reveal the located in time wavelets for the analyzed price data set, create a model and then make a forecast.
Some thoughts regarding the usage of wavelets in the program: There are some differences between techniques used in signal processing science and procedures used in Timing Solution. Here is the list of some of them:
1) The rescaling procedure is performed by Object Oriented Neural Net automatically; it is provided by sub-optimization procedure. This is the main advantage of the Timing Solution program. In other words, during the training process, the program automatically finds the best scale for the wavelet (its period, or how much we should stretch our wavelet to get a good coincidence). It optimizes the time shift as well (i.e., how much we should shift our wavelet).
2) We use only two basic (mother) functions: Gaussian bell and Mexican Hat. We do not need to use more complicated basic functions (like Morlet or Daubechies wavelet families), it does not improve the results. I would recommend to use Gaussian bell wavelets; this function is very good for sub-optimization. As we use a bunch of wavelets shifted in time, we can model any function. The standard requests to basic wavelets such as orthonormility are not so important here, because our model is non-linear. The more important factor is a "good" derive for a basic function - it is important for sub-optimization procedure. It is the reason why I recommend to use Gaussian bell function.
3) The Neural Net allows to reveal non-linear effects.
4) We use regular wavelets. In other words, we suppose that any wavelet repeats itself in some period. This period is varied and optimized by the Neural Net. Thus we cover the fixed cycles model.
Core idea: As of today (February 2005), this is the most advanced cycle style model in the Timing Solution. It reveals any cycles/regular patterns that might be presented in the price chart. Besides, it allows to reveal non-linear interaction between these cycles/patterns.
How Timing Solution deals with this idea: Let us show how to create a wavelet model.
Click on this button:

In this window, define the parameters of the wavelet model:
"Min Cycle/Max Cycle" options represent the regularity of the wavelet. In other words, these parameters correspond to the period of wavelet's repeating itself. "Step" corresponds to the initial width of the wavelet, the program optimizes it during the training process (rescaling). "Kind" refers to the wavelet's type. I recommend to keep it as it is - Gaussian Bell curve.
With the Timing Solution program, you are able to use the astronomical cycles as the forecasting tool. Before any discussion, I would like to point out that there is nothing mysterious or mystical in it, it is Astronomy and Mathematics only. The reason to use the astronomical cycles in forecasting is pretty pragmatic - it allows to improve the forecasting ability of the models. The general assumption for this group of models is: the stock market possesses a kind of memory in respect to planets position/speed/angle between planets. The working hypothesis states that the market behavior correlates to these astronomical parameters. Astronomical parameters are well known to the science, are well described by the science, and their change can be calculated for years ahead. Knowing the market situation when some particular astro parameters have occurred in the past, we can expect the same reaction when this astro picture will repeat itself. Thus, we can use astronomical parameters as inputs for the Neural Net and create a model based on them. If it is your choice, you can use non-astronomical models only. But I must state that the so called regular models have one, though very remarkable weakness: we reveal regular price patterns analyzing the price history. In other words, to predict the price, we use the price itself, and the price only. Thus, we are inside the closed system - which might be not so bad, except we have a strong tendency not to see the big picture. Astronomy based models break this restriction, the system becomes open: to predict the price, we use something outside of the price itself, something already known to us, documented and predictable.
The following is the list of some arguments that the person who has come across this type of models might face:
1) The opponents of astro models state that the planets are too far from us, thus they can not affect our Earth life (for example, to us, the gravity of Mercury is 100.000 times less than the Moon's gravity). This argument is not a valid argument nowadays, at least for the last two decades when the scientists have introduced to us Non-linear Dynamic and Chaos Theory. A small force does not mean a small impact, otherwise I would like somebody to explain me why 1 milligram of nicotine can kill the horse whose body may weight couple of hundred kilograms...
2) In addition to #1, the planets constantly moving around us for millions of years do have impact on bio systems of the Earth (ask biologists and space medicine professionals as well as health professionals and disability insurance reps - humans and other bio systems response to any changes in their environment). Humans live not only in their own bodies, but in the world as well. .
3) It is not easy to point out the impact of the astronomical cycles - because these cycles are not regular from the common point of view. Would the planets move on ideal trajectories (as it was assumed by Claudius Ptolemy 2 thousand years ago), there would be no need in any astronomy based models. All these cycles would be revealed by simple spectrum analysis. But the planets' movements are not ideal, their trajectories are very complicated due to many factors, and this is the most appealing feature of astronomy based modes. The non regular behavior of the stock market is obvious for anybody, the money lost on the stock market is the best proof of this fact. So, why not to assume that the knowledge of one non regular process can help in understanding the other one? At least, our own research shows that the correlation between these two non regular phenomena has to be explored in depth.
Core idea: This model is based on the assumption that the stock market has a memory regarding planets positions and angles between the planets. In other words, when some planet is in some position in the skies (or passes through some point of the Zodiac in the terms of the old science), the stock market is in some special condition. We might expect that the market "remembers" its condition, and next time when this planet passes again the same point, the market's behavior will be the same. Under this model, you can explore different hypothesis - starting from the statements that XXX shares go several points up at the New Moon and fall twice times down at the Full Moon and going through all astrological ideas (like restricting impact of Saturn versus the expanding influence of Jupiter, or a special role of Venus and its derivatives on crops, gold and copper). I would not like to go into the discussion regarding the Astrology and its role - I prefer to look at or show the Back Testing results. It is the only way to understand whether it really works.
How Timing Solution deals with this idea: Let me show how to create FAM (Floating Angle Model) in the Timing Solution program. Click on this button:
You will get this window to set the parameters of FAM model (the most important parameters are marked by their importance, as to my opinion):
While training the Neural Net, the program runs one very power technique - sub-optimization. This technique is our "know how" and improves the forecasting ability of the program drastically.
Applying this model to the forecasting, you will face questions like these:
what are the stocks/futures/indexes this model is applicable to?
how many price bars are better to use as a training interval (i.e., what is the length of the stock market "memory" in respect to the astronomical factors)?
what are the best parameters for this model?
Answers to these questions (as well to other questions) can be received only after the HHUUUUGE Back Testing. This is what I am doing now, and you should be ready to do it too. There is no other way - if we are really interested in the real forecasting versus to fairy tales about some trading systems with the fantastic performance.
Core idea: This
is a new model. The content of this model is protected, I cannot reveal it now.
The only thing I can share regarding this model is that I know it works though I do not know why.
The idea of creating this model came to me when I spoke to one of my friends,
the sport medicine specialist. I was told that
the human body is more sensitive to the changes in the physical load
than to the load itself. I have started thinking, and the model has been born. Right now, the Dynamic Model provides the most reliable
projection line in comparison to any other models. And the most
important thing is that it produces the statistically verified result; it means we are dealing not
with some accidental fact, but with the statistical result.
This is the output of one of the many Back Testing reports for this model (the Dynamic and FAM models have been tested on 100 different intervals):
| Model | The Best Parameters | The Best Second |
| dynamic_model.hpp | Linear Model train last 10000 bars forecast on 50 bars Chi Sq= 3,9 (+64/-36) |
Linear Model train last 10000 bars forecast on 100 bars Chi Sq= 3,9 (+64/-36) |
| FAM_10_Pos_Geo.HYP | Linear Model train last 1000 bars forecast on 100 bars Chi Sq= 0,7 (+56/-44) |
Linear Model train last 1000 bars forecast on 25 bars Chi Sq= 0,5 (+55/-45) |
How Timing Solution deals with this idea: Though I do not provide the description of the model's core idea, you can work with it and try it yourself. It is very easy to do. Click on this button:
And choose this item:
As I do not understand quite well what real mechanics lies behind this model, I prefer to use the simplest math description for it.
Auto regression and Japanese Candlestick models: forecast a few days ahead
This is the group of models that
gave me a first statistical proof of the possibility to predict the markets. It
came out from my depression caused by close acquaintance with the Random Walk Theory.
The detailed explanation of this model can be found in Timing Solution documentation,
or you can read it here http://www.timingsolution.com/Help/ts_inputs.htm
The Back Testing for these two models definitely shows (with probability 99.5%)
that they provide a reliable forecast for at least 7 price bars ahead. The average
correlation between projection line and price 7 price bars ahead is
+0.174.
See http://www.timingsolution.com/Help/ts_models.htm
Before any further discussion, I have to point out that you should not expect miracles from the program. What do I mean under the miracles?
Let me ask you a question first. Have you ever thought WHY traders are losing their money? The outsider surfing the Internet is totally confused by this fact. It should not happen! Just look at all websites devoted to different programs that offer "up to 80% of winning trades" if you use their unique mechanical trading system or their winning trading strategy. Some systems claim that you will be able to make 700% profit in 3 years and 900% in 4 years! It gives the impression that somewhere there is a paradise with the money just waiting for you to come and take them. But - where is this place, this El Dorado? Does it really exist? It is not just a question of a person who has nothing better to do than amuse himself by general inquiries. It is a question that has been really bothering me during several years. This is a question that the manager of a major bank in my native country has asked me as a mathematician. He has asked me this question looking at tons of different printouts with VERY optimistic equity curves (it has happened in 1997). All these optimistic expectations changed dramatically to quite opposite ones while passing the "NOW" point. I believe that some trader might be able to get 700% (and more - there are such examples in the history), but I am talking about the mechanical trading systems.
As I see it, a part of the problem might be in a fact that a vast majority of common people confuses the statistical results with accidental happenings. I state that the statistically accurate results can be only those that are received free of future leaks and are confirmed by testing at least of 50 independent time sets of data (100 is better). Statements like "our system is a successful one because we have 8 winning trades out of 10 within some period of time" worth nothing.
It is not a problem to provide true nice looking pictures. Look at this one; it shows a very good coincidence between the price and the projection line (see here). Or this one, with good pictures for series of intervals (see here). These are the real projection lines produced by FAM model, but I would not recommend this model for the real forecasting. The reason is quite obvious: to understand how reliable is a projection line, you should analyze not one, not ten, but 50 diagrams at least. Otherwise, you are doomed to face the cold wind of reality that kills all overoptimistic expectations. My own experience of the researcher shows that any model works within some time frame, and the model with the best results suddenly starts to produce very poor results or has no sense at all. Is it a failure? Does it mean that there is no and never will be a way to forecast the markets? I would not say so; much more interesting question and (to me) much more important one is: why this model has been good on one intervals and is bad on the others? Instead of panicking, it is better to collect the information on different models' performance. I like a saying of one famous trader: "newcomers count profits while professionals count risk".
The models we are dealing with explain the real price movement with different accuracy. I suggest this scale of the models: 5% correlation - not so good model, 10% correlation - a good model; 15% correlation - it is a very good model. The scale covers 0%-100%.
Are these figures good or bad? Neither; it is what the Nature allows us to play with. But these figures are in the core of any success on the markets. I have found an interesting reference to the research conducted by MIT group. It is now a proven fact that some technical analysis techniques (such as inverse head-and-shoulder and broadening bottoms patterns) can provide non-random results. Do you know how much these results are? 4% and 6.2% in average.
So what we have now (February, 2005)? First of all, I have got two statistically approved models: Dynamic Model and Japanese CandleSticks Model. It took me several months to conduct the research, exclude possible artifacts, and provide a lot of Back Testing calculations. This is extremely important fact because it tells us that the forecast is possible, at least under some conditions. For me, it is like the existence theorem in math; it tells YES to the forecast existence, while the Random Walk Theory states NO. Soon I will put on the website the full Back Testing report for these models.
We have started with the initial step - creating and testing different models and their combinations. Right now, we can tell for sure that there are zones where the market is predictable and follows some model/models and there are opposite zones - where the market is chaotic. While doing the Back Testing, I have found that usually some model produces a good projection line during some time period (usually several months), then something occurs - and this model does not work any more. It looks like from time to time the market switches to a different scenario (it is seen when working with FAM or Spectrum model) after a short adjusting period. But sometimes this switch results in the period of unpredictable changes.
So, right now I use this working hypothesis: the market follows one of the models, then switches to the model of different nature (otherwise it would be revealed in the process of creating the model), follows this new model, and then switches again. This is the reason to use different approaches (see the beginning of this article).
Look at this diagram:
Instrument: Dell
Astronomical Model - red, Spectrum
Model- blue and Dynamic Model - green
The Best Model:
Astronomical Model
This is the application of the above mentioned idea. The users of the Timing Solution program can download a new upgrade (February 20, 2005); this Solution is available there (see Solution: ts_ranked.ts).
Here the program optimizes three different models and is observing which one of the models provides the most reliable projection line starting from July to the beginning of September, 2003. It has happened to be a red model (which is based on astronomical cycles) , so this line (a red one) is thicker than other ones. We may assume that this model is able to provide the best projection line in the future (that is what actually has happened). The second best is the blue line (produced by the Spectrum model). The worse model here is the Dynamic Model (see the thinner line).
This situation reflects the "Status quo" on September, 2003. When we shift the border between the training (the blue region) and testing (the red region) intervals, the situation will change. The market will change the scenario of its behavior. It looks like the Astronomical, Spectral and FAM models work together, they produce the similar projection lines. We can compare these models to the players of the same team: they play the same game, have the same goal, go in the same direction, but they have different styles of playing and, in respect to this fact, they are leaders at different times. I have no need to say that this is just a hypothesis to be tested and tested.
Besides, look at the red and blue curves. Sometimes there is a slight difference in their colors. The bright color corresponds to the forecasting horizons for these models. Beyond this interval, we cannot trust this model at all. This is not a mere hypothesis, we can find this interval through Back Testing procedure.
Thus, the next development will go in two directions:
1) a theoretical one - with the main focus on conditions of the reliable forecast (models and stocks/futures/indexes; which one is better for what; why it is so; time intervals where the forecast is reliable; the difference between predictable and unpredictable zones; what happens to the models when they reach the border between these zones - these are only first line of the questions to be answered);
2) a practical one - creating the trading system that generates enter/exit points (at least, exit points as the most important ones in respect to making money).
Published: 11 February 2005
Updated: 20 February 2005
Toronto, Canada.