Easy Cycle Module: how to create the model based on fixed cycles in 10 minutes
Easy Start - making cycles model manually
To make this projection line, you do not need any special skills. You simply draw the cycles on the screen using your mouse. Being quite simple, this approach allows to reveal rather complicated cyclic processes that take place in financial data. However, it is necessary to make a simple introduction into cyclic analysis. Let's go ...
Everything goes in cycles. What does this statement mean? Practically, it says that the history repeats itself. Nobody argues that. The question is what can we learn from the history in regards to financial data analysis?
In this article, I would like to discuss the new feature of Timing Solution software � Easy Cycle module. This module easily shows the lessons that the history gives to us. Remember that Timing Solution has already much more comprehensive Spectrum module that is able to reveal any cycle/cycles. However, this new module is a good helper in understanding the general idea of the cycles.
Before any discussion, let us figure out what the cycle is? Mathematically, the cycle is a timely process that can be presented by a sinus curve. It looks like this:
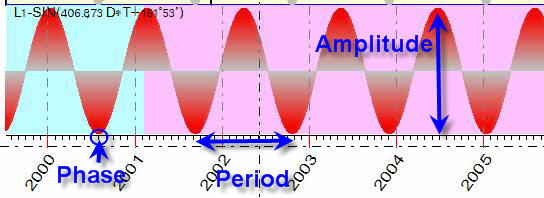
This nice looking curve describes a marvelous amount of processes in our lives. Since Fourier discovered it in 18th century, any scientist spends a lot of time with this nice looking "lady". They even gave her a special name � the harmonic function.
In this article, we will try to present the harmonic function�s point of view. There are three most important parameters to describe it:
How to do this? Let us try together.
I downloaded the EURO/USD financial data from the year 2000 to the end of 2006. Now follow this: "Tools"->"Easy Cycle".
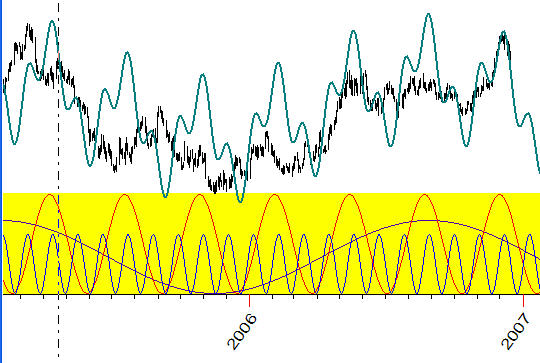
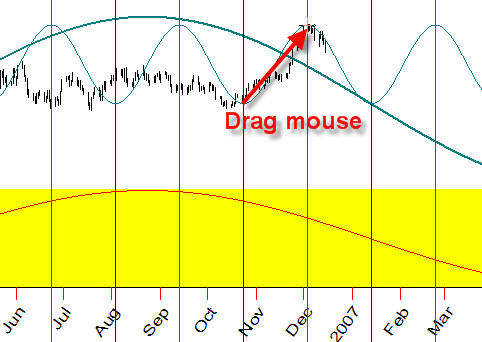
Looking at the price chart for the last 3 years, we can see there a wave that may be prolonged into the future:
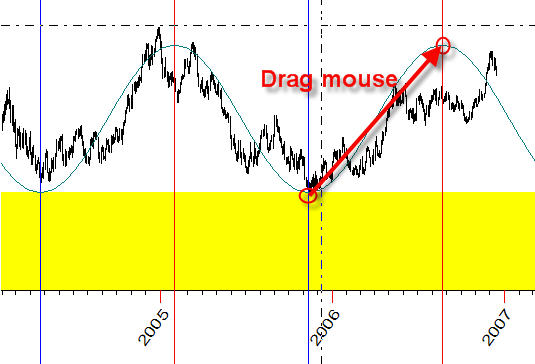
To initiate this wave needs just one mouse action: drag the mouse from one bottom to the next top of the price chart. While drawing this wave, watch how it fits other tops and bottoms. The more tops/bottoms covered the more reliable the wave is.
Now put this wave into "Cycle Box":
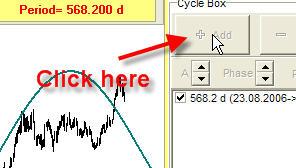
I need to mention one very important thing: always start with the bigger cycle (highest amplitude) and then go to the smaller ones.
Now, when we have established the first cycle, let us look at the price chart again: are we able to find the tracks of some other cycles? Look at this one:
Draw this cycle and watch how this wave fits other turning points:
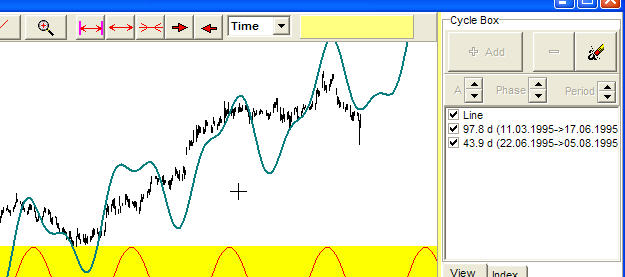
Click "Add" button to put this cycle into "Cycle Box" as well:
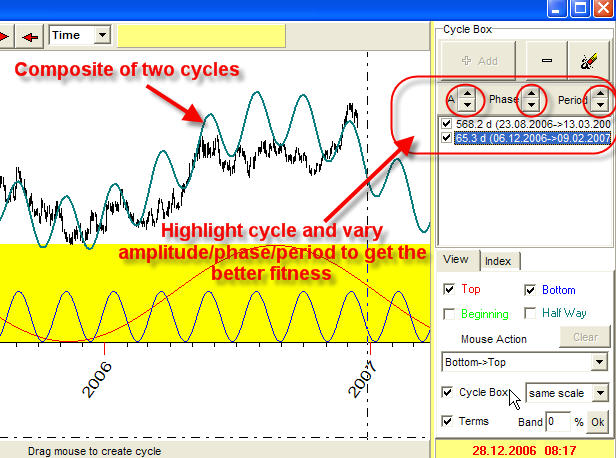
Immediately you can see there the superposition of these two waves. To get the better fitness between price history and this composite curve, try to vary amplitude/phase/period for these cycles as it is shown on the picture.
Sometimes (when you deal with trended data) it might be difficult to identify these cycles visually. In this case I recommend to activate "Index" option:
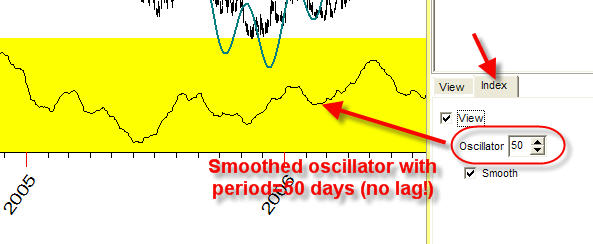
Here the program displays the oscillator in the bottom of the screen. Try to vary the oscillator's period catching the waves with different period.
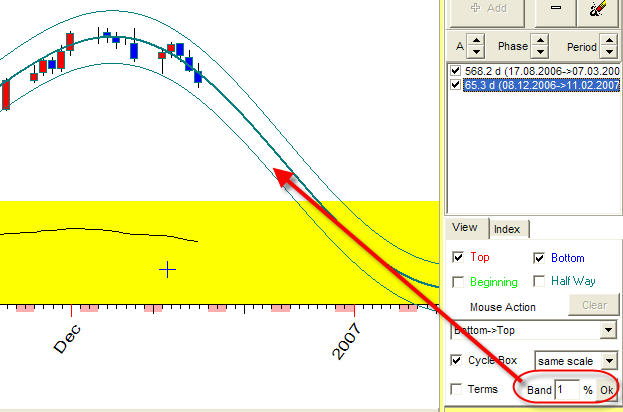
Look at this option; its variation is useful when creating the band based on the constructed projection line:
Also you can draw a trend line. Click on this button:
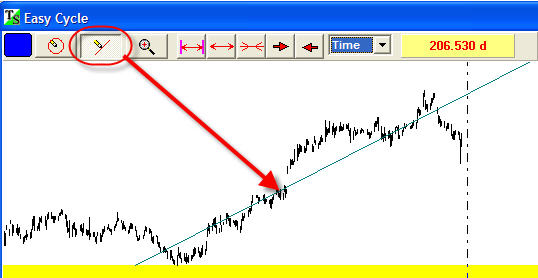
and add new cycles to this trend line:
One step ahead: Easy Cycle + Spectrum
The power point of Timing Solution is that we provide the full analysis of all techniques that we recommend. You never ever see on our website ( http://www.timingsolution.com) the statements like "this technique works very well ..." if we do not have the real statistical verification of its performance. Remember the fact that 95% traders lose their money, and they all use "good" tools ...
So, playing with Easy Cycle module you definitely will ask the question as to what cycles are really important. To answer this question, the best tool is Spectrum analysis provided by another module of Timing Solution. It gives you a diagram like this:
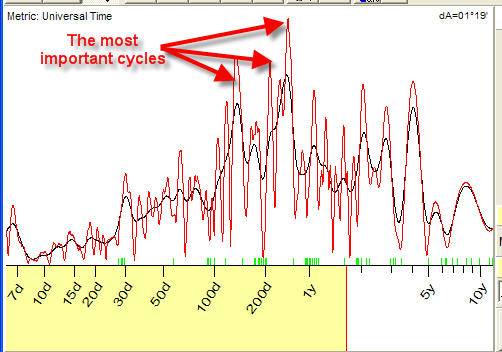
The peaks on this diagram correspond to the most important cycles (the analysis has been done for EURO/USD). We have spent 2 years adjusting standard mathematical procedures for these noised financial data, to get the maximum of possible information while doing the minimum amount of operations. The result is that now you need to make only one mouse click.
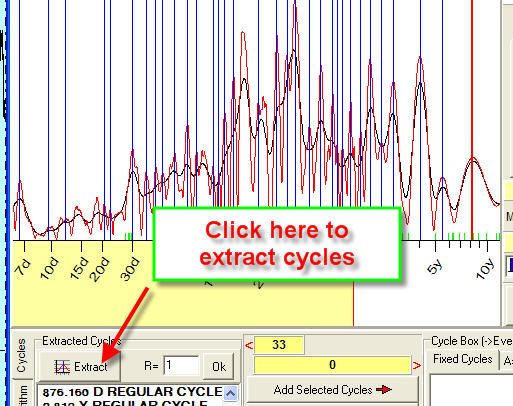
Let me demonstrate how to use the cycles calculated in Spectrum module. I have calculated Spectrum and clicked on "Extract" button to find the most important cycles. These cycles are shown in the "Extracted Cycles" list:
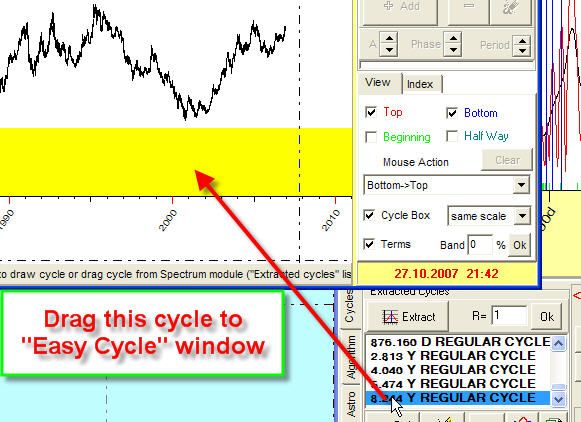
Now run "Easy Cycle" module and drag by mouse the most important cycles from "Extracted Cycles" list in Spectrum module to "Easy Cycle" window:
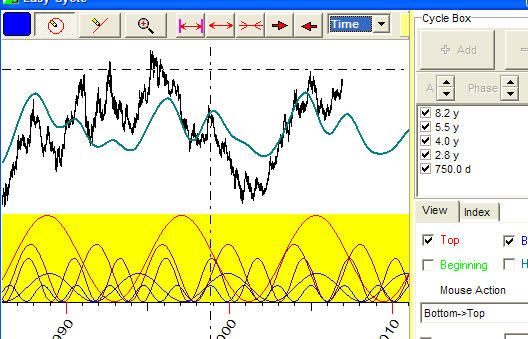
The program automatically finds the amplitude and phase for this cycle using the price history viewed in Easy Cycle module. See this projection line that I have received by dragging five most important cycles:
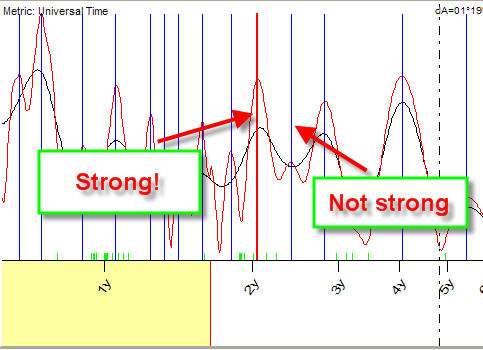
How to choose the most important (or the strongest) cycles? I would recommend to use the highest and narrowest peaks on the extracted cycles diagram. The higher and narrower the peak on the Spectrum diagram, the stronger the cycle is:
Two steps ahead
To get the answer to the question above, we need to do the extensive Back Testing. Timing Solution group constantly conducts this hard and time-consuming work while the user gets ready solutions - the best models for different financial instruments. Simply saying, the back testing procedure analyzes hundreds of models, calculates thousands of projection lines and looks for the best models. To do this work manually is absolutely impossible, it takes weeks of several computers working. We will keep you updated.
Example of creating a cyclic model
In reality the procedure of creating a cyclic model needs your preliminary study of the analyzed financial instrument. First of all, you need to remember that usually the cyclic waves do not live long. Usually, the cycle lives just several waves; after that the stock market "forgets" about this cycle and switches to another ones. If two decades ago the scientists tried to find the persistent cycles that work all the time, they are mostly concentrated now on finding a cycles structure transferring to a chaotic structure. Thus, creating the cyclic models try to pick up few cycles only.
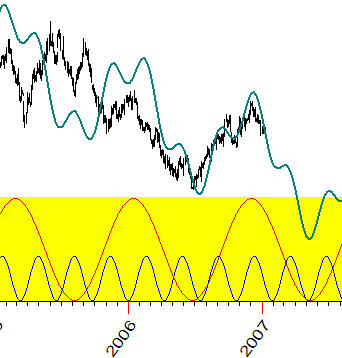
I have downloaded T-Bonds chart for the last 3 years:
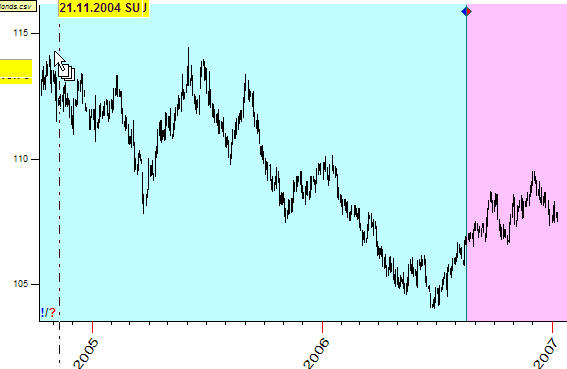
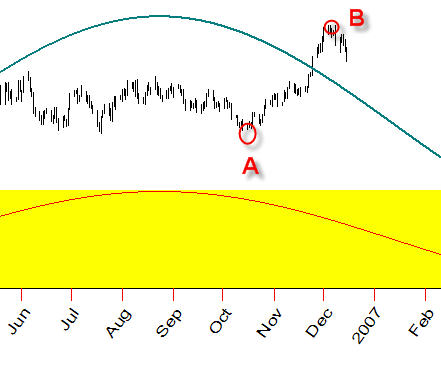
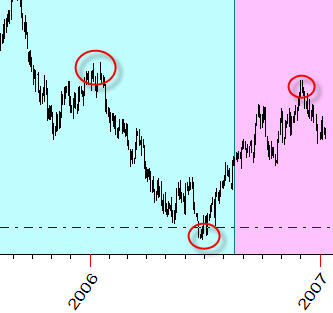
Look attentively on this chart and try to find the cyclic patterns here. It looks like the top in the beginning of 2006, the bottom in the middle of 2006 and the top in the end of 2006 are the parts of the same wave:
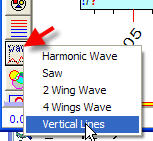
Some hints in revealing cycles can be provided by the charting tool "Vertical Lines" that is available in the program:
Drag the mouse from the bottom in the middle of 2006 to the top in the end of 2006. You will get these vertical lines:
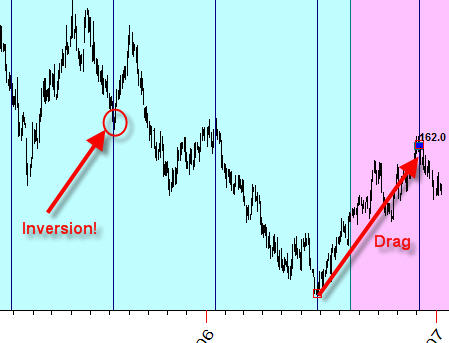
You can see that these lines hit the bottom in the middle of 2005; however we face with the inversion effect here - this cycle is inverted.
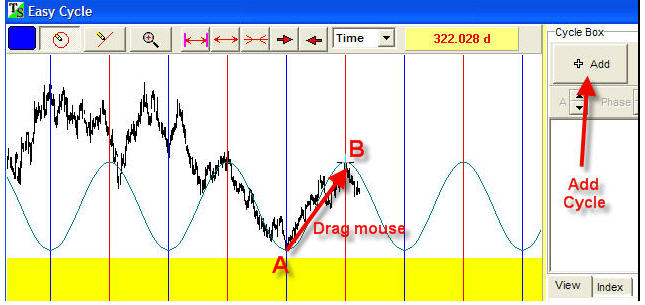
Drag the mouse from the point "A" to the point "B" and add this cycle to cycle box:
Look for other cycles. I see a small cycle of one month length that looks like active in the end of 2006:
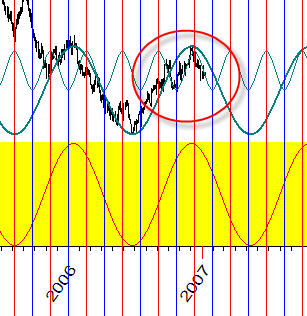
I have added this cycle to the Cycle Box and have got this picture:
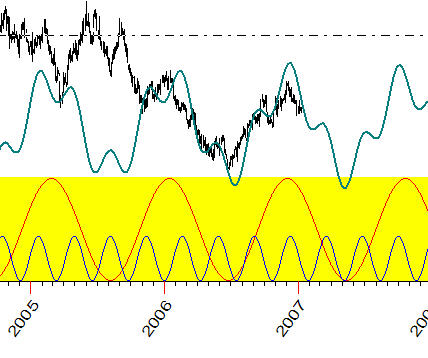
Looking at our projection line, I would think that we have missed a trend here. I draw this trend line:
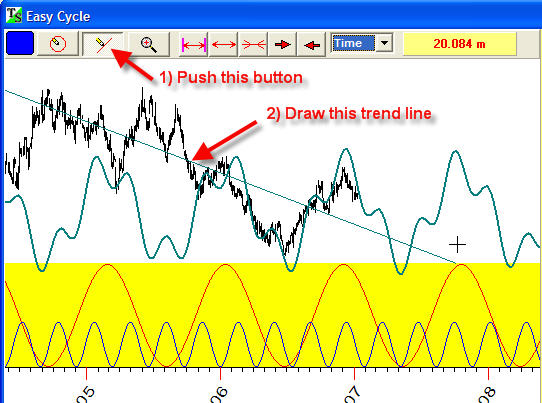
and add this trend line to the Cycle Box:
This is a very simple model, and I like this approach. The best feature is that you create these cycle by your own hand, getting a feeling regarding the cyclic nature of your analyzed financial instrument. With Timing Solution, you can easily create much more complicated models that analyze hundreds of cycles and generate pretty impressive projection lines. But this approach allows to work with cycles "t�te-�-t�te".
January 2, 2007
January 24, 2007
Toronto, Canada
Sergey Tarassov