Step-by-step guide
Neural Net Module
![]()
Before creating any Neural Net forecast, you need to understand clearly the
difference between the two things:
what you would like to forecast and what
this forecast is based on. In the terms of Neural Net technology,
things to be forecasted are called OUTPUTS while what this forecast is based on is called INPUTS.
Here are some samples of forecasts you can make with Timing Solution software.
You can make a forecast for:
So, if you would like to do a forecast using Spectrum model, use Fast Spectrum Solution feature. You will find it here:
![]()
The program automatically extracts fixed cycles (INPUTS) from Spectrum and creates a forecast based on these cycles. You need to define your target, what you would like to forecast (OUTPUT):
The same thing with astronomical cycles. The Fast solution based on these cycles is here:
![]()
Now, I would like to remind you that Fast Solutions differ from ready solutions in the module of the program called "Timing Solutions". With ready solutions, you do nothing except choosing the solution once. It is a fully automated process that provides you the general information regarding the market conditions (we do them for major indices mostly, and these Solutions are based on extended Back Testing of the different models). Fast Solutions are just half automated. There you have more options to choose from and to customize a set of standard procedures to your particular data. But there are a lot of calculations that the program provides itself, automatically.
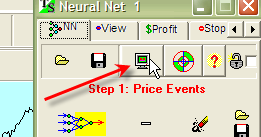
If you would like to control the whole process of forecast creation, run the Neural Net module:
You can find more information regarding Inputs/Outputs in related parts of Timing Solution Documentation:
Object Oriented Neural Network - Outputs (what we are forecasting ...)
Object Oriented Neural Network - Inputs (what forecasting is based on ...)
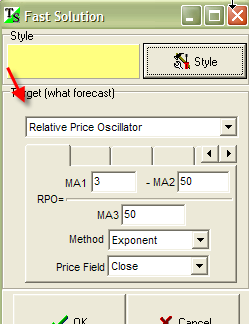
Let us discuss them a little bit. We begin with Outputs. Click on this
button: ![]() . There is a big variety of possible indicators you may to
forecast with this software. As an
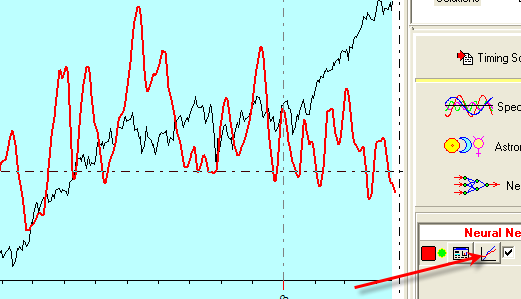
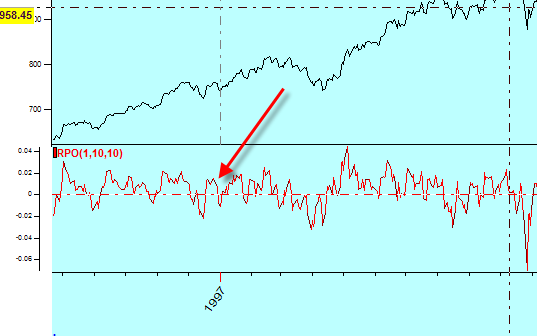
example, you can forecast the moves of the Relative Price Oscillator to catch short term swings:
. There is a big variety of possible indicators you may to
forecast with this software. As an
example, you can forecast the moves of the Relative Price Oscillator to catch short term swings:
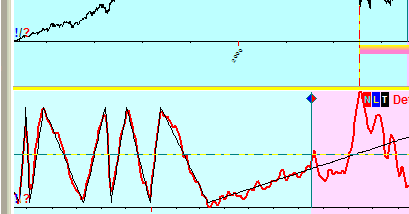
Here is how this oscillator (red bottom curve) looks against the real price:
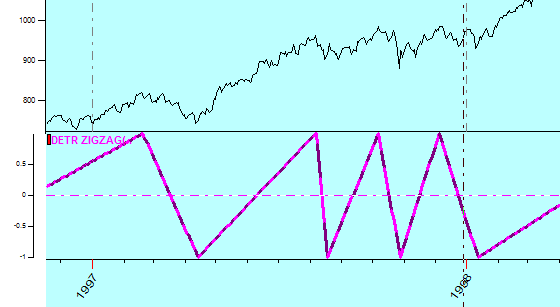
To catch the turning points, the Detrended Zigzag is the best:
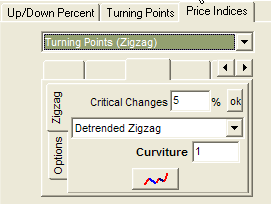
Here it is (the purple line):
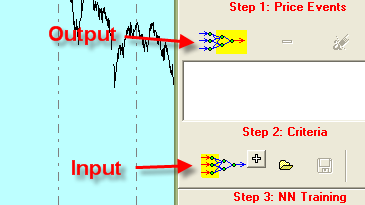
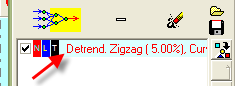
After the indicator to be forecasted is defined, it will be added to this list:
Now we need to define INPUTS, or the base for the forecast. Click this button:
Or, for some models, you can use a "quick" button: ![]() .
.
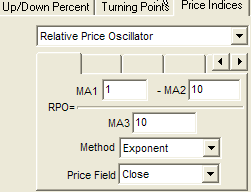
You will get this dialog window:
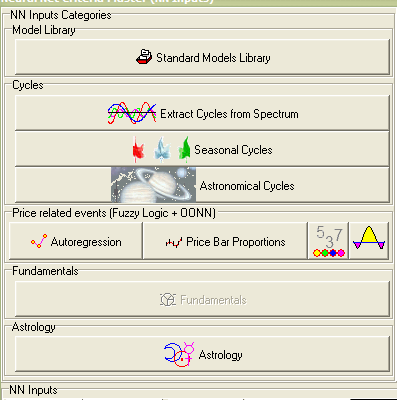
Here each button is devoted to different categories of inputs. We recommend to read the documentation regarding this issue.
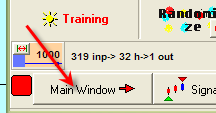
When OUTPUTS and INPUTS are defined, we are ready to TRAIN the Neural Network. Click this button:
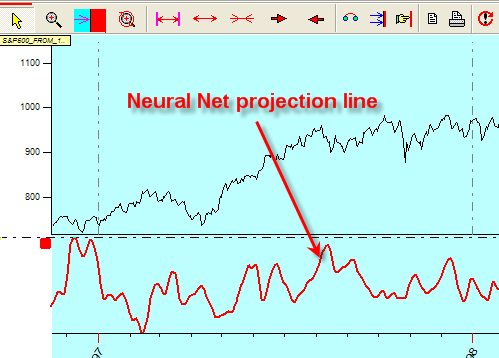
Now look at Main Window, you will get something like this:
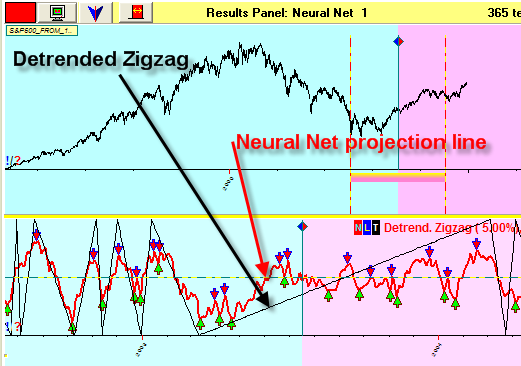
Here the red curve is Neural Net projection line, while black line shows Detrended Zigzag (OUTPUT). You can disable buy/sell signals here:
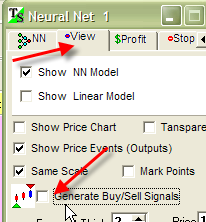
Give Neural Net some time for training, and the red line becomes closer to Detrended Zigzag line:
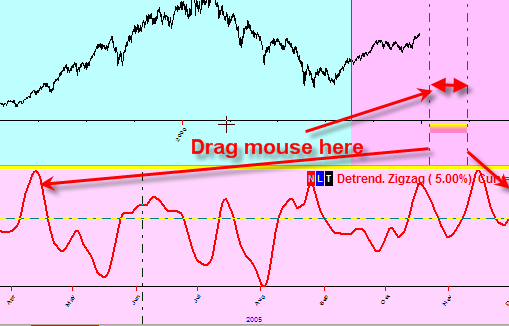
You can chose any part of the price chart to see the projection line for any time interval:
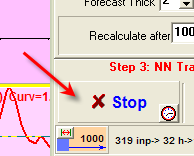
When you decide that the projection line is ready for your purposes, click this button:
To see the Neural Net projection line in the Main Window, push this button to remove the Neural Net results panel:
and then click:
Now the projection line is in the Main Window:
You can manipulate this projection line; for example, display it together with the price chart: