Two dimensional Time!!! - Spectrum model for Intraday
written by Sergey Tarassov
If you try to make a forecast for intraday data based on Spectral analysis, you obviously will face a few problems that have unexpected solution: the usage of 2D time.
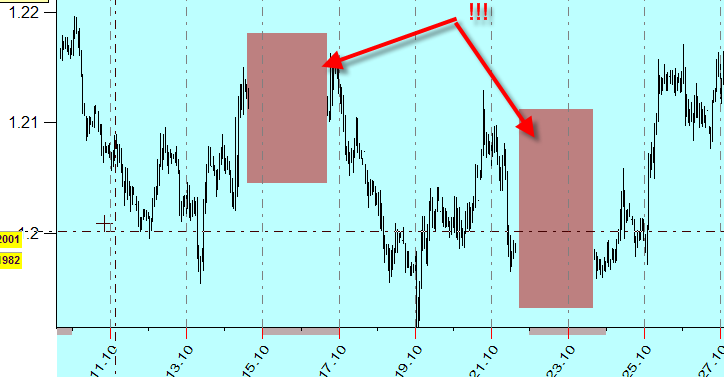
Let's consider the typical intraday data, they look like this:
This is weekly intraday, we have here 5 trade days and 2 weekend gaps.
For daily intraday, it looks like this:
Here we deal with trading and non trading hours.
Suppose we want to create the Spectrum module for these data - the model based on fixed cycles. We create the Spectrum, extract the most significant cycles from spectrum diagram and use these cycles as inputs for Neural Net module.
The question this in what Time is it better to research these cycles? Right now in Timing Solution there are two possibilities:
: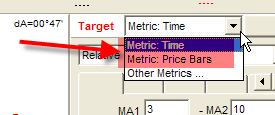
There are a) Universal Time and b) Price Bars Time.
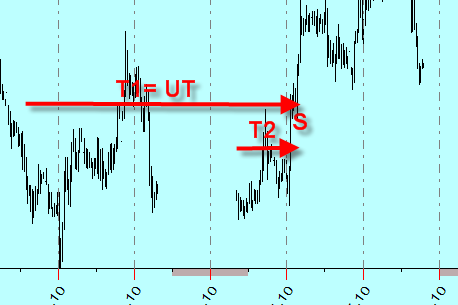
The universal Time is the Time we all used to live in, that same time that is now measured by the atomic clock. If we consider the weekly intraday data with one hour tick, we'll get this:
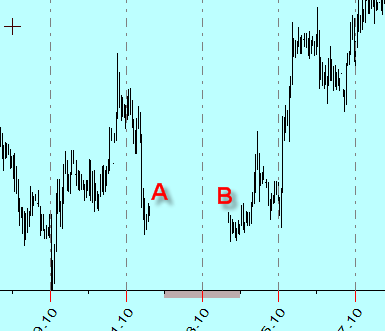
The distance between two points A and B is 48 hours, or 48 times bigger than the distance between two price bars.
Another metrics is Price Bar. This time does not see the weekend gap, the distance between points A and B is the same as the distance between two price bars. The time between points A and B flows very, very slow - 1 hour of price bar time lasts 2 days of universal time.
The problem is: both of these Times are not suitable for modeling of these data.
If we use the Universal Time, the distance between points A and B will be overestimated, while in reality there are no trades in this period. On Monday morning, traders remember what it ha been on Friday evening. If there would be any trades within these two days, the traders possibly would forget about Friday evening - so many things would happen at that time.
If we use Price Bar Time Time, this interval will be underestimated. From the point of view of this Time, the distance between points A and B is exactly the same as the distance between two price bars. Everything sells for 1$:) But it is not quite correct. During the weekend, the traders have a rest and they remember the situation on stock markets; when they return on Monday morning, they may change their strategy as well.
Anybody experienced in math should feel uncomfortable in this situation. It is like you are trying to draw a nice 3-dimensional castle using a single sheet of paper. To get a better picture, we should add one more dimension here.
Let me introduce 2D Time. Each point is presented by two Times (T1,T2):
As T1, we can use the Universal Time, we can call it Major Time. Besides, there is one more Time presented that is calculated as Price Bar Time. The cycles in this time are represented by two modulated sinus curves.
It is interesting that it is possible to calculate the spectrum for this 2D time, it should be 3D diagram. We can extract cycles from this 2D Spectrum. The result should be sound like this: "for this specific market, 36 days cycle modulated on 27 price bar cycle is strong enough". These cycles are strong together, separately they do not work.
I plan to develop this module in Timing Solution Advanced program at fall 2006.
Actually, we are living in many dimensional time. Surely, the Universal Time is the Major one. However, besides it there is a strong annual cycle as well, and we used to live in this cyclic time: every spring we feel ourselves very close to the same as we were young, this Time is returned to us, but the Major Time follows straight only. We can add here weekly time or daily time. It is very interesting that such a nice toy as a many-dimensional time for this particular task becomes a necessity...
Sergey Tarassov.
February 16, 2006
Toronto, Canada