Semi Automated Testing of Phenomenological Models
I would like to bring your attention to this new algorithm of finding the best phenomenological model.
The general idea of this technique is simple: we apply suggested models to the financial instrument of our choice, and then analyze them. Previously, you could do it manually, for different models. You would have to choose the models, train Neural Nets, test them and then compare the results. Now, all you need to do is just choose your financial instrument and run the new Solution, "Phenomenological.ts", and wait while the program applies 27 previously created models to this instrument, trains and tests 27 Neural Nets, finds correlation coefficients for each model - and gives you final results as a table.
It is a kind of simplified back testing for phenomenological models. We did it with the intention to help users who have no time or proper skills for model's research.
Then you may take the best model (or several best choices) and make a projection line for your financial instrument in a usual way.
Now, we suggest 27 models. These are mostly phenomenological models. The list includes several Spectrum models as well; these Spectrum models have shown promising results for some financial instruments (see "Naked Truth" section on the website). We continue working with the new models and testing the old ones. It means that the list of suggested models will be changing in time.
So, what do you need to do? Follow these steps:
Step 1: Download any financial instrument
Step 2: Set the TRAINING interval as big as possible. The bigger interval allows to avoid the random coincidence.
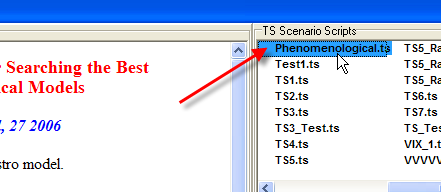
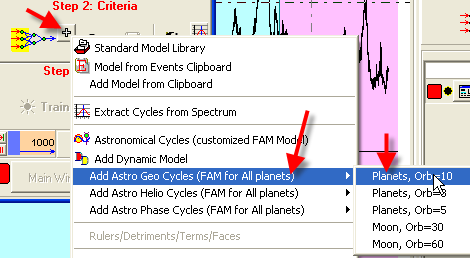
Step 3: Run the "Phenomenological.ts" Solution:
Below you will see three Case Studies. I applied this technology to Dow Jones Industrial Index and Corn and Gold data.
Dow Jones Industrial Index Case Study
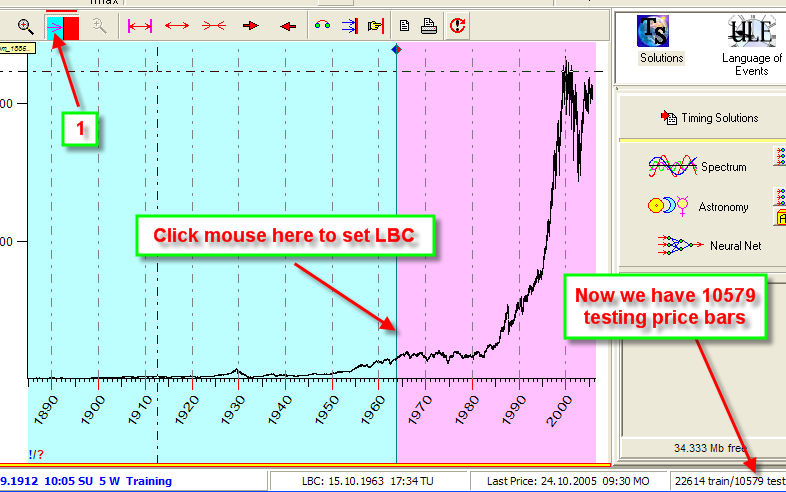
Download Dow Jones Industrial index data. I took the data from 1885 up to 2006 (33.000 price bars). The LBC is set at the year 1963; thus we have more than 10.000 testing price bars:
Now, run the "Phenomenological.ts" Solution:
You will get the table below:
Financial Instrument: Dow_from_1885.csv
Analyzed 27 models
LBC Info: 22607 train/10586 test
Target: Rel. Osc.(1,50,50 Close,Exp)
| Model | NN (first 10801 pt) | NN (first 5378 pt) | NN (last 5425 pt) | LIN (first 10801 pt) | LIN (first 5378 pt) | LIN (last 5425 pt) |
| Dynamic Model TI=500 | 14.89% | 9.00% | 21.53% | 3.33% | -0.01% | 7.43% |
| Dynamic Model TI=750 | 13.86% | 9.60% | 18.87% | 4.59% | 5.77% | 4.10% |
| Spectrum Model TI=1000 | 10.16% | 7.44% | 13.79% | 7.36% | 6.57% | 7.61% |
| FAM Model Phase, Orb=10, TI=1000 | 7.66% | 2.87% | 12.27% | 8.70% | 2.14% | 15.27% |
| FAM Model Phase, Orb=10, TI=2000 | 7.39% | 3.16% | 11.48% | 7.77% | 2.10% | 13.20% |
| Dynamic Model TI=1000 | 6.83% | 3.69% | 10.78% | 3.88% | 2.78% | 5.83% |
| FAM Model Phase, Orb=15, TI=1000 | 6.68% | 0.41% | 12.83% | 5.08% | -1.84% | 12.13% |
| FAM Model Phase, Orb=15, TI=2000 | 6.56% | -0.68% | 13.19% | 8.03% | 1.37% | 14.50% |
| FAM Model Geo, Orb=15, TI=2000 | 6.36% | 11.17% | 0.84% | 5.22% | 12.17% | -2.40% |
| Terms/Faces Model TI=All | 5.37% | 0.99% | 10.09% | 4.91% | 2.30% | 7.72% |
| Dynamic Model TI=2000 | 4.65% | 3.78% | 6.18% | -0.59% | 1.06% | -2.08% |
| FAM Model Phase, Orb=10, TI=All | 4.41% | 3.56% | 5.20% | 4.36% | 4.06% | 4.64% |
| Seasonal Orb=15, TI=1000 | 4.27% | 2.84% | 5.66% | 0.13% | -0.39% | 0.47% |
| FAM Model Geo, Orb=10, TI=2000 | 4.11% | 4.32% | 4.71% | 6.83% | 10.38% | 3.52% |
| FAM Model Geo, Orb=10, TI=1000 | 4.01% | 8.84% | -1.53% | 7.36% | 6.29% | 8.57% |
| Ptolemy Aspects Model Orb=15 | 3.68% | 0.65% | 6.44% | -0.49% | -4.40% | 3.36% |
| FAM Model Geo, Orb=15, TI=1000 | 3.58% | 7.63% | -0.56% | 8.52% | 6.93% | 10.38% |
| FAM Model Phase, Orb=15, TI=All | 2.43% | 2.69% | 1.94% | 1.67% | 1.35% | 1.92% |
| Terms/Faces Model TI=2000 | 2.26% | 0.39% | 3.37% | 8.14% | 1.70% | 10.14% |
| Seasonal Orb=10, TI=1000 | 2.16% | 5.25% | -0.93% | -0.12% | -0.94% | 0.51% |
| FAM Model Geo, Orb=10, TI=All | 2.10% | 4.59% | 0.77% | 5.86% | 9.24% | 4.74% |
| FAM Model Geo, Orb=15, TI=All | 1.81% | -2.94% | 7.94% | 2.17% | 5.40% | 0.87% |
| Terms/Faces Model TI=1000 | 1.12% | 1.13% | 2.26% | 9.38% | 8.22% | 8.14% |
| Dynamic Model TI=All | 0.11% | 1.89% | -1.58% | 2.39% | 0.26% | 4.72% |
| Spectrum Model TI=300 | -0.93% | 3.15% | -5.43% | -1.25% | 6.45% | -8.92% |
| Spectrum Model TI=50 | -3.40% | -0.35% | -6.61% | -0.91% | 4.58% | -7.06% |
| Spectrum Model TI=500 | -5.18% | -7.37% | -3.54% | -1.89% | -2.08% | -2.04% |
It is a list of 27 models sorted in regards to correlation coefficients. (The correlation coefficient shows how well each projection line fits the real price within the testing interval.) Red numbers mean a positive correlation; blue numbers show a negative correlation.
As you see, the best model for DJI is "Dynamic Model TI=500"; this is Dynamic model with the training interval = 500 price bars.
You can easily create the Neural Net projection line for "Dynamic Model TI=500". Follow these steps: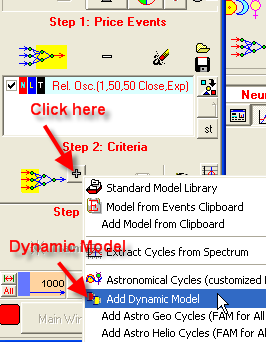
There define the Training Interval (TI)=500 price bars:
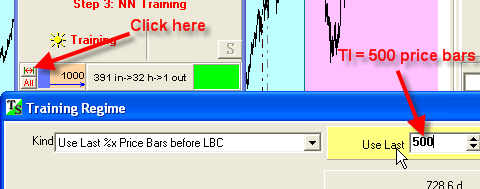
Now you can see the length of training interval here: 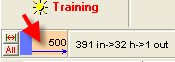
You can try the same model with the training interval = 750 price bars as well, it gives very close results (see the next line in the table above):
| Dynamic Model TI=750 | 13.86% | 9.60% | 18.87% | 4.59% | 5.77% |
One of Spectrum models proposed by Ben Price also looks well
| Spectrum Model TI=1000 | 10.16% | 7.44% | 13.79% | 7.36% | 6.57% |
In other words, we can use some fixed cycles to forecast Dow Jones.
Next three best models are FAM Phase model and one more Dynamic model:
| FAM Model Phase, Orb=10, TI=1000 | 7.66% | 2.87% | 12.27% | 8.70% | 2.14% | 15.27% |
| FAM Model Phase, Orb=10, TI=2000 | 7.39% | 3.16% | 11.48% | 7.77% | 2.10% | 13.20% |
| Dynamic Model TI=1000 | 6.83% | 3.69% | 10.78% | 3.88% | 2.78% | 5.83% |
I would like to add a few words on Phase models. Phase models are based on planetary phases, and very often they work together with Dynamic models.
The planetary phase means the degree of illumination of the planets by the Sun if we observe this planets from the Earth's surface. Also, with a good accuracy, we can consider the phase of the planet as a degree of gravitation of this planet. When the phase=0 degrees (for example New Venus = heliocentric Venus-Earth conjunction), the distance between Venus and the Earth is in its minimum, while its gravitation effect is maximum. When the phase=180 degrees (Full Venus = heliocentric Venus-Earth opposition), it means the maximum distance between Venus and the Earth and therefore the minimum gravitation effect.
Thus we can consider the Dow Jones index as phase/gravitation dependable market.
Financial Instrument: CORN
prices
Analyzed 27 models
LBC Info: 9351 train/5004 test
Target: Rel. Osc.(1,50,50 Close,Exp)
| Model | NN (first 5218 pt) | NN (first 2613 pt) | NN (last 2607 pt) | LIN (first 5218 pt) | LIN (first 2613 pt) | LIN (last 2607 pt) |
| Terms/Faces Model TI=1000 | 31.01% | 39.80% | 18.36% | 19.78% | 32.93% | 1.76% |
| FAM Model Geo, Orb=10, TI=1000 | 29.62% | 32.58% | 23.97% | 27.59% | 32.80% | 20.17% |
| FAM Model Geo, Orb=15, TI=2000 | 28.55% | 28.84% | 27.09% | 26.24% | 26.58% | 25.15% |
| FAM Model Geo, Orb=15, TI=1000 | 28.12% | 31.29% | 21.90% | 25.11% | 30.42% | 17.79% |
| FAM Model Geo, Orb=10, TI=2000 | 27.30% | 30.38% | 22.41% | 24.29% | 24.62% | 22.93% |
| FAM Model Geo, Orb=15, TI=All | 22.38% | 28.03% | 16.05% | 19.21% | 22.16% | 16.03% |
| Terms/Faces Model TI=2000 | 20.53% | 21.31% | 19.93% | 13.85% | 15.51% | 17.95% |
| Seasonal Orb=15, TI=1000 | 17.65% | 23.07% | 11.05% | 19.10% | 24.41% | 12.72% |
| Seasonal Orb=10, TI=1000 | 17.57% | 20.44% | 14.09% | 19.05% | 23.90% | 13.19% |
| Terms/Faces Model TI=All | 16.94% | 18.23% | 17.83% | 14.75% | 17.09% | 13.71% |
| Dynamic Model TI=2000 | 15.94% | 22.18% | 9.38% | 8.92% | 12.60% | 4.34% |
| Dynamic Model TI=1000 | 12.80% | 15.67% | 7.99% | 10.42% | 9.79% | 10.25% |
| FAM Model Phase, Orb=10, TI=1000 | 12.25% | 14.62% | 8.04% | 7.22% | 7.46% | 5.39% |
| FAM Model Phase, Orb=15, TI=1000 | 9.13% | 11.12% | 4.72% | 4.96% | 5.10% | 3.18% |
| FAM Model Geo, Orb=10, TI=All | 9.06% | 9.89% | 8.58% | 16.98% | 20.73% | 12.88% |
| Dynamic Model TI=500 | 5.81% | 8.26% | 2.76% | -4.92% | -9.13% | 1.44% |
| Spectrum Model TI=300 | 3.93% | 1.78% | 7.24% | 3.35% | -1.36% | 8.57% |
| FAM Model Phase, Orb=10, TI=2000 | 3.11% | 13.37% | -10.31% | 1.08% | 13.59% | -15.96% |
| FAM Model Phase, Orb=15, TI=2000 | 0.82% | 12.05% | -14.07% | 1.38% | 15.01% | -17.07% |
| Spectrum Model TI=1000 | 0.82% | -2.44% | 6.13% | 3.55% | 4.14% | 3.08% |
| FAM Model Phase, Orb=10, TI=All | 0.56% | 4.02% | -4.14% | -6.43% | -0.98% | -15.10% |
| Dynamic Model TI=750 | -0.49% | 3.60% | -5.10% | -2.45% | -2.80% | -3.16% |
| Spectrum Model TI=500 | -1.31% | -6.87% | 6.15% | 0.98% | 1.70% | 0.41% |
| Spectrum Model TI=50 | -1.75% | 5.71% | -9.84% | 4.37% | 6.39% | 1.95% |
| Ptolemy Aspects Model Orb=15 | -5.07% | -4.34% | -7.00% | -3.70% | -7.35% | -0.20% |
| FAM Model Phase, Orb=15, TI=All | -9.30% | -2.86% | -18.62% | -7.97% | -3.70% | -15.19% |
| Dynamic Model TI=All | -16.53% | -13.74% | -20.57% | -14.70% | -7.23% | -24.29% |
These are the best models:
| Model | NN (first 5218 pt) | NN (first 2613 pt) | NN (last 2607 pt) | LIN (first 5218 pt) | LIN (first 2613 pt) | LIN (last 2607 pt) |
| Terms/Faces Model TI=1000 | 31.01% | 39.80% | 18.36% | 19.78% | 32.93% | 1.76% |
| FAM Model Geo, Orb=10, TI=1000 | 29.62% | 32.58% | 23.97% | 27.59% | 32.80% | 20.17% |
| FAM Model Geo, Orb=15, TI=2000 | 28.55% | 28.84% | 27.09% | 26.24% | 26.58% | 25.15% |
| FAM Model Geo, Orb=15, TI=1000 | 28.12% | 31.29% | 21.90% | 25.11% | 30.42% | 17.79% |
Terms/Faces Model TI=1000: this is the newest model; it will be available in the Advanced version of Timing Solution. It is pure astrological model based on old techniques.
FAM Model Geo, Orb=10, TI=1000:
this model is based on geocentric planetary positions. It looks like for this
market the planetary position in Zodiac is important.
You can easily calculate the Neural Net projection line this way:
Set training interval to 1000 price bars.
The phase and Dynamic models look good as well:
| Dynamic Model TI=2000 | 15.94% | 22.18% | 9.38% | 8.92% | 12.60% | 4.34% |
| Dynamic Model TI=1000 | 12.80% | 15.67% | 7.99% | 10.42% | 9.79% | 10.25% |
| FAM Model Phase, Orb=10, TI=1000 | 12.25% | 14.62% | 8.04% | 7.22% | 7.46% | 5.39% |
| FAM Model Phase, Orb=15, TI=1000 | 9.13% | 11.12% | 4.72% | 4.96% | 5.10% | 3.18% |
Financial Instrument: GOLD
Analyzed 27 models
LBC Info: 3665 train/3864 test
Target: Rel. Osc.(1,50,50 Close,Exp)
| Model | NN (first 4079 pt) | NN (first 2044 pt) | NN (last 2037 pt) | LIN (first 4079 pt) | LIN (first 2044 pt) | LIN (last 2037 pt) |
| FAM Model Geo, Orb=10, TI=2000 | 10.05% | 16.05% | 4.95% | 2.85% | 11.98% | -6.29% |
| Seasonal Orb=15, TI=1000 | 9.64% | 0.32% | 17.63% | 9.56% | 0.90% | 17.09% |
| FAM Model Geo, Orb=15, TI=All | 9.09% | 15.82% | 5.23% | 7.51% | 13.41% | 2.87% |
| Terms/Faces Model TI=All | 8.65% | -0.88% | 11.61% | 8.49% | 2.70% | 9.12% |
| Seasonal Orb=10, TI=1000 | 6.04% | 1.93% | 9.56% | 9.08% | 0.69% | 16.39% |
| FAM Model Geo, Orb=15, TI=1000 | 5.97% | 8.36% | 7.76% | -3.13% | 10.88% | -10.41% |
| FAM Model Phase, Orb=15, TI=2000 | 5.92% | -4.02% | 13.33% | 4.38% | -6.18% | 13.43% |
| FAM Model Phase, Orb=10, TI=2000 | 5.28% | -7.68% | 16.30% | 1.39% | -8.06% | 9.81% |
| FAM Model Phase, Orb=10, TI=1000 | 4.97% | 0.19% | 9.17% | -2.08% | -2.59% | -2.00% |
| FAM Model Geo, Orb=15, TI=2000 | 4.83% | 10.91% | -1.13% | -0.38% | 5.51% | -7.14% |
| FAM Model Geo, Orb=10, TI=All | 4.55% | 3.73% | 4.98% | 3.72% | 2.57% | 3.15% |
| Dynamic Model TI=2000 | 3.93% | -2.09% | 8.52% | 0.96% | -1.66% | 3.10% |
| FAM Model Phase, Orb=15, TI=1000 | 2.91% | -2.28% | 7.98% | -3.35% | -0.23% | -6.95% |
| FAM Model Phase, Orb=10, TI=All | 1.88% | 6.27% | -1.48% | 5.95% | -4.45% | 14.27% |
| FAM Model Phase, Orb=15, TI=All | 1.34% | -4.91% | 6.63% | 0.17% | -2.30% | 2.32% |
| Dynamic Model TI=1000 | 0.88% | 3.17% | -1.16% | 3.17% | 4.76% | -0.02% |
| Spectrum Model TI=50 | 0.09% | -0.02% | 0.46% | 3.32% | -7.07% | 11.88% |
| Ptolemy Aspects Model Orb=15 | -0.90% | -2.86% | -0.34% | -0.90% | 1.57% | -4.48% |
| Spectrum Model TI=300 | -1.09% | 2.54% | -4.40% | -4.36% | -4.04% | -4.68% |
| Dynamic Model TI=All | -1.15% | -4.30% | 4.32% | 2.70% | -0.20% | 7.66% |
| Dynamic Model TI=750 | -2.40% | -8.16% | 1.36% | 4.80% | 3.57% | 4.51% |
| Terms/Faces Model TI=1000 | -2.41% | 2.43% | -6.81% | -3.45% | 7.22% | -8.93% |
| FAM Model Geo, Orb=10, TI=1000 | -2.97% | 1.20% | -2.90% | -9.15% | -1.92% | -12.82% |
| Terms/Faces Model TI=2000 | -5.21% | -1.89% | -5.75% | -9.96% | -0.22% | -15.19% |
| Spectrum Model TI=500 | -5.87% | -4.40% | -7.19% | -2.48% | -8.88% | 2.80% |
| Spectrum Model TI=1000 | -6.99% | 1.12% | -13.83% | -0.34% | 4.13% | -3.21% |
| Dynamic Model TI=500 | -11.31% | -8.81% | -12.48% | 3.75% | 6.93% | -0.18% |
For Gold prices, it looks like the planetary position in Zodiac is important.