Turning Points Astro Indicator
This module performs the statistical analysis of astrological phenomena. It calculates the statistical significance of different astrological/astronomical phenomena in respect to the turning points.
Let's consider one example. Download the Dow data from 1885 year.
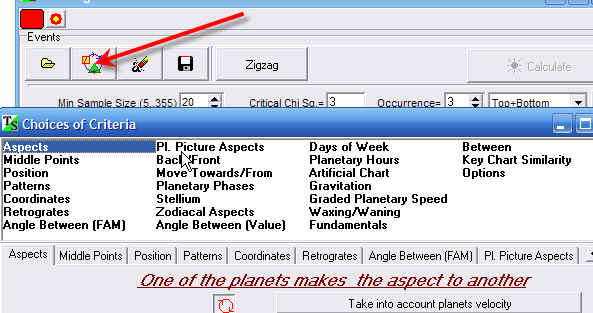
The first step is to define the astrological/astronomical phenomena. Click this button and highlight "Aspects" item:
You get the list of events:
Next step is to define turning points. The standard approach to identify
turning points is calculating "zigzag" indicator. Click here ![]() .
.
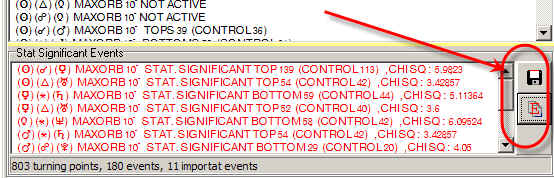
Now we are ready to conduct the statistical analysis. Click "Calculate" button. In a couple of minutes you will get report like this:
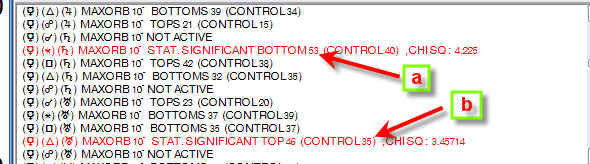
Statistically significant events are marked by red color here.
Event a) means that when Mercury makes sextile to Saturn, the bottom turning point is more probable. When this aspect took place, we had 53 bottom turning points, while if this aspect would be insignificant we should have about 40 bottom turning points (the control group).
Event b) means that when Mercury makes trine aspect to Saturn, we have more top turning points.
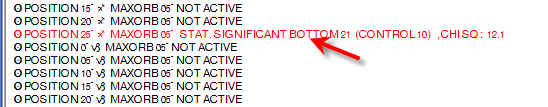
You can use other astro criteria. As an example, if you would like to research "active degrees", choose this item:
The program indicates that when the Sun ingresses 25th degree of Sagittarius we have more bottom turning points (21 bottoms, control group =10):
Midpoints:
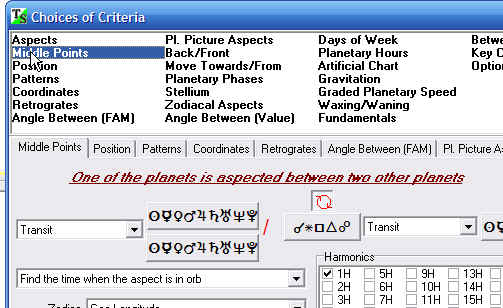
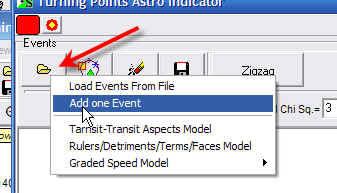
Clicking this button you can define more events:
For example highlighting "Rules/Detriments/Terms/Faces/" you can analyze turning points in respect to the planetary dignities:
The first red line means that when the Sun passes a term ruled by Mars we have statistically significant bottom (87 bottoms, control group = 67).
How to use all this information? First, it is a base for the forecast of turning points that you can see in the Main Screen:
The periods when this index is high (zone "A" on the diagram below) correspond to the periods when more phenomena tied with turning points occur; and low zones ("B') correspond to less phenomena occurrence:
Also you can save the most important events (statistically significant events) into some file or put them into the clipboard and after that use it with other modules of the program:
Now the question is what to do if the program does not find any significant events like this:
Here are some recommendations:
If this does not help, try to vary the statistical criteria here:
First of all decrease the Sample Size - we do not recommend to use it less than 10.
Second decrease Critical Chi Square - we do not recommend to use it less than 3,
However, before playing with statistical criteria, remember that decreasing any of these parameters makes the results less statistically significant.
Regarding statistically significant events and Chi Square, see this article: http://www.timingsolution.com/TS/Mini/16/index.htm#1