Timing Solution Scanner v.2
Scanning the stock is a very popular feature used by many traders. The general idea of all scanners is simple: sorting a group of stocks in regards to certain criteria and picking up the stocks that fit those criteria in a best way. Criteria (or filters) used for rating the stocks are very different. Volume and the stock price as well as the price change are among the most popular.
Timing Solution Scanner (TS Scanner, TSS) is a new level of the stock scanning. Together with standard parameters used in technical and fundamental analysis of stocks, TS Scanner provides an additional information regarding the stock's future moves. The program takes some group of stocks, performs a cyclical analysis for each item in the group and provides a list of stocks that you may consider suitable for your trading, with possible entry/exit dates. Standard parameters say about the stock's current "health", TS Scanner adds to that a "time" dimension.
TS Scanner is a stand-alone program. It is able to work with equities and some other financial instruments. TS Scanner Version 2 has a modified tool for downloading multi stocks from public sources (Yahoo) and improved features of the program itself.
(Disclaimer: Timing Solution Scanner does not provide any trading advice; it gives only some information to consider. It is totally up to you - what to trade and when to trade; the responsibility for the results of your trading decisions is yours, and yours only. Also, please that TS Scanner works with the data provided by a third party (Yahoo Finance), and that third party is responsible for the amount and quality of the initial data. ).
Video explanation: how to install TS Scanner
Video explanation: how to use TS Scanner
In brief, the process of working with TS Scanner is simple and consists of two major parts: a) feed the program with proper data; b) run the program to get a list of trading possibilities for a certain period of time and then monitor possible trades.
Let us look at it in details.
A. Feeding the data
The data source for TS Scanner v.2 is Yahoo Finance. As of April 2020, it works with stock data only, Stock symbols are the same ones provided by Yahoo Finance: https://finance.yahoo.com/
Important note: A dollar sign, "$" is used as a mark of money value. The same sign is used for stocks traded on NYSE and traded in France or some other country. If you work with templates for non-USA exchanges, $-sign means a price value as it is on Yahoo Finance at the date of updating a template. We are not responsible for the currency conversion.
To load the data, the open source software, Yloader, is used. You will use this program only when you run TS Scanner the very first time on your computer and every time you use a new template (see below).
First Run
1) Install YLoader program on your computer. This is the website to download this program:: https://yloader.com/ (The video above shows how to do that, the very first 50 secs ).
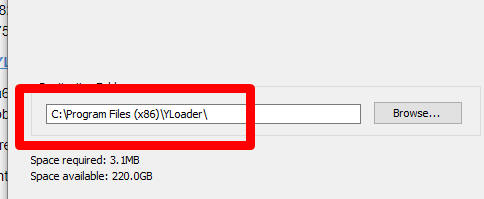
When installing YLoader, please pay attenttion to the folder where this program is installed. By default it should be this:
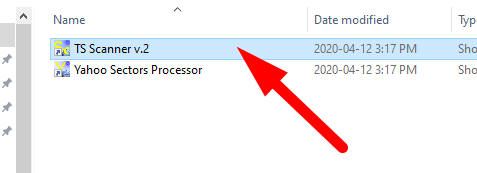
2) Run Timing Solution Scanner (TSS); it should be already installed on your computer.
Here it is:
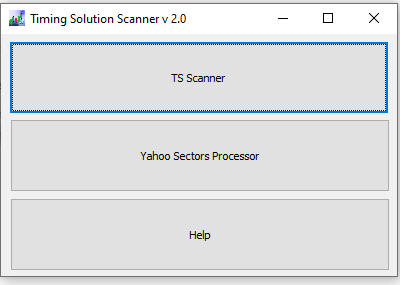
There are three panels there: the top one is the program itself (TS Scanner), the middle one serves for data feed; "Help" section contains this tutorial. We recommend to watch the video above that illustrates how to work with TS Scanner.
3) Start with running Yahoo Sectors Processor. You will get this window:
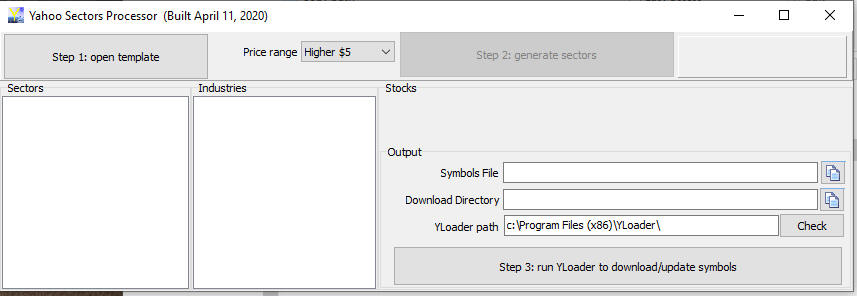
4) Only one option in this window is filled. Please make sure that the location of YLoader program is defined correctly; it is here:
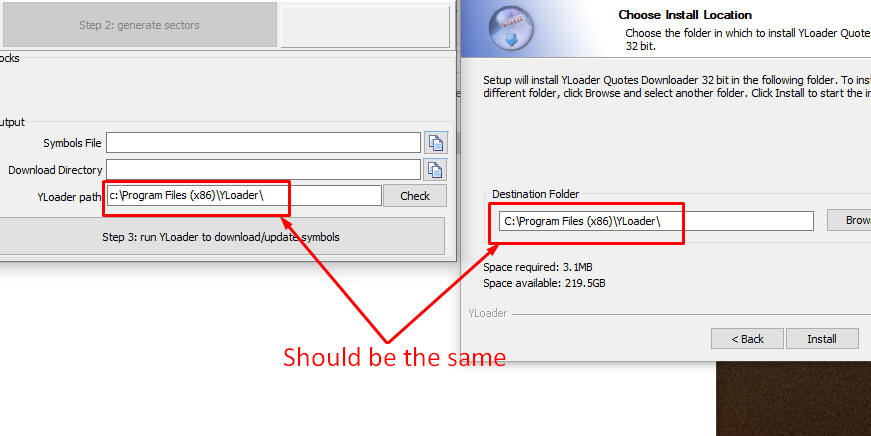
It should be the same "YLoader path" as the name of Destination Folder used when you installed YLoader program.
Click "Check" button. This prompt is displayed:
5) Yahoo Sectors Processor prepares inputs for TS Scanner. Yahoo Finance has thousands and thousands of tradables. Considering just stocks, there are stocks traded on American exchanges, on exchanges of different countries and regions, stocks belonging to different sectors of economy, with multiple industry divisions inside each sector. Add to that Small. Medium, Large Caps. And mutual funds, currencies, ETFs, commodities. This is a lot of tradables to choose from! That is why you need to work with Yahoo Sector Processor - to select groups of stocks for the analysis. For that purpose, TS Scanner has templates.
On Yahoo Sectors Processor, click  button.
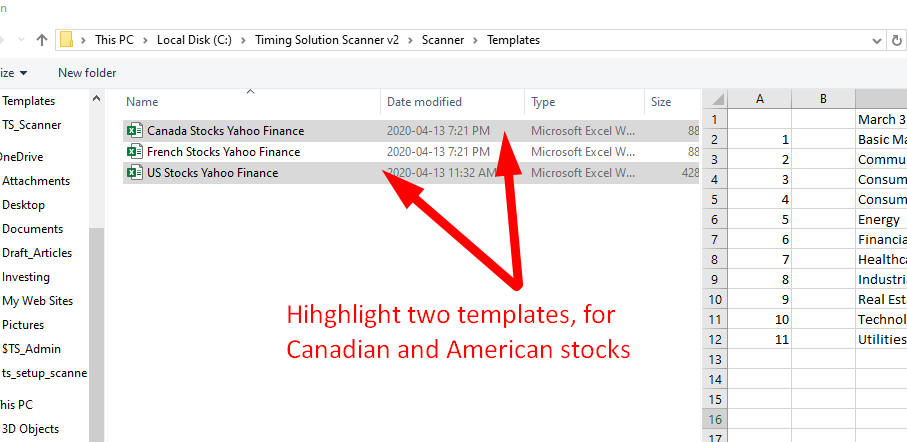
TS Scanner has provided several templates for your convenience. For a start, there are country-based lists of stocks. They are organized by sectors and industries as seen on Yahoo Finance website. You may download a template for a certain country (pay attention: some countries have several exchanges; though all stocks are in one list). Or you may work with templates for two or more countries at the same time. When using several templates at once, please remember that: a) you increase the processing time; and b) the stocks suggested for trading are traded on different stock exchanges. (More templates will be added. You will be notified by email when a new template is available.)
To download a template, highlight it by a mouse-click and then click "Open" button. To download two or more templates, highlight the first one, press Ctrl key and keep it pressed, then highlight other templates of your interest:
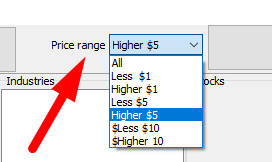
6) You may work with all stocks availble in the template/templates. Also, you can select the stocks of a certain price range. Do that here:
and click this button:
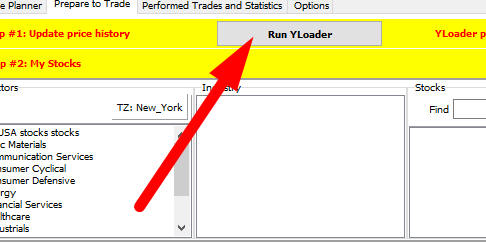
7) Click  button to run YLoader program
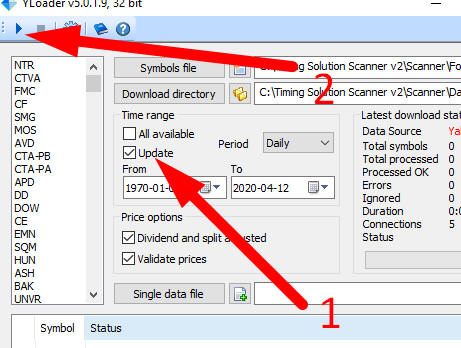
8) You are redirected to YLoader program. Define "Symbols file" and "Download directory" options here:
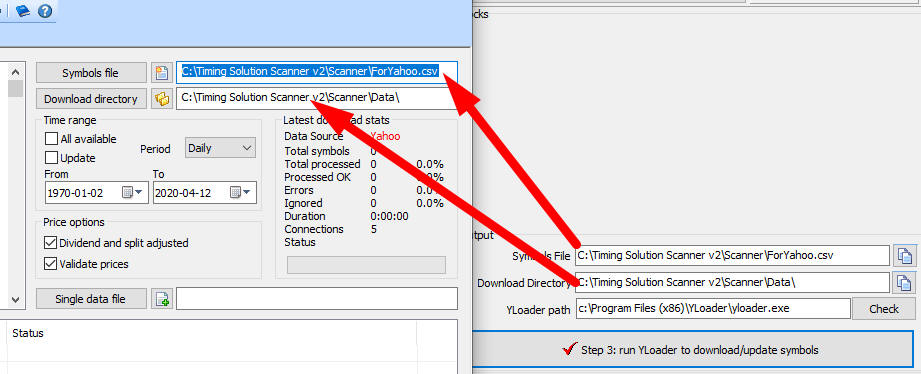
Make sure that they are the same as in Yahoo Sectors Processor. You can type the names of the file and directory by yourself. Or, while you are still in Yahoo Sectors Processors, to speed up this procedure, you may copy them into clipboard using these buttons:,
and paste these values into YLoader.
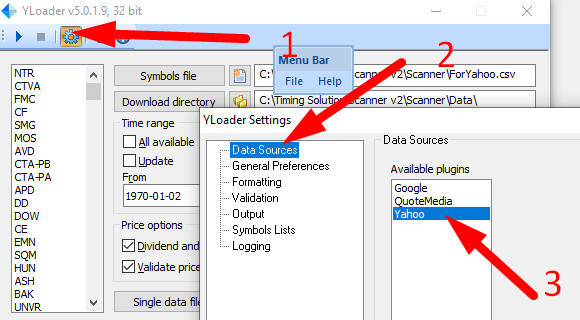
9) Now we work with YLoader. Make sure that the Data Source is Yahoo :
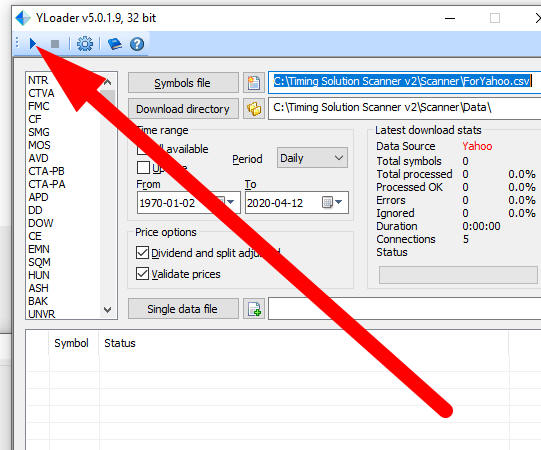
10) Download Yahoo symbols by clicking this button:
A reminder: Internet should be available on your computer.
You are all set to work with your data in TS Scanner.
Updating the Data
You have to use First Run procedure only when running TS Scanner the very first time and then every time when you use a new template. You have no need to repeat all those steps 1 - 10 when you want to have the most recent quotes. You will update the data directly from TS Scanner (TSS).
Steps to update the template:
1) Run TS Scanner
2) Click this button:
Check the option "Update" and then the Download button:
Creating/Modifying a Template
There is a list of templates to choose from. Templates are made by regions/countries. Some stock templates include stocks traded at several stock exchanges of that region/country. You can modify an existing template or create your own that contains stocks or other financial instruments of your choice. Please see this video how to do this:
Working with TS Scanner
TS Scanner performs stocks scanning to recommend the stocks that are suitable for trading within a certain time period. Version 2 (April 2020) works pretty much the same as the Version 1 (2015-2016). The main differentce is in the part of downloading Yahoo data for analysis (see "Feeding the Data").
Here is the opening window of TS Scanner v.2:
You are already familiar with Yahoo Sectors Processor. Using its templates, you have downloaded some data to YLoader.
Let us work now with the top panel, TS Scanner.
Click on it to open the main window of the program.
There are four tabs there related to stages of your activity: Trade Planner; Prepare to Trade; Performed Trades and Statistics: and Options.
When you get used to working with TS Scanner and have some open trading positions, - the first tab, Trade Planner, will be the first thing that you will start your next trading day. It will be described later.
If there is no open position and you look for new opportunities to trade, start with the second tab, Prepare to Trade.
Prepare to Trade
Here you will perform a preliminary analysis to get candidates for your possible trades.
It opens automatically when you click "TS Scanner" (see the picture above). It is empty for now, except the name of the YLoader path and the sector's list to be analyzed.
Below are the steps to work with it:
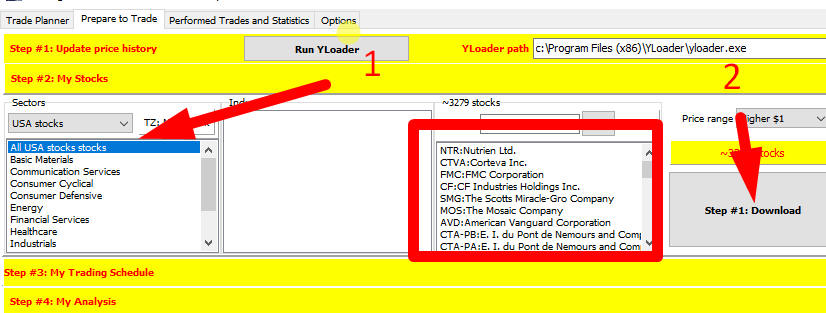
Step #1. Update price history and Download Stocks
Choose the stocks you want to analyze. It could be either "All stocks" downloaded or stocks included into some sector of the economy or an industry inside the chosen sector. (A note: The program will show the sector and industry only if there are any stocks of the price range that was chosen in Yahoo Sector Processor; it is in the Step 6, First Run section. If you choose a price range "Higher than $50" and there are no stocks of that industry traded on the chosen stock exchange, there will be no positions there.)
In the example below all available stocks are chosen (American stocks); there are 3279 stocks to anayze:
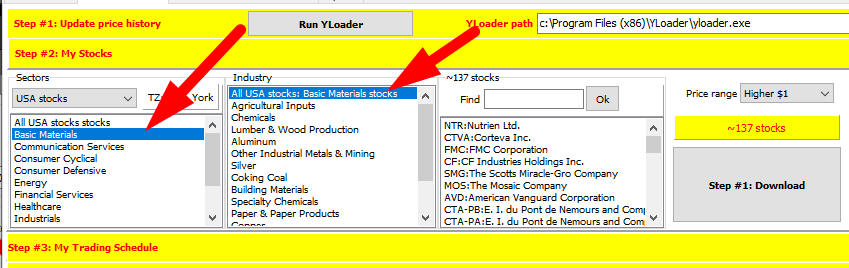
Another example shows downloaded Basic Materials sector. Compared to the previous example, the program will analyze 137 stocks instead of 3279:
The example used in the opening video shows 764 stocks. It is the amount of stocks to apply cyclical analysis filters.
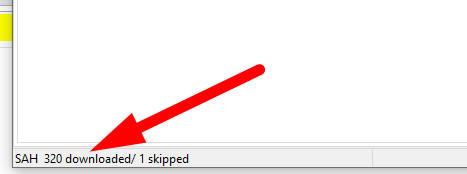
As soon as the stocks are defined, click "Download" button. The program begins downloading the stocks information. The amount of stocks being downloaded is shown here, in the left bottom corner. It is changing till all stocks of this sector/industry are downloaded:
Step#2. My Stocks
All downloaded stocks are shown in the Main window of the program, right under the Calendar.
Now, the real job is starting. Please see Video 2; it shows how to perform the scanning of all these stocks.
You should define the period when you plan to trade, your trading schedule. These are potential dates when you may decide to open your trading positions.
To do that, put the mouse coursor to the first day when you plan to trade and drag it to the date when you want all these trades be over.
Pay attention to the parameter "Transaction Length". This the time you feel comfortable to keep an open position. You can set it manually. (A note: Default setting is more suitable for swing trading. If you want to involve the Moon based models, please change the default setting for no longer than 14 days (half of the Moon period)).
When that is done, click OK button:
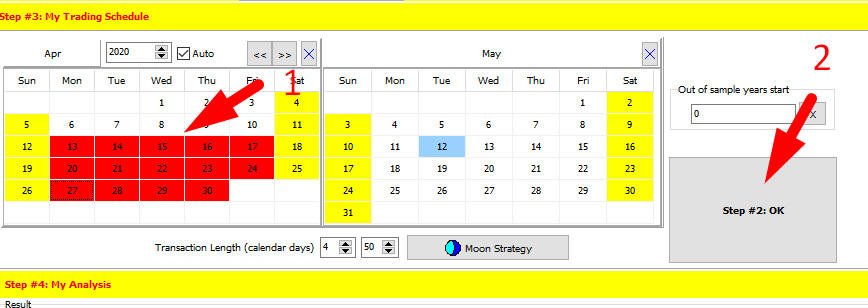
Step #3. Trading Schedule
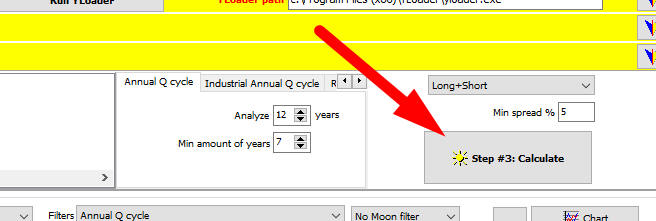
There are several options that are set by default. You may want to play with:
a) the amount of years to observe the Annual cycle and the minimum amount of years (that one may be critical for new stocks; by default, min is 7);
b) trading strategy (going long or short, or both);
c) the spread value.
Click "Calculate" button:
The program conducts cyclical analysis trying to find the best predictable zones for each stock inside the chosen trading interval. Available cyclic filters include the Annual cycle for each stock defined in Step #2 and its combination with the Annual cycle for the industry as well as with some technical analysis indicators. Moon based cycles (Moon filter) can also be included.
As the result, you get a list of ranged stocks that you may consider suitable for your trading within your chosen interval:
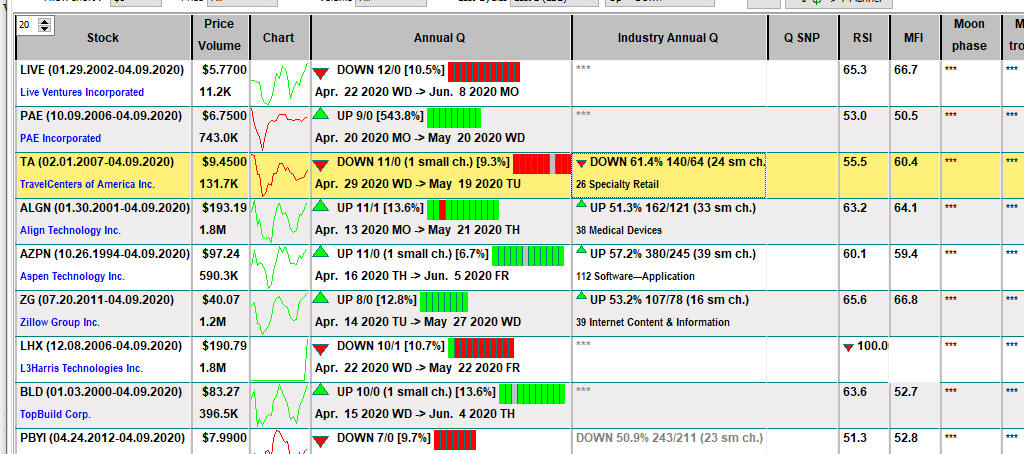
If some cell in a row/column is empty, it means that there is not enough data for that item. The stock may be recently listed and not having enough price history; the certain industry may be not presented in some exchange, etc. Please remember that TS Scanner is able to work with the data provided by a third party (Yahoo Finance), and that third party is responsible for the amount and quality of the initial data.
You can click on any row, to highlight it and to consider its fitness for your trading
What does it show?
Look at the highlighted row in the picture above. You can see here:
- the stock symbol (TA; symbol according to Yahoo Finance);
- the data used for the analysis, the price history for this stock (data available since Feb.1, 2007);
- the name of the stock (Travel Centers of America Inc);
- the stock price at the time of the latest data update ($9.45 per share) and the volume of trades (131.7K shares);
- Chart pictogram that shows a piece of the stock's price chart for the last 20 bars ("20" is shown in the left upper corner);
- the next three columns are results of cyclical analysis. Annual Q shows the annual pattern for this stock. The stock's price in the example has a tendency going down from April 29 till May 19. This tendency was observed for 10 years of 11 (the red stripes say about that) with 1 neutral year (the grey stripe). % in brackets shows the average price change for the selected period. Double-click to see the stock's Price Chart; there you can see the stock's performance inside this predictable zone for previous years and the details of the trades if you would follow the suggested trading strategy;
- Industry Annual Q cycle analysis results (the stock in the example belongs to Specialty Retail industry, that has 26 stocks in total. If Annual Q and Industry Annual Q show the same tendency, you may want to consider this stock for your next trade;
- Q SNP shows the tendency for S&P500 Index for the same interval;
- RSI (Relative Strength Index), it shows strength or weakness of the stock (RSI over 70 means that the stock is overbought, and its price may go down. RSI below 30 means that the stock is oversold, and its price is expected to go up. In the example RSI is 55);
- MFI (Money Flow Index; pretty much the same as RSI, though the values are 80 and 20 instead of 70 and 30 respectfully; it seems that RSI is more reliable);
- two last columns show the results provided by Moon cycles.
What to do with all these stocks?
You may sort them:
- alphabetically;
- in regards to Annual or Industry Annual preformance;
- by RSI or MFI;
- in regards to price values (do not forget to set a limit to the price for short trades) or volume;
- using filter combinations;
- in regards to up or down moves tendency
- and other details.
This is the recommendation when choosing the stocks for your possible trades:
1) Start with the Price range. It helps to define how many shares of this stock you would like to trade;
2) Look at the volume. You do not want to buy a stock for a window of 1 week if it is just a hundred shares on the market. 1 M is preferable in this situation;
3) Look at colors. Chart picture, all cyclical analysis columns of the same color is an indication to a good trading opportunity;
4) Consider the information in the Annual Q column. You would prefer to see the bars of the same color (all green or all red, or the most bars are green or the most bars are red). If there is a mixture (as an example, of 12 bars 10 are green and 2 are red) consider the stock with more bars of the same color in the end (it is better if 2 red go first and then 10 green are go, it means that the latest tendency for the last 10 years is going up for this predictable zone);
5) Consider if the Annual Q and Industry Q (and Q SNP for American stocks) show the same tendency;
6) Check if this tendency is confirmed by RSI and MFI (mostly by RSI).
7) Now, you think that this stock is worth to trade. Double click on it (on this row). Select Price Chart and Details. Look at the chart, with a special attention to the stock's performance on that same predictable zones in the previous years.
You may not find any stock that you would like to trade within your potential trading period. If it is the case, select another interval. Or try another industry, economy sector, stocks traded on another exchange. Or you may want to repeat the whole procedure for a new template.
If you decide that you want to trade this stock, after double-clicking, select "Plan to Trade" option.