Timing Solution Mobile Help
Timing Solution Mobile can be accessed at: timingsolutionmobile.com
Logging in
Enter your email and password as in the email you have received after purchasing Timing Solution Mobile.
You will be redirected to the main window of the application.
Changing Password
The password provided can be changed on your User Page. Your User Page is a snapshot of your TS Mobile account. It shows stocks and/or portfolios included in your account. There you can also edit or change your User Info and Password.
To access User Page, click on the  button in the top right corner and select “User Page”.
To change the password, enter your old password in the area at the very bottom of your User Page, titled “Change password here”. Then enter the new password you want as a replacement.
Click  button to set your new password. You will get an alert notice that the password has been changed. Use this new password to log in to the application
Working with Timing Solution Mobile
Timing Solution Mobile is a combination of two different approaches. One employs TS Scanner functionality and is focused on finding financial instruments that you may want to trade. The other allows to do basic analysis of an individual instrument selected by you. If you would like to do more thorough analysis of some instruments or apply more modules, it is better to do with Timing Solution software at timingsolution.com
Finding Tradeable Instruments
TS Mobile offers Timing Solution Scanner functionality to find instruments that you may consider trading.
This feature appears immediately after logging in to the application and can also be opened through the Menu (select ‘RECOMMENDED’ from there).
This is the default screen you see after logging in to the application:
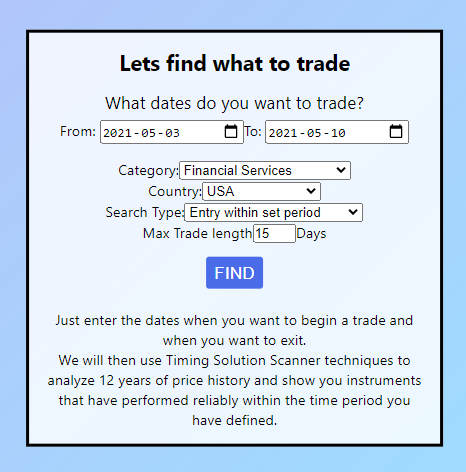
To use this feature, fill out the form you see above:
- Enter the dates you wish to enter and exit a trade
- Select the category of instruments you are interested in. Selecting ‘All’ means that the program will look for instruments across all categories.
By default it is set as ‘Financial Services’. - Select the country where your desired exchange is located. Selecting ‘All’ means the program will look for financial instruments worldwide.
- Select the Search Type you want. There are three types of search you can specify:
- “By Entry and Exit dates” – this mode will find any predictable zones that start close to the date you specified in the “From” field and end close to the date you specified in the “To” field.
- “Entry within set period” – this looks for any predictable zone with entry date between “From” and “To” dates, and that last up to the Max Trade Length specified in the next field. In the picture above, TS Mobile will find instruments with a predictable zone starting between May 3rd and May 10th, and lasting up to 15 calendar days. The result of that search is shown further below.
- “All zones within set period” – This mode finds any predictable zone that starts and ends between the dates you have specified. Length of the trade does not matter in this case.
Once the form has been filled out, click the  button. A list of results will be shown in a screen like the one below:
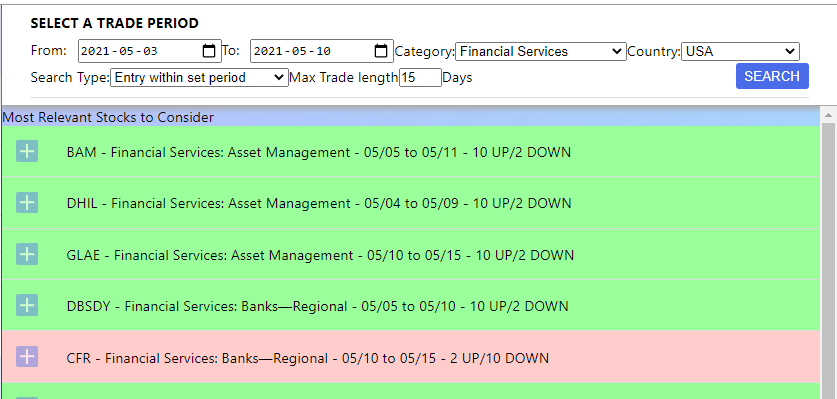
At the top of this screen you see a different version of the previous search form. All the fields are the same, just laid out differently. You can use these to change or correct your search parameters.
The results of your search are shown under the line ‘Most Relevant Stocks to Consider’
Each result shows the following:
- Instrument Code (a Yahoo Finance symbol, a ticker) with the exchange notice whenever it is needed.
- Instrument Industry and Sector (if you selected Forex, Commodities, Indexes, or Treasury, this will display the name of the instrument)
- Start and end dates of the closest predictable zone in MM/DD format.
- Number of observed trends over a 12 year period
- Color indicates the trend observed (Green – Close price is higher than Open price, Red- Close price is lower than Open price)
Clicking on a result will open the instrument detail page.
Instrument Detail Page looks like this:
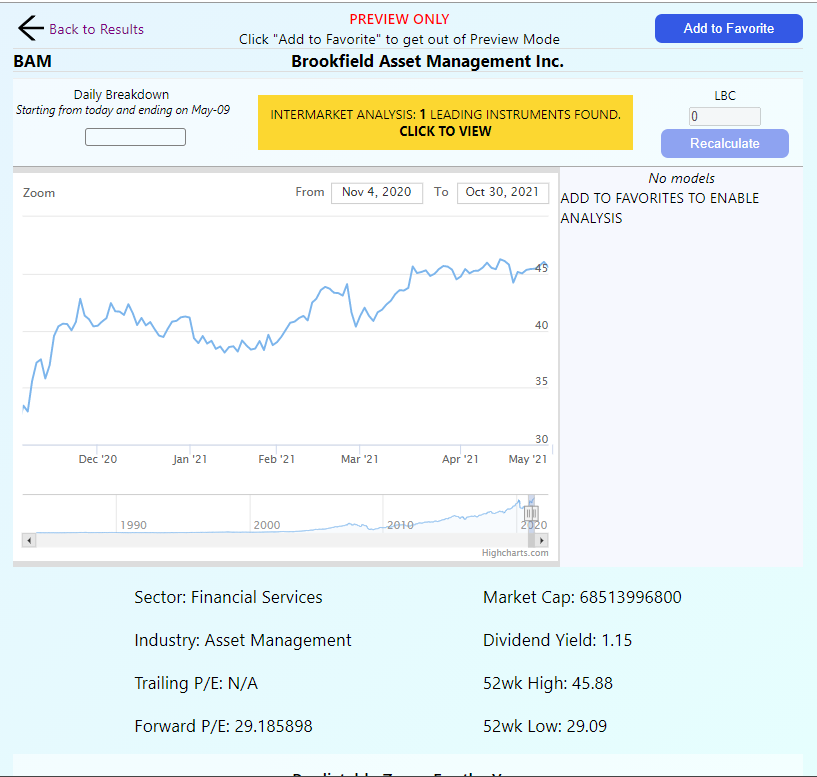
Let us break down this screen into pieces:

- On the left is the Back to Results button. This is only visible if you are viewing an instrument after doing a Search or using “Recommended” option
- "Preview Only" tag appears if this is not in list of your Favorite instruments that you are tracking.
- "Add to Favorite" button will add the instrument to your personal list, so you can always watch it and do some of the basic analysis on it.
- Instrument code and name are also displayed in a separate line
When you click "Add to Favorite" button, this area will look like this:

The “Back to Results” button is now replaced with “TS Experts”. Clicking on it will display different analysis methods we offer for this Instrument. Currently we offer Intermarket analysis with more methods to come.
At the center you will see the code and the name of the Instrument.
On the right side is the “Add Model” button. This allows you to do basic analysis on the instrument using some of the popular techniques of Timing Solution software.
Click on each instrument to get more information in the next section:
Next section looks like this:
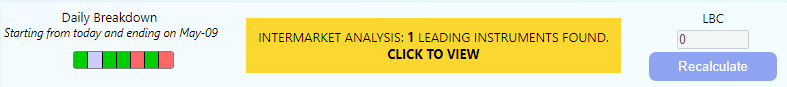
This section has three parts:
- Instrument's general behaviour on a daily basis. This area is broken down into 7 elements, representing 7 days starting with today. Each one of those shows how the instrument has generally behaved on this day over the last 12 years (if the instrument has less that 12 years of data, all price chart data is shown). Green color means that statistically, the selected instrument has had more positive moves than negative ones on this day. Red means that more negative moves have been observed. Blue means that an equal amount of positive and negative moves has been observed on this day over the last 12 years.
- At the center is the result of Intermarket Analysis for this instrument. In this example there is one Leading Indicator. Clicking on the yellow area will open Intermarket Dialog which is covered below. More information on Intermarket Analysis can be found here.
- LBC setting. This allows to set Learning Border Cursor for your Models on this Instrument. This area is only available when the Instrument is in your Favorites list. When the LBC number is changed, “Recalculate” button will become active and clicking it will cause TS Mobile to recalculate all the models for this instrument. Once that is complete, updated results will be displayed. You can read more about LBC and Non-Future Leaks Technology here
Next section is the price chart data:
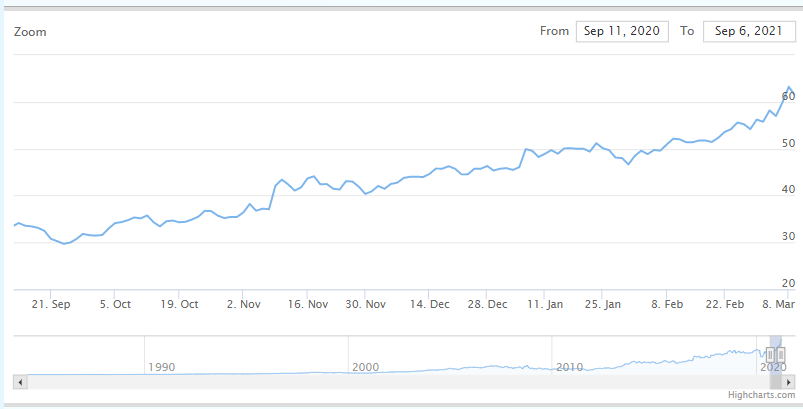
It shows the most recent price history. In the top right corner you can define the dates to display the price data.
On the bottom there is the navigation bar:

It shows an ‘eagle-eye’ view of the entire price history of this instrument. At the very right you see an area highlighted in a darker color with two buttons on each side:

Click and drag these buttons to change the area of the chart you want to display.
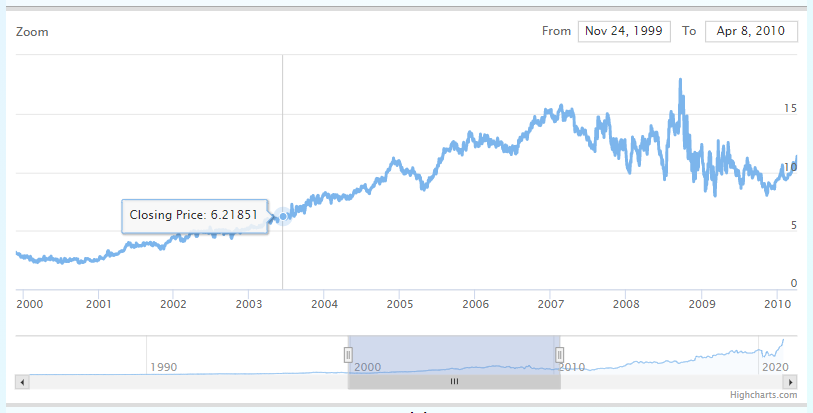
For example, those buttons have been moved to focus on the history from 2000 to 2010 to produce a chart like this:
Model Area
To the right of the chart there is a Model Area. On Mobile devices it is below the main chart. As you add models to your Instrument it will look something like this:
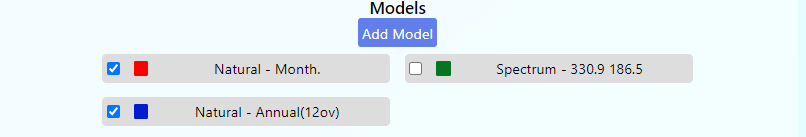
Each model has the following elements:
- A checkmark that makes the model visible or invisible on the price chart.
- A square that shows the color of the model on the price chart
- Model Type and its basic parameters. There are three model types, and each one has specific information in its heading:
- Spectrum model will have “Spectrum” name with the selected cycles listed next to it. In the example above, Spectrum model has two cycles selected one at 330.9 days and another at 186.5 days
- Natural model will have “Natural” name with the type of model used. In the picture above, first Natural Model is Monthly cycle, and second Natural Model is an Annual cycle with 12 Overtones.
- LE is the Intermarket results chart (LE stands for Leading Indcator). This allows you to compare the behaviour of your instrument versus the selected Leading Indicator instrument. On the Model list it will have an “LE” name, followed by the code of the instrument being compared and its similarity value “R”.
Clicking on the model outside of the checkbox will open the dialog to edit the model
Under the main chart there is the Basic Info Section:
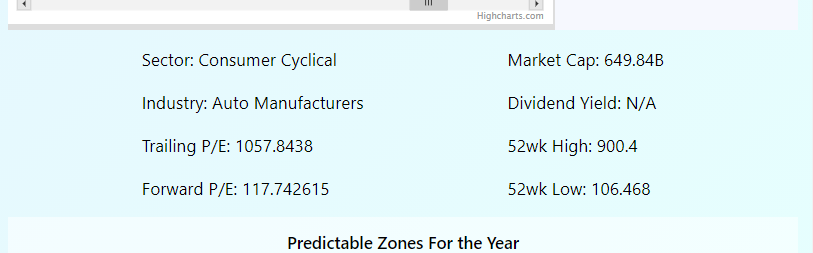
It lists some of the basic information for the instrument you are looking at.
Predictable Zones
The final area of the Instrument screen is the Predictable Zones:

This lists ALL predictable zones found for this instrument, showing the UP or DOWN trend and the dates when this trend has been observed.
Click on any of these lines to see more details for each observation year by year, like these:
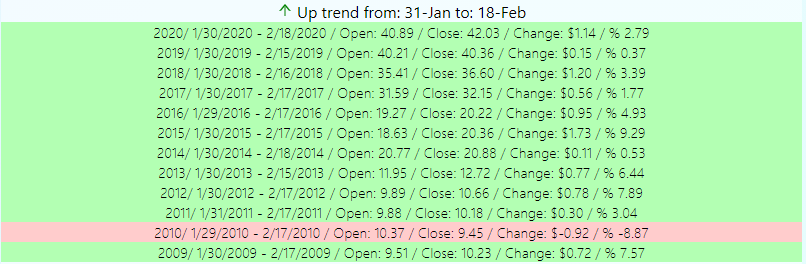
It shows the analysis by each year and what has been observed.
Each line shows the year, the dates of the observation, Open and Close values as well as the change in both currency value and percentage.
In the example above we can see that for 11 out of 12 years, an upward price movement has been observed for this instrument while the downward movement has occurred only once, in 2010.
Working with Models
TS Mobile offers some of the basic features of Timing Solution for financial instrument analysis. This feature works only with instruments you have added to your Favorites and cannot be used with instruments in ‘Preview’ mode.
Currently Natural cycles (formerly Astronomical cycles) and QSpectrum models are available.
To Add a model, click the  button. You will see the following dialog:
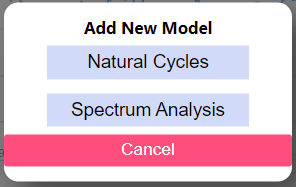
Here you can select the model type you want to add.
Natural Cycles
Clicking Natural Cycles will open a dialog like the one below:
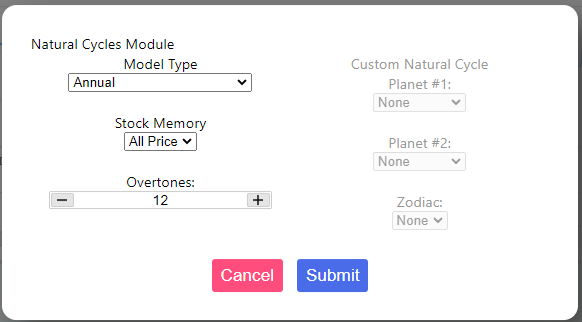
Here you can specify the parameters of the Natural Cycles Model.
Model Type shows the most common types of Natural cycles. Clicking on this dropdown menu gives you all common options available in this application.
You can also define the parameters that are important for this model. FOr Natural Cycles Model, these are Stock Memory and number of Overtones.
If you prefer to work with a customized cycle, select ‘Custom’ from Model Type dropdown menu. It activates the area on the right where you can specify the two planets and the type of zodiac specific for the cycle that you want to explore.
Clicking Submit button adds this model to your instrument analysis, and it will be displayed on the price chart.
Spectrum Model
This is a mobile version of the QSpectrum module used in Timing Solution Software. If you are unfamiliar with QSpectrum, you can learn about it here
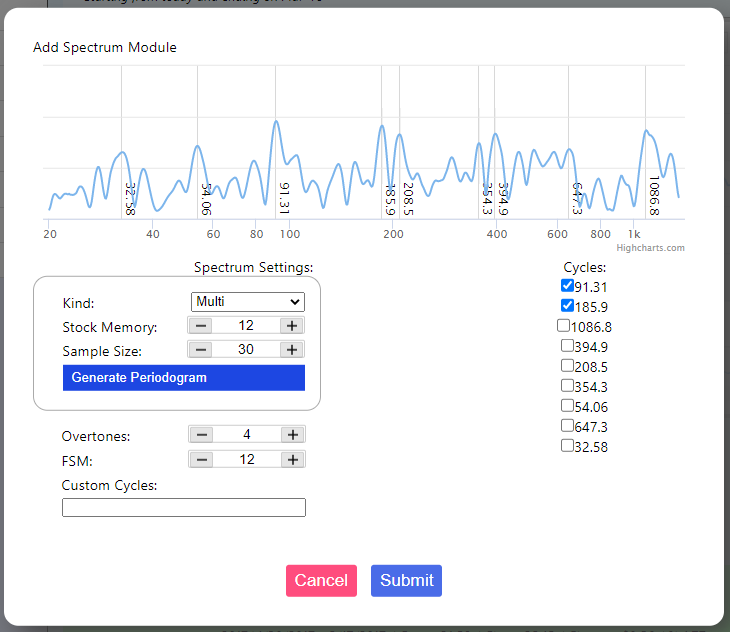
When you first open Spectrum Model Dialog, be prepared to wait a few seconds for the program to do some preliminary calculations. Whhen that is done, you will see something like this:
In here, just like with Natural Cycles model, you can specify the parameters of the Spectrum model though with a few important differences.
The parameters you may want to change are provided in two separate sections. You can change any of them and then click on Submit button to activate the model. Just remember that changing anything within the outlined box (i.e. items like Kind, Stock Memory and Sample Size), will require a recalculation of core parts of the model. After changing these three parameters, click ‘Generate Periodogram’ button to recalculate. Otherwise, clicking Submit button will not do anything.
Changing Overtones and FSM does not require a model reload.
On the top of the screen there is a periodogram:
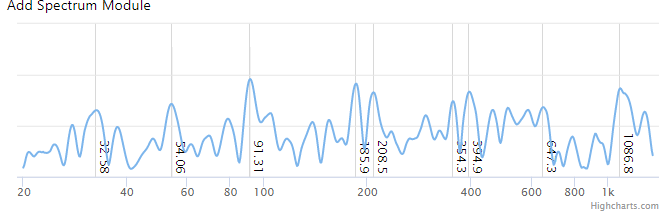
This is very much like the Spectrum periodogram seen in Timing Solution software. It shows the strength of different cycles, therefore same rules apply when selecting cycles here.
Vertical lines on the chart also pinpoint the strongest cycles and their periods.
On the right side of the dialog there is a list of 9 strongest cycles provided by the selected model. They are ranked from strongest to weakest. Selecting the checkbox near a cycle will include it in the final projection line calculation. De-selecting that checkbox will exclude the cycle from the projection line calculation.
If you want, you can add your own custom cycles. The field for that is in bottom left part of the screen. Enter custom cycles here separated with @ symbol. Here is an example of a custom cycle entry:
204@126@732
Once that is done, click Submit to close the dialog. The Spectrum model will be displayed on the price chart as a projection line.
Intermarket Analysis
This is accessed by clicking the yellow area labelled “Intermarket Analysis” or by selecting it from TS Experts menu. The window looks like the one below:
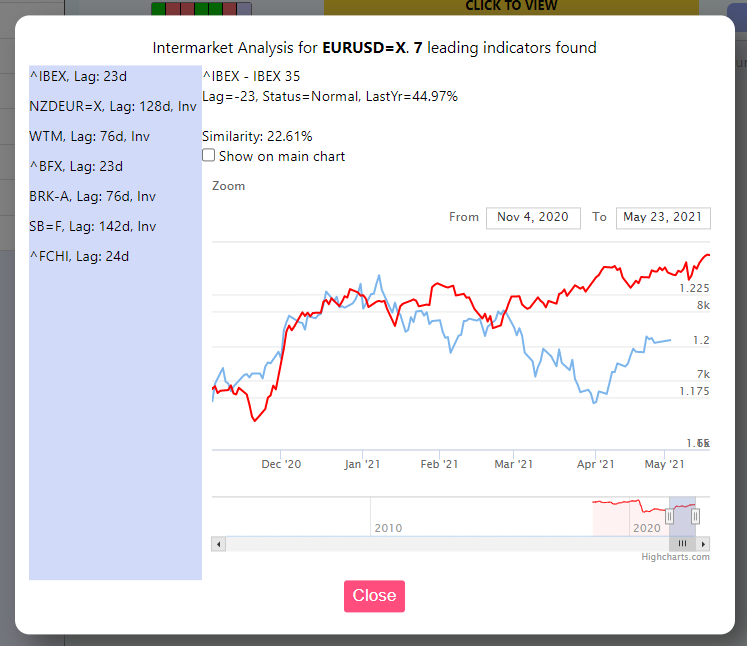
On the left of this screen, there is a list of all the Leading Indicators found for this particular instrument. Each entry includes the ticker code for the instrument, its Lag in days and if it is Inverted it will have “Inv” mark near it.
To the right of the list is the main area that shows Leading Indicator data and the related price chart.
At the top you see the Indicator Code and name, below is the related data, such as its Lag, Status and Similarity over the last year.
The chart below shows how this Leading indicator looks compared to your instrument. The instrument data is the one that is downloaded already, while Leading Indicator data is for the last two years.
“Show on main chart” checkbox allows you to display this Leading Indicator as a part of your models. This allows you to compare multiple Leading Indicators and see how they behave relative to the models you have created.
Editing Models
When you click on a model that already exists, a dialog opens with that model's parameters. The appearance of this dialog is different depending on the type of model being edited. Refer to the sections above on guidance how to use them
Searching for Instruments
Along with Scanner functionality, you could also search for a specific instrument.
From the Menu, select ‘SEARCH’. Your page will look like this:
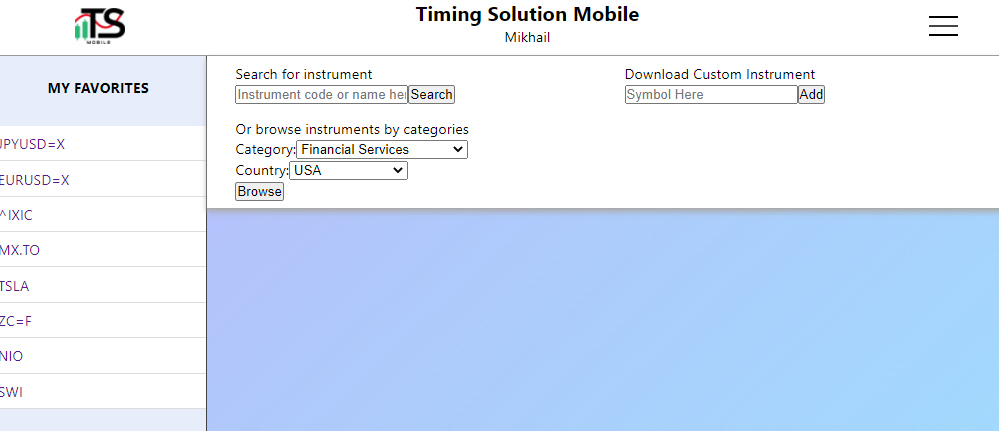
There are three ways to find an instrument:
- Enter its identifier/symbol, its name, or part of its name in the search field that is near the ‘Search’ button. You will see all instruments that match (fully or partially) the search term.
- You can select a country and category. The related list of instruments will be shown.
- If you cannot find your desired instrument using the above two methods, you can download it using the “Download Custom Instrument” option. Simply type in the code of your instrument and click “Add”. Text will appear below indicating the status of your request. When the status is chhanged to “Success”, you will also see your Instrument added to the list of your Favorite Instruments and available for Model Analysis right away.
Licensed Timing Solution Primo and Advanced owners can also upload their instruments directly from Timing Solution. To do so, once you have loaded your instrument into Timing Solution, click on “File” and select “Timing Solution Mobile”. You will see a window that looks like this:
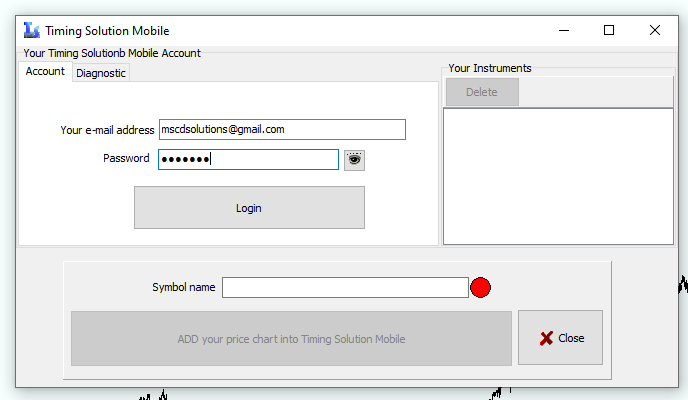
Enter your email and password used to log in to TS Mobile, and click Login. Upon successful login you will see a list of your instruments to the right.
Now you need to enter the name of your instrument in the “Symbol name” field and click the button below. This will upload your instrument to Timing Solution Mobile and you will be able to work with it from there.
If you type the name that already exists, then the original data file will be overwritten with the new data you currently have in Timing Solution.
About Custom Instruments:
- As soon as your instrument is in TS Mobile, you can begin basic analysis of it. You can use Natural Cycles and QSpectrum modelling on it immediately.
- TS Expert functions, such as Predictable Zones analysis or Intermarket analysis, are not available right away. You will have to wait up to a day for these results to show as we run the analysis of your instruments. When TS Expert module is finished processing your instrument, you will see the results of that on the Instrument window as usual.
- You are currently limited to only 10 Custom Instruments per User. This is a technical limitation that will be gradually lifted.