Making a forecast based on astronomical cycles
Items Covered In this Section
Introduction
The models based on astronomical cycles are the most interesting models in Timing Solution: they are the most demanded and the most controversial at the same time. The reason why these models are so popular is because astro cycles are a naturally established base that can be used to compare to any process unfolding in time. They are controversial because, from the scientific point of view, we do not know exactly what is the relationship between planetary movements and stock market behaviour. We can provide the statistic information that Annual cycle works for stocks, or Moon synodic cycle works or Venus synodic cycle works for currency market. We know how these cycles relate to market movements but we do not know yet why they work this way. At this point astro based forecast is a phenomenological theory like metallurgy or medicine two hundred years ago: we have evidence, some practical observations that can be used, though no comprehending theory that describes "how" and "why".
Astro cycles are different than fixed or dominant cycles as discussed earlier. Fixed cycles are even in time. They make the same phase in the same period of time. It is always possible to find a harmonic function that describes a fixed cycle. That is why scientists and researchers love fixed cycles, as there is the whole theory of cyclical analysis that explains how to work with them. However, the cyclical analysis is not applicable to astronomical cycles due to their nature. Astronomical cycles are based on an object's movement around a center. Each astronomical object (a planet) moves around over and over on the same orbit. This motion is affected by other celestial bodies through gravity. Add to that different coordinate systems, and the simple equation of one planet's movement around a center becomes a very complicated one, involving multiple factors. The good part is that we always know where the planet is supposed to be at any given moment. We can use this knowledge in relation to some process in time (like stock market movements) and make a forecast. This is the best part in using astro cycles for financial markets.
The two simplest astronomical cycles to use are the Sun and the Moon cycles. It is easy to predict the Sun position in the sky as its movement has been observed for thousands of years and is described by astronomy equations. The same is true in regards to the Moon cycle: it orbits the Earth and hence it is easy to predict its position as well. However, a lot of astronomical cycles for trading have to do with the planetary position relative to the Earth, and because those bodies orbit the Sun, these cycles become uneven in time. They change based on the position of both the Earth and the other planet relative to the Sun. It can also be done with asteroids or any body that orbits the Sun. Using Timing Solution, we can study different Astronomical Cycles and observe if they correlate to any market movements.
The projection lines applied in this module are based on the assumption that planetary positions or angles between the planets are in some way related to the stock market movements. This does not mean that the market moves because of the Sun in Libra or because of the Mercury - Mars trine. We do not know how the links between the planets and the market actually work. However, we can state that some connection exists between markets ups and downs and the mutual disposition of the planets in the sky above. The statistics is behind this statement.
Astronomy Module Basics
After downloading the price history, we are ready to get the first projection line based on astronomical cycles. Click the "Astronomy" button:
By default, Timing Solution calculates the Annual cycle. It is one of the most important cycles that has been observed. It appears in the Main Window and is called "Composite diagram for Annual cycle":
These curves show the average price movements as the Sun is passing through different Zodiac signs. This is a natural cycle that we all know too well - it is a year formed by the Earth moving around the Sun. A composite diagram of Annual cycle for some financial instrument represents the works of the Annual cycle as a seasonal portrait of that financial instrument. It may serve as a hint to future movements of its price. However, this is not the exact forecast, it shows only some tendencies, the most typical for that financial instrument, in regards to the movement of the Sun. In the example above, these tendencies are the September drop (when the Sun passes Scorpio sign) and the Christmas rally (the Sun leaves Scorpio and goes through Sagittarius):
Now let's look at the Main screen:
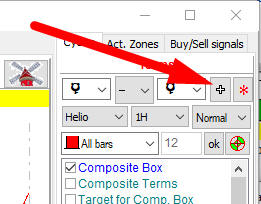
The green curve shows how the Annual cycle works in time. To display this curve together with the price chart (instead of separate panels for each one), click this button:
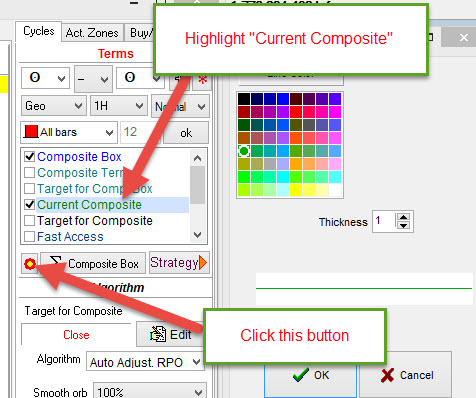
To change the color and thickness of this projection line, highlight "Current Composite" item and click ![]() button:
button:
Timing Solution is able to work with any other astronomical cycle. As an example, it is possible to analyze the angle separation between the Moon and the Sun and its relation to the price movements, i.e. the Moon phase (synodic) cycle:
Below is the composite diagram for the Moon phases, or the Moon synodic cycle:
It shows that on average the price (DJIA in this example) reaches its high around the New Moon, then it goes down until the Moon - Sun angle separation reaches 290 degrees (i.e. one week before the next New Moon), and after that it moves up till the next New Moon. This information can serve as a base for the forecast. The program also displays on the Main screen how the Moon phases cycle works in time:
Astronomy provides a lot of options for this type of analysis. In addition to different astronomical objects and their combinations, it is possible to use different Zodiacs (why not? they are nothing else but different coordinate systems to observe the same planetary movement). See the cycle related to changes in a heliocentric position of Mercury:
"Mercury-Mercury" above means that the position of Mercury is being analyzed. This is how Mercury heliocentric cycle works (it is approximately an 88 day cycle):
As with previous examples, the good part is that the astro cycle's curve can be prolonged into the future thus creating a projection line.
When the planets/Zodiacs are changed, the program redraws the projection line automatically.
The Main Rule: Sufficient Amount of Price History
While working with astro cycles, always keep in mind the period of analyzed astro cycles. This is very important information and is seen at the top line in the Composite module:
Here the program shows the period of the analyzed cycle (Mercury heliocentric 88 day cycle in this example) and the amount of full cycles that this cycle has made within the analyzed period. In this case, 32 years of price history data has been downloaded. Within this time span, Mercury has made 131 full cycles around the Sun.
The rule is: to analyze any cycle you should have at least 3 x Period of price history data, or more. For example, analyzing the Annual cycle you should download at least 3 X 1 year=3 years of price history data..
The more data we have, the better we can learn the effect of this astro cycle on the market. In the example above, there is enough price history data (131 full cycles) to work with Mercury astro cycle.
Let's consider another example. We have downloaded 20 years of price history data and would like to work with Jupiter cycle:
One Jupiter cycle is almost 12 years. According to the rule, the minimum amount of price history needed is 3x12 = 36 years. This means that 20 years of price history data is not enough to make any conclusion regarding this cycle (the downloaded data file covers only 1.68 of Jupiter's full cycle). Any result from this analysis is very uncertain and should be used with extra caution.
Composite Box
The program is able to make a projection line based on different amount of astronomical cycles. It is recommended to start with the Annual cycle and then add other cycles as needed for the analysis. To create a projection line based on several different astro cycles, click the button "+":
The cycle in question goes to "Composite Box". Repeat this procedure for another cycle. This is the way to add as many cycles as needed and obtain the projection line based on the superposition of several astronomical cycles.
Consider the example below:
The blue line represents a composite cycle based on heliocentric positions of three planets: Mercury, Venus and Mars.
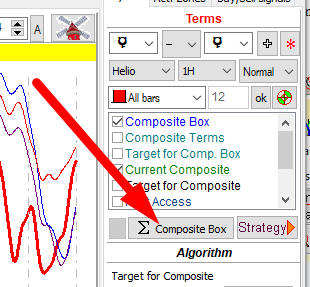
The color and thickness of Composite Box projection lines can be modified. If there are too many lines shown, it is possible to hide any of them. Please do that as described in the image below:
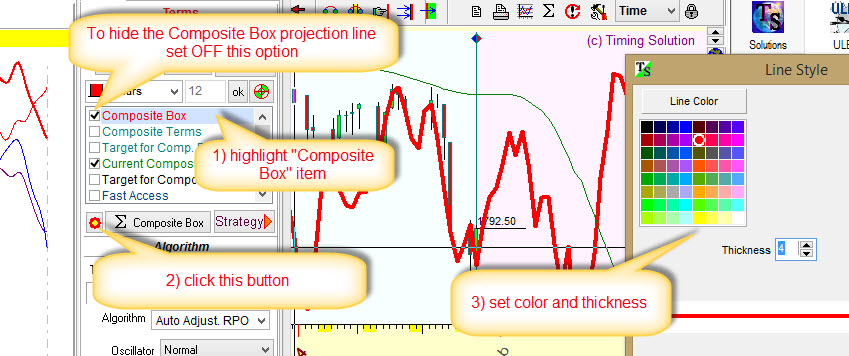
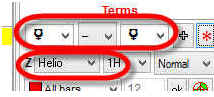
To show all cycles in Composite Box, set option "Composite Terms" to ON.
You cab minimize or close Composite Box module and open it anytime clicking this button:
Triplicity (3H harmonic), Cardinality (4H harmonic) etc...
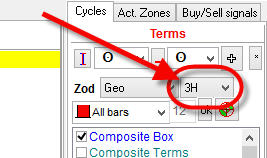
Astronomy module allows you to analyze a lot more events, not just planetary positions or angle separations between the planets. Let's consider this idea: What is going on with the price when the Sun moves through Fire signs of Zodiac ( Aries, Leo, Sagittarius), or Earth signs of Zodiac (Taurus, Virgo, Capricorn), or Air signs (Gemini, Libra, Aquarius) or Water signs (Cancer, Scorpio, Pisces)? These blocks of Zodiac signs form a triplicity (a set of three signs). To calculate the corresponding cycle, set the harmonic parameter in this window to 3:
The composite diagram similar to this one appears on the screen:
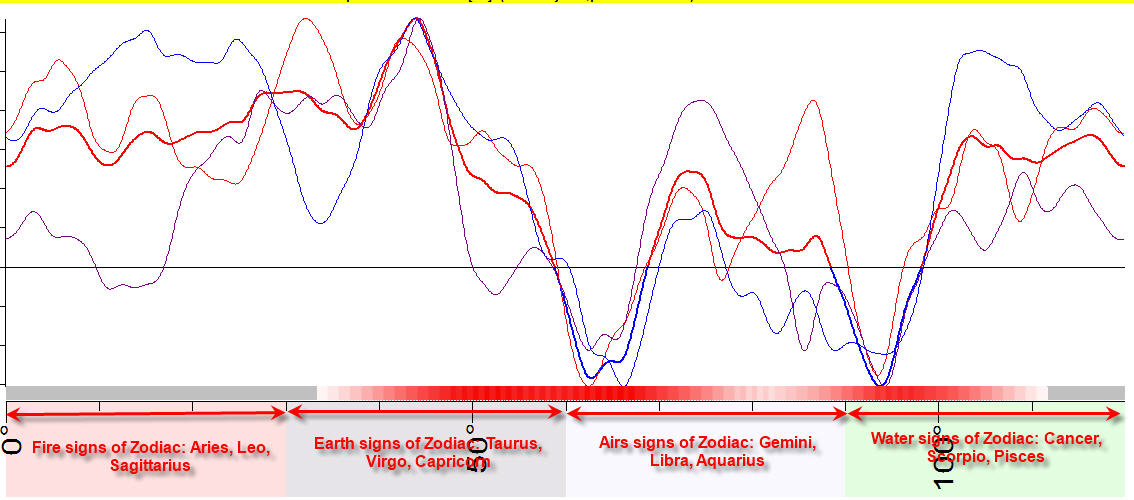
The angle scale here covers 120-degree sector. First 30 degrees correspond to Fire signs of Zodiac, 30-60 degree sector - Earth signs of Zodiac, 60-90 is for Air signs of Zodiac, and 90-120 is for Water signs of Zodiac.
It is possible to look at parts of this diagram in more detail. The diagram below shows that the price moves down when the Sun passes the sector 15-30 degrees of Earth signs of Zodiac, i.e. Taurus, Virgo, Capricorn (here we take the beginning of the Earth sector as zero, so the area of downward price movement is 15 - 30 degrees while the whole Earth sector covers 30 - 60 degrees of the previous diagram):
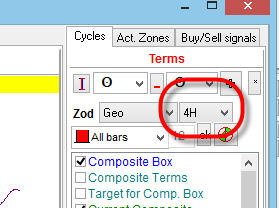
The same method is used to analyze cardinality effect. "Cardinality" is a part of another set of Zodiac signs based on qualities; there are Cardinal (Aries, Cancer, Libra and Capricorn), Fixed (Taurus, Leo, Scorpio and Aquarius) and Mutable (Gemini, Virgo, Sagittarius and Pisces) signs. For that, set the harmonic parameter to 4:
A diagram like the one below appears on the screen:
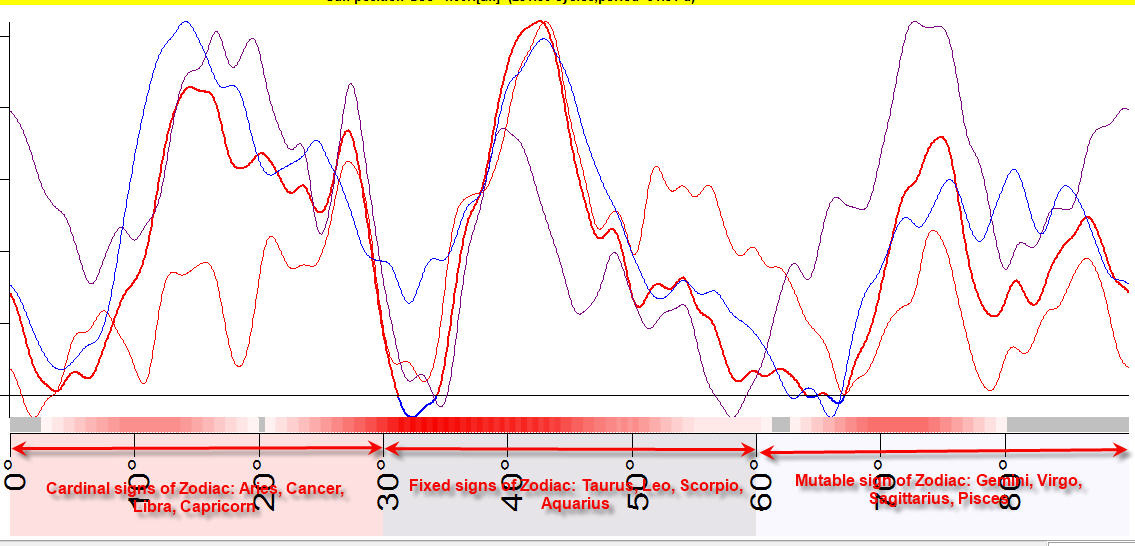
Stock Market memory (Dominant astro cycles)
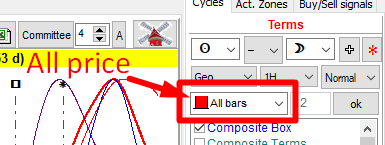
Sometimes it is possible to improve the forecast ability of astro cycles by using only part of price history data instead of all of it. The major parameter here is Stock Market memory (SM). By default, Timing Solution uses all available price history to analyze astro cycles:
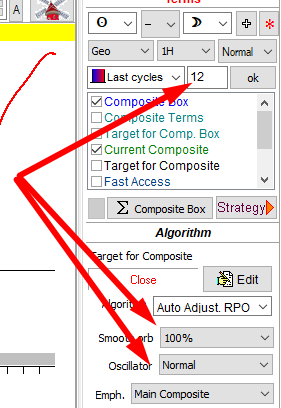
To set a certain value of SM for this cycle, choose "Last Cycles" option and select number of cycles to be used. As an example, we set SM=10 for the Annual Cycle below:
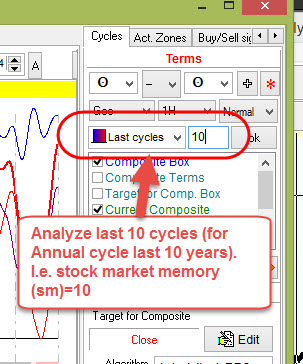
This means that only the last 10 years of price history are used to calculate this cycle, and the price history beyond those 10 years is not considered. This is useful if we assume that Annual (or any other cycle) works the same way/keeps the same pattern within 10 full cycles and after that the pattern may change. You can read more about stock memory (SM) here.
It is recommended to set stock memory to 5, 10, 20 and 50 (50 is for fast cycles, like Moon based cycles).
Smoothing a projection line
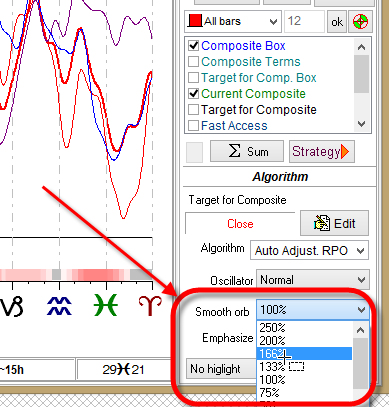
Sometimes a composite diagram and a projection line are too choppy, like in this picture below:
To make the projection line smoother, increase "Smoothing orb" parameter here:
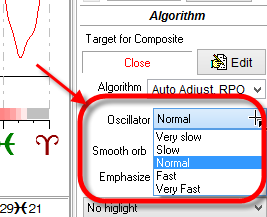
or select "Slow" or "Very slow" oscillator here:
Target
There is a problem with any cyclical analysis used on market data: it cannot work with the price itself. The dollar value is not the same now as it was in earlier years. For example, S&P500 index varies between $16 - $2700 from 1950 to 2018. To conduct any research with the use of statistics, we should make this price chart "flat". In other words we need to get rid of the trend first and then do the research. Therefore, our first step is to obtain an oscillator from a price chart with a trend. An oscillator shows true movement of the price. We may assume that its behavior is the same now and in 1950 , and it changes due to some reason that is present now and has been there in the past. This is very important for cyclical analysis. Another recommendation is to use fast oscillators for cycles based on the movement of fast planets while for slow planets' cycles use slow oscillators. The fast cycle reflects fast movements, and the slow cycle is for slow movements. Timing Solution automatically calculates a proper oscillator for the analyzed cycle. This oscillator is different for different planets, and its period is shown here:
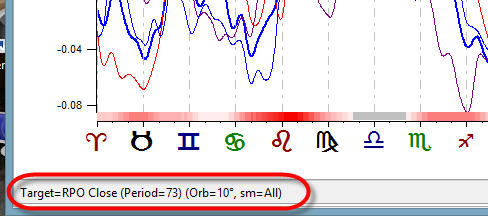
As an example, for Sun cycles, the program uses the oscillator with 73-day period to catch Annual oscillations, while for the Moon cycle it is usually the oscillator with 10-day period to reveal monthly cycles.
Some data sets do not need to handle the trend. It is already done by a data provider. As an example, consider VIX index:
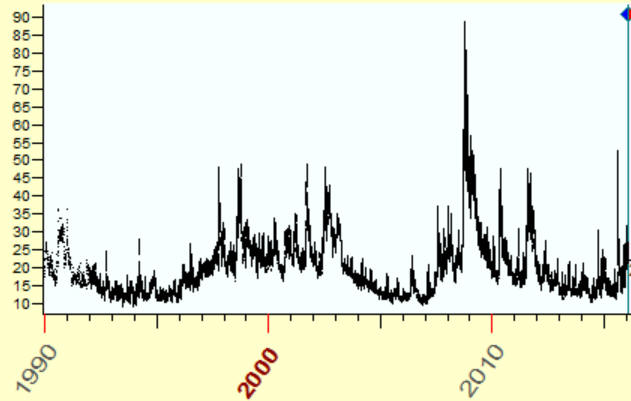
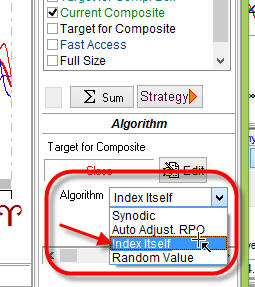
There is no trend here. It means that there is no need to create any oscillator, so we can use VIX index itself when calculating the composite. In order to do that, set "Algorithm" option to "Index itself":
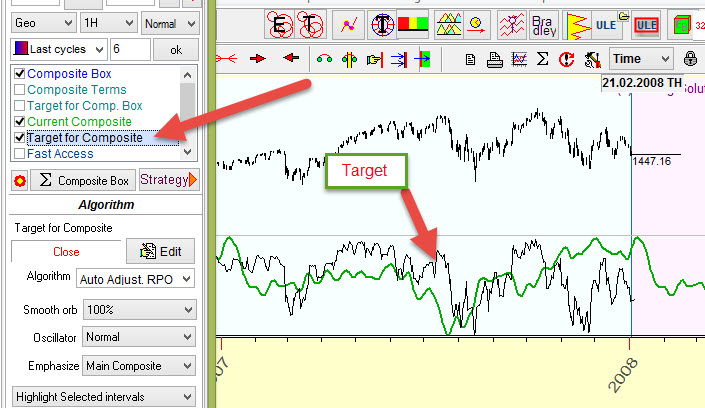
To display the target, check the "Target for Composite" option; and it will be displayed together with the projection line:
Another example is making a forecast for MACD (12,26,9) index. There is no trend here either, and we can work with this index directly. In order to do that, click "Edit" button in "Target for composite" modules, set there MACD(12,26,9) index and choose "Index Itself":
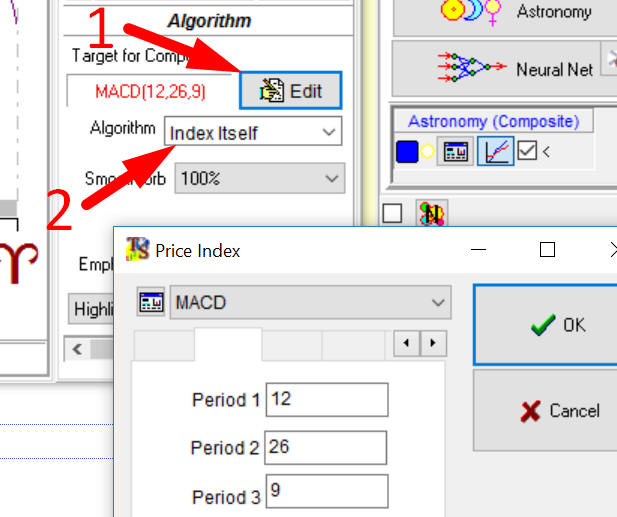
In this case the program uses MACD (12,26,9) index as the Target, and the projection line generated by the composite will forecast MACD (12,26,9).
How to pick up the most important astro cycles
How do you tell which cycles are important and which are not? This is not an easy question; it took a lot of time and effort for Timing Solution team to find an answer to it. In brief, this is what we faced with:
It is not a good idea to apply the methods of classical statistics (like Bartels significance test), because classical statistics is not focused on forecasting (and trading); it is more concentrated on revealing the existence of some cycle. Usually, the classical approach gives something like this: "with a probability X%, the cycle with the period Y persists in a data set". Classical statistical analysis does not answer a question if this cycle can be used for forecasting or not. To get the answer regarding a forecast ability of some cycle, it is better to apply Walk Forward Analysis (WFA). But classical WFA deals with technical analysis indicators, not with the projection line. For that purpose a special technology has been developed that combines classical statistics (which is more suitable for cyclical analysis) and WFA (which is a standard in financial analysis); it allows to get the information regarding the forecast ability of the analyzed projection line.
To pick up the most important astro cycles, two tests are recommended: forecast ability and walk forward analysis. The first test, forecast ability, gives a general view of the analyzed cycle; walk forward analysis provides a detailed analysis on how this cycle works interval by interval. It means that walk forward analysis is more picky, very often we simply do not have enough price history to follow strict statistical criteria.
Both these tests are helpful in picking up important astro cycles:
#1 forecast ability (correlation) criterion - the projection line provided by some cycle should be good enough (i.e. the correlation between the projection line and the price itself or the price oscillator should be high enough; the higher the better).
The presence of stable patterns in some astro cycle does not mean that the projection line based on this cycle will always be good. From the point of view of classical statistics, the cycle may be very significant/important. It is not so from the point of view of a trader who intends to make a decision based on that cycle. That is why we have to look for more details and analyze the projection line and watch how well this projection line fits the price. The next criterion has been developed for that reason.
#2 walk forward analysis criterion - having enough price history, we can apply walk forward analysis (WFA) for the analyzed astro cycle. It helps to find the periods when the astro cycle does or does not work. The situation is the same as with fixed cycles that we discussed in the previous lesson. Astro cycles are always there, though they may appear to be working at some times and not working at others. WFA allows to reveal the periods when the astro cycle works/does not work. The periods when the astro cycle works should be longer than the periods when it does not work.
Let us look closer at these techniques.
Understanding the correlation
Correlation is a statistical criterion, widely used in the program. It shows the existence or absence of a relationship between variables. Please read about it here.
When the correlation between the projection line and the price (or the price oscillator) reaches a certain value, it is considered being:
5% - weak,
10% - acceptable,
15% - good.
The correlation between the projection line and the price within "last cycle" means that the correlation is calculated for the period of the analyzed cycle. For example, for Annual cycle the period is one year interval, and the correlation between the projection line and the price is calculated for one year interval. For the Moon synodic cycle it is 29.5 days, i.e. the correlation shows how this cycle works for the last 29 days.
It is better to calculate the correlation as a percentage. For example, use 12.3% instead of 0.123. Experience shows that percentage is more convenient for finance data while decimals are used in classical statistics.
Criterion #1: Forecast ability (correlation) test
This test's purpose is to find out whether the projection line based on the analyzed cycle is good enough, i.e. the correlation between the projection line and the price/price oscillator is high enough.
To calculate the forecast ability of any astro cycle, click this button:
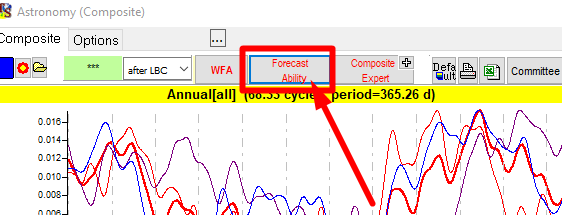
Below is an example of the forecast ability report for Annual cycle calculated for S&P 500 index (this particular data file ends in December 2013):
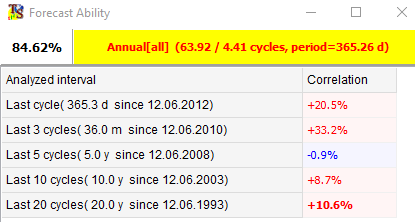
The first record means that since December 2012 till December 2013 the Annual cycle has worked quite well, the correlation is positive, and its value is 20.5%.
The second record means that for the last three years (i.e. three years prior the end of the data file) the Annual cycle also worked very well.
The third record shows a negative correlation since 2008, for the last five years prior the end of the data file there were some periods when the Annual cycle did not work.
These first three records show the recent activity of Annual cycle i.e. its activity for the last year, last three years and last five years ("recent" in this example means as if we were to do this analysis in December 2013).
The last record shows the general activity of the Annual cycle, i.e. how the Annual cycle has worked within the last 20 years. Sometimes this cycle worked, sometimes it did not (a negative correlation since 2008); positive average correlation means that this cycle works in general.
So the forecast ability criterion states that majority of these values should be positive, i.e. shown in red.
Another example is the forecast ability of the Moon cycle:
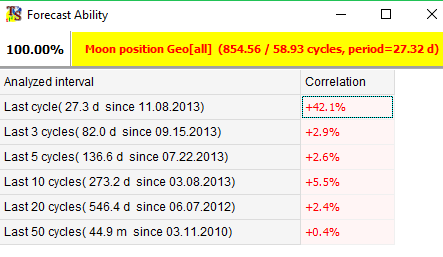
This cycle works well only within the last cycle (one month), i.e. the recent activity of this cycle is good - it provides a good projection line. However, the general activity based on the latest 50 cycles is not as good. So this cycle can stop working at any moment at any time, and the fact that it has worked very well for the last month does not matter. If we plan to use that cycle, we need to observe it for a longer period of time or apply some other technique to confirm its usefulness.
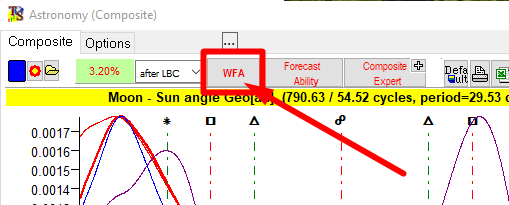
Criterion #2: Walk Forward Analysis (WFA)
The second test to find important cycles is the Walk Forward Analysis. Click on WFA button to get the detailed statistical information regarding the analyzed astro cycle:
The program will ask to define the sample size to be used for WFA:
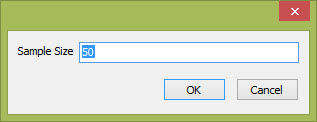
The default value to use is 50. After the calculation, the program displays the table with detailed statistical information regarding the cycle, similar to the one below:
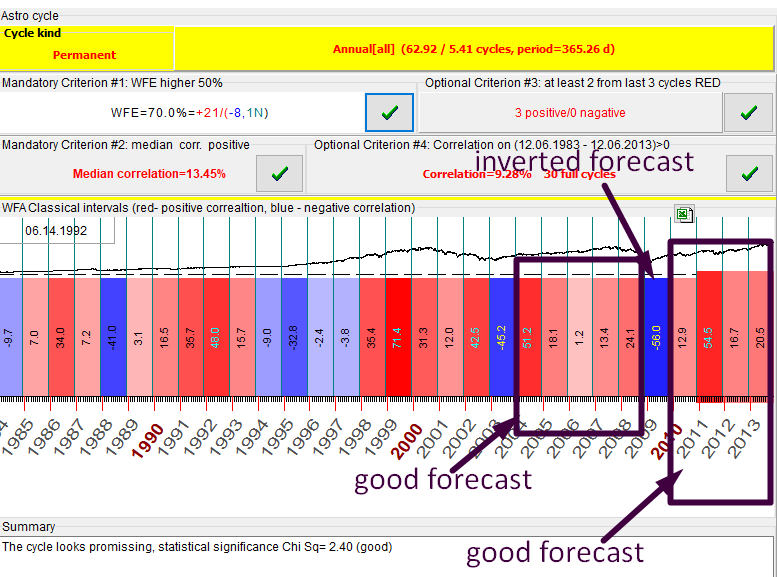
The red bars correspond to the periods when the projection line based on this cycle provides a good forecast while blue bars mean that the projection line is not reliable and may be inverted. The digits inside these bars show the correlation between the projection line and the price. Take a look at the analysis below:
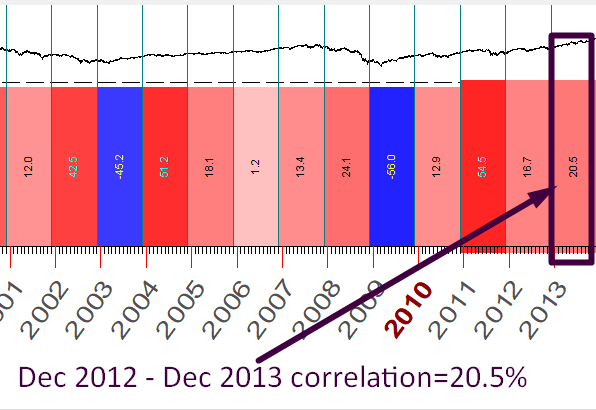
It means that in 2013 the Annual cycle has forecasted price movements with an accuracy of 20.5% in terms of correlation.
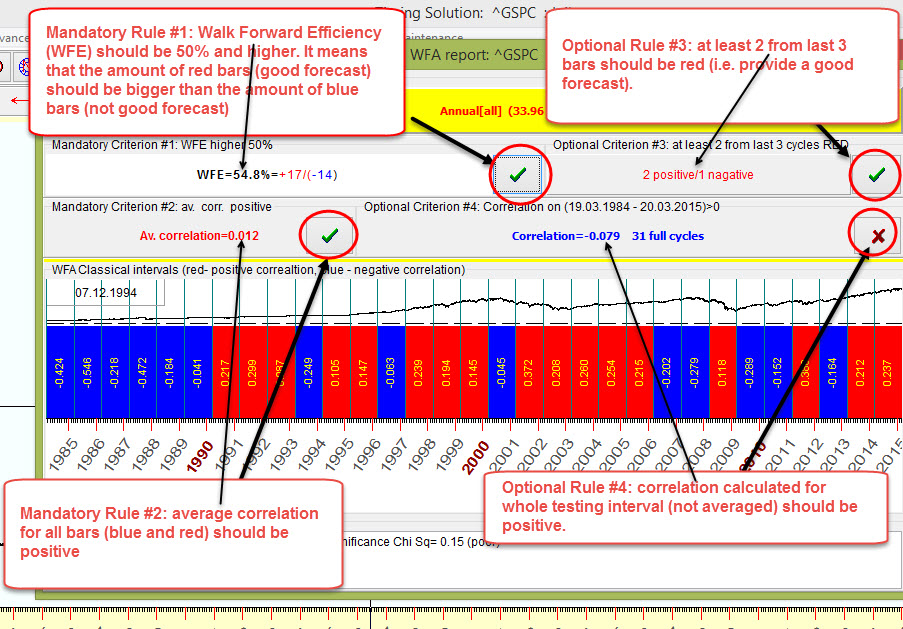
There are four rules that should be fulfilled for a good cycle, two of them are mandatory and two are optional. They are shown in the picture below:
Tuning an astro cycle
After finding an astro cycle that provides a projection line with a good correlation to the price or price oscillator, it is possible to improve that projection line. The procedure is called "tuning of the astro cycle". It is done by varying SM and smoothing parameters:
In other words, it is recommended to conduct WFA for that astro cycle again, varying these parameters. It will improve the projection line slightly, though do not expect the drastic change of the whole picture.
The Most Common Astro Cycles
The cycles shown below are the most commonly used ones, so it is recommended to start your analysis with these cycles. It is best to start with the Annual cycle, then consider three Moon based cycles. These cycles involve the Sun and the Moon, the brightest and biggest celestial bodies from Earthly point of view, and scientific research shows that these bodies affect our life on Earth. After that, it is a good idea to research the cycles based on planetary phases and the cycles based on the heliocentric movement of inferior planets (Mercury and Venus). Then other astro cycles can be researched. This is just a suggestion, there are many ways to do analysis on the market, and it is up to you how to start it. Below are notes on the most important cycles, together with the cycle's terms used:
Seasonal, Quarterly, Monthly cycles
Sun Cycle Seasonal/Annual Cycle, Period 365.25 days
The first one to consider and the most important object in the sky is the Sun. The Earth makes the full cycle around the Sun within 365.25 days; this is the seasonal or Annual cycle, a very important cycle that should be considered first.
Quarterly Cycle, Period 3 months
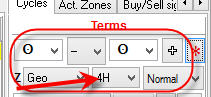
Somehow this cycle has been strong since 2010. Pay attention: to calculate quarterly period we apply 4H harmonic for Solar cycle.
Solar Month Cycle, Period One month
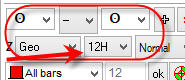
12H harmonic for Solar cycle is applied to get the Solar Month Cycle.
Moon based cycles
There are three variants of the Moon cycle that are worth looking at:
Moon Synodic Cycle (Moon Phases), Period 29.53 days
This is known as the cycle between two New Moons (or two Full Moons). It shows how the price is changed between two New Moons. Technically this cycle is calculated as an angle separation between ecliptic longitudes of the Moon and the Sun. When these objects have the same longitude (it is called conjunction), the New Moon takes place. When this angle separation reaches 180 degrees, the Full Moon takes place.
Moon Tropical Cycle, Period 27.32 days
This is the cycle that reflects the Moon movement through Ecliptic.
Moon Draconic Cycle, Period 27.21 days
This cycle reflects the Moon movement regarding the Moon North Node (which is the intersection of Ecliptic and the Moon's orbit). This cycle correlates with eclipses. You can find out more regarding this subject here:
Because the moon's orbit is inclined with respect to the ecliptic, the sun, moon, and earth are in line only when the moon is at one of the nodes. Whenever this happens a solar or lunar eclipse is possible. The name "draconic" refers to a mythical dragon, said to live in the nodes and eat the sun or moon during an eclipse.[1]
Planetary phases
Inner planets (Mercury and Venus) have phases similar to the Moon phases. These cycles are also called synodic cycles; so, when you read "Mercury Phases Cycle", it is the same thing as Mercury Synodic Cycle.
As an example, consider Venus synodic cycle. Technically speaking, this is a cycle between two inferior conjunctions (heliocentric system). Look at this picture from Cornell University's website (link is here):
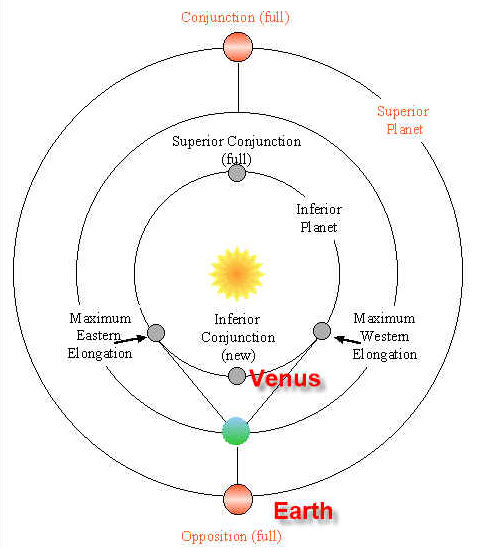
Inferior conjunction here is like the New Moon - New Venus. Superior conjunction is like the Full Moon - Full Venus (maximum illuminated by the Sun).
We at Timing Solution believe that Venus synodic cycle is quite important for the stock market forecasting, especially for currencies:
Venus Phase Cycle, Period 584 days
Remember that Venus phases are angles between Venus and the Earth in heliocentric system, and to work with the heliocentric system in Timing Solution use the Sun glyph to designate the Earth.
Mercury Phases, Period 116 days
We recommend to explore this cycle as well.
Heliocentric System
Mercury Heliocentric cycle, Period 87.97 days
This cycle shows the movement of Mercury around the Sun. Mercury is the closest to the Sun planet, so the period of this cycle is the smallest - 88 days.
Venus Heliocentric Cycle, Period 224.70 days
Just like Mercury, this cycle shows the movement of Venus around the Sun. Because Venus is further from the Sun than Mercury, its orbital period is longer at about 225 days.
Jupiter Heliocentric Cycle, Period 12 years
This cycle is recommended if you have enough price history (36 years and more). It is suitable for long term forecast. This cycle is very close to Juglar economical cycle.
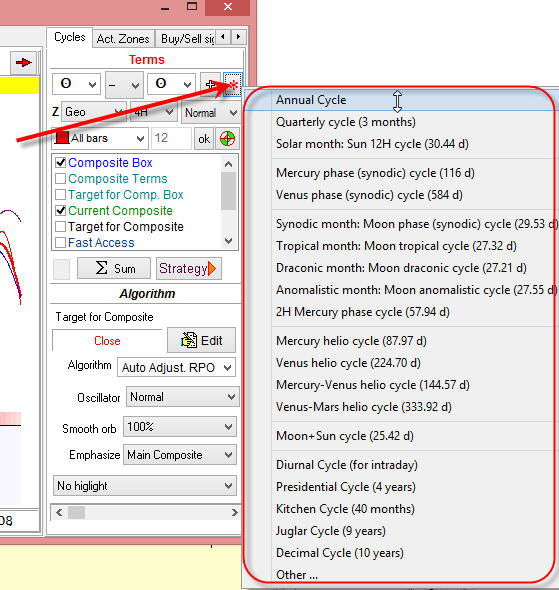
There is a way to calculate these cycles (the most important ones) quickly. Click on this button and choose the cycle you need:
Stability and Predictable Zones
The cycle or at least some part of it should be stable, i.e. it should work the same way now as it used to worked one year ago or ten years ago. It means that there are some relatively stable patterns in the price movement. Examples of a stable cycle are: the price tends to go up when the Sun goes through the Zodiac sign of Sagittarius (this pattern is known as Christmas rally) or the price tends to be higher around the New Moon, etc. The presence of these stable patterns gives some hope that this cycle may work in the same manner for some time in the future.
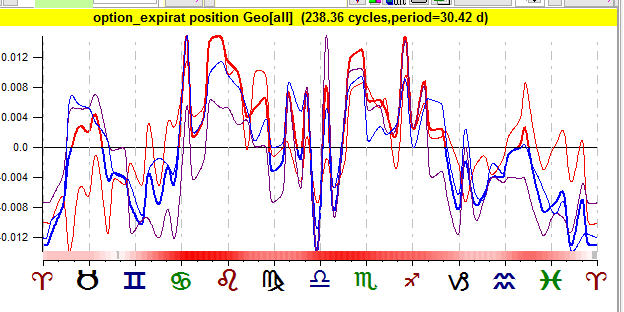
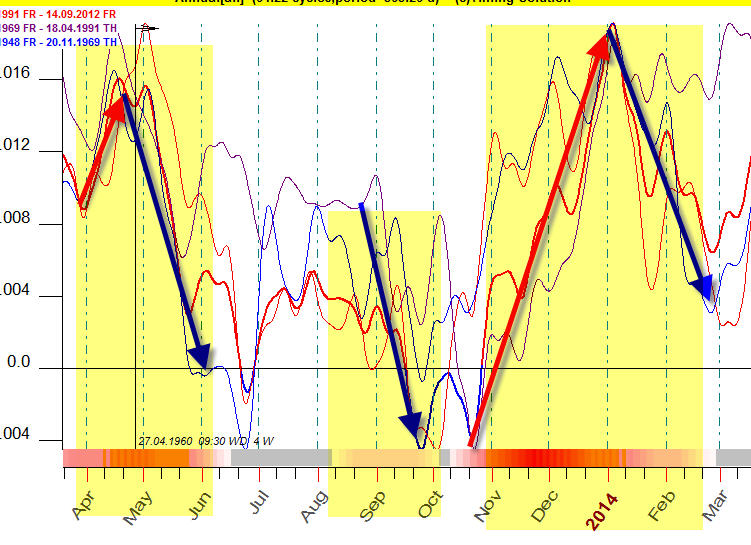
To get understanding of how stable a cycle is, divide price history on several intervals (by default it is 3) and watch how this cycle works on these intervals. Look at the composite diagram below. There is the major bold red line there that shows the summary effect and there are three different thin lines as well - red, purple and green.
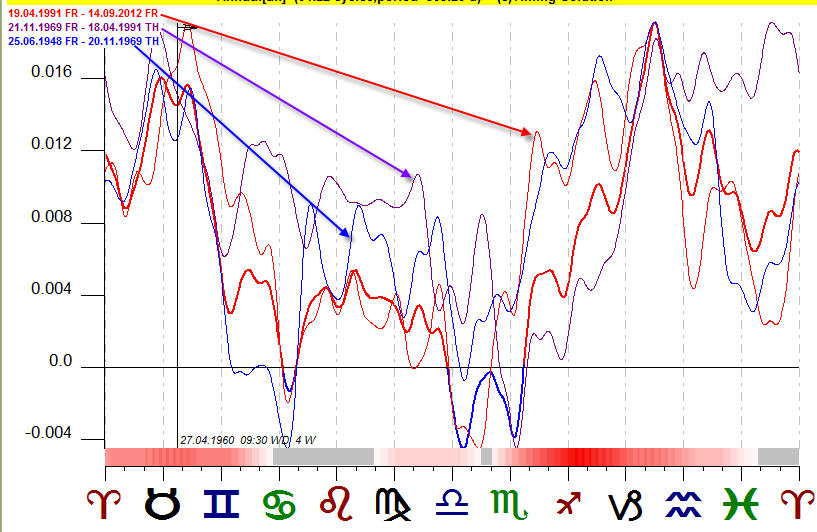
These thin lines represent the composite diagram calculated for the same financial instrument for different time intervals. In this example, red is a composite diagram calculated for a part of DJII price history data from 1991 to 2012; purple - 1969-1991 and blue - 1948-1969 years.
We look for periods where ALL THREE THIN CURVES SHOW THE SAME PRICE MOVEMENT. It means that this cycle has worked the same way in different historical periods, so we can expect that it will work in the same manner in the future.
These periods are marked by red stripes at the bottom of the composite diagram; they are called PREDICTABLE ZONES.
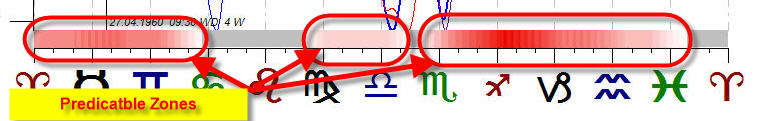
Any other area outside predictable zones cannot be used for the forecast; so, if you see that composite curves provide different signals - these are UNCERTAIN ZONES, do not use them for the forecast.
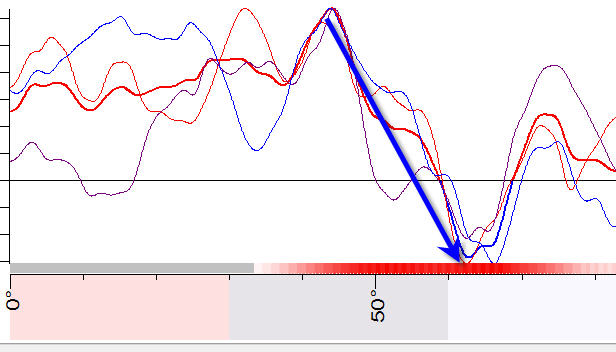
The picture below shows predictable zones for Annual cycle, and the arrows point at the most typical price movements within these predictable zones:
And this is an example of a cycle that does not work:
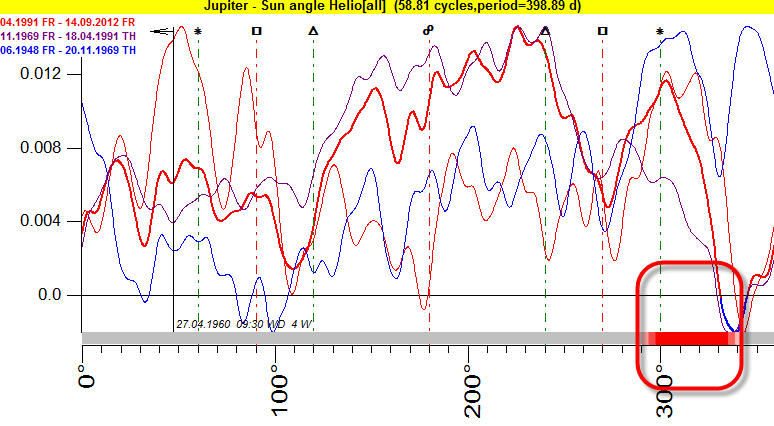
A red stripe occupies less than two signs of Zodiac. Most likely this is a random occurence, we cannot trust this cycle.
To highlight predictable zones on the projection line, choose "Highlight predictable zones" option: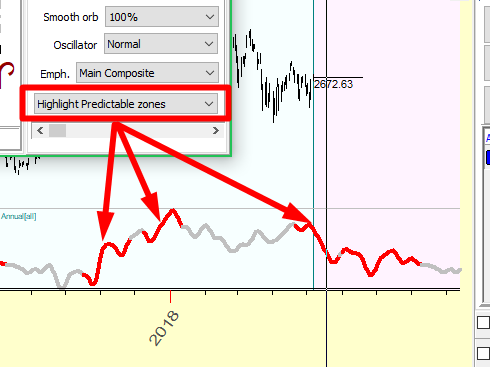
It is also possible to highlight some intervals directly on the Composite diagram. Here the interval between 0 degree of Scorpio and 15 degree of Capricorn is selected by dragging the mouse cursor over the composite chart; this area is marked by lime color:
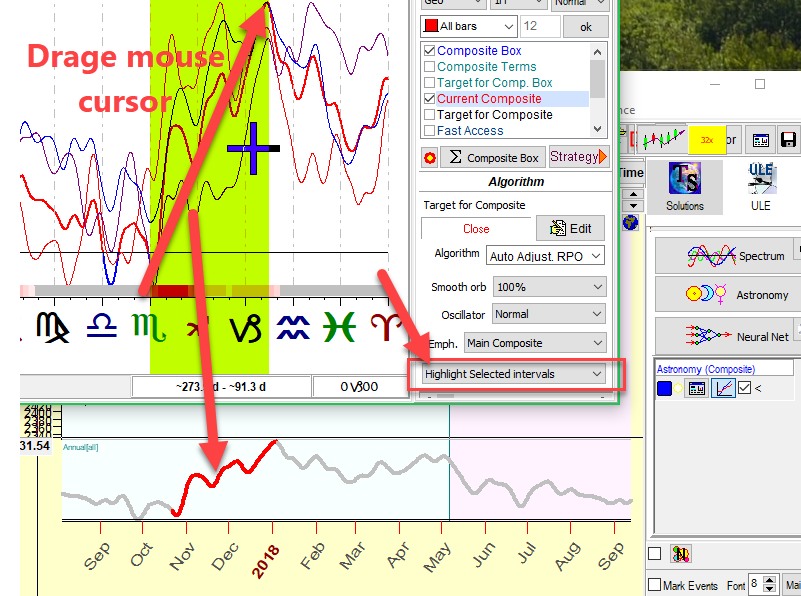
To highlight this interval on the projection lines, choose the "Highlight selected intervals" option.
This concludes the introduction to using the Astronomy Module.
Additional study re Composite module
Basic astronomical cycles for traders - it is recommended to read if you know nothing about astronomy and astronomy based cycles; a good start for these ideas
Annual cycle in epoch of Presidential election - a description of Annual cycle, the most important cycle in finance, and a variety of possibilities to create it: Annual committee, decennial cycle, Annual cycle for specific years (like leap years, years when democrats/republicans were in power, etc.)
Building Annual and Moon trading models - an explanation of Annual and Moon Q models. This approach allows to reveal predictable zones for Annual and Moon based cycles.
Composite Astro Expert module - working with dominant astro cycles - a description of an expert system that analyses many astro cycles at the same time and finds the most important ones for a certain financial instrument.