SuperSearch/ULE Examples:
Here you will find some examples of creating SuperSearch/ULE events. I have included there the questions that I have got from the users of the program.
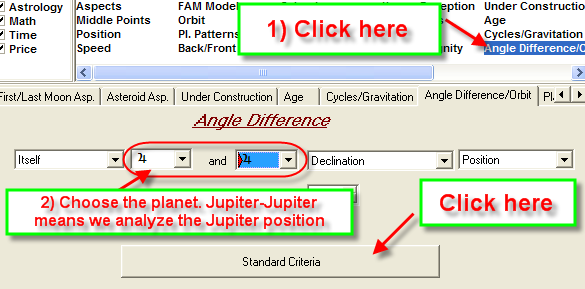
1) Planets in Perihelion, Aphelion, Perigee, Apogee:
You will get this list:
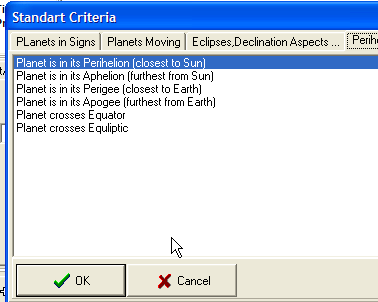
Perihelion/Aphelion - the planet is at the closest/furthest distance from the Sun (heliocentric coordinates)
Perigee/Apogee - the planet is at the closest/furthest distance from the Earth (geocentric coordinates)
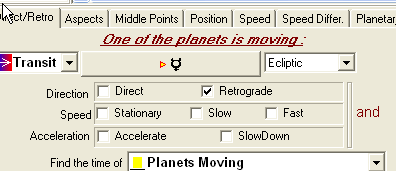
2) Jupiter reaches its Maximum (Minimum) declination:
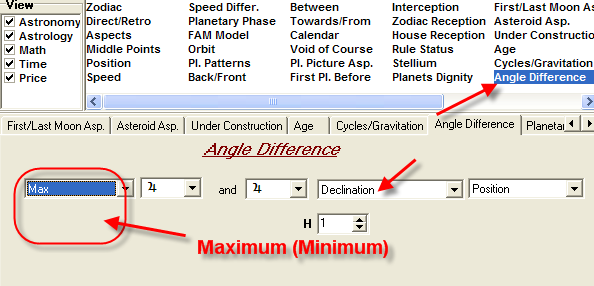
You can do this for any other planet as well.
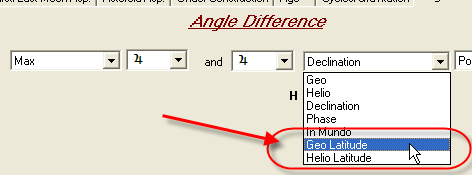
Also, you can find the planet's Maximum Geo/Helio latitude:
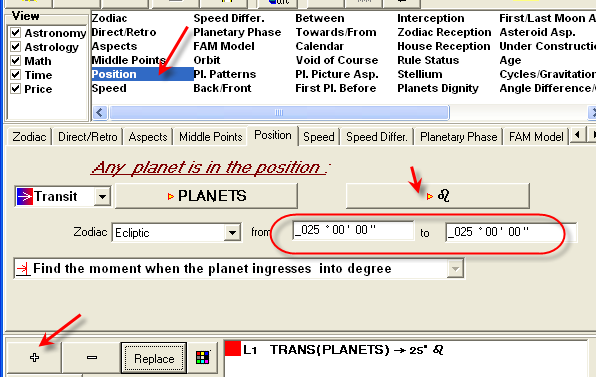
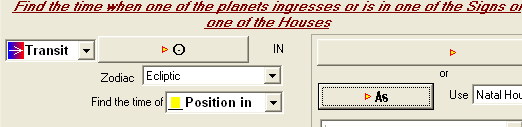
3) a) take a planet and search for specific times (to the hour say) since say 1900 to 2005 that it was at say 25 degrees Leo or 23 deg Taurus or 17 deg Sagittarius.
In other words we need to find the moments when any of planets passes 25th degree of Leo or 23rd of Taurus or 17th of Sagittarius points. Also, we would like to see when this phenomena occur in some specific time of the year - some month or season. It is easy to do with the program: you will have to create several astro events and combine them altogether.
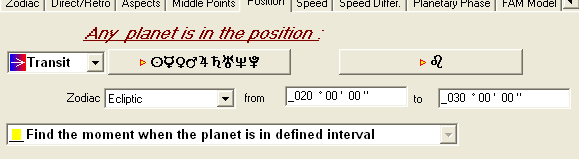
Let's define the first event L1 any planets passes 25th degree of Leo. Pay attention that from 25 to 25 means finding the exact moment when it happens. Some planet crosses this point in the sky, this is an instantaneous event as opposite for the planet being in 25th degree of Leo (which lasts for 60 seconds). It is important for further research.
Fill out this form:
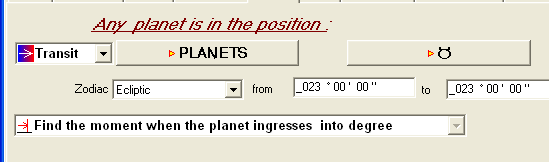
Similarly, create 2 more events.
L2 - planets pass 23rd degree of Taurus:
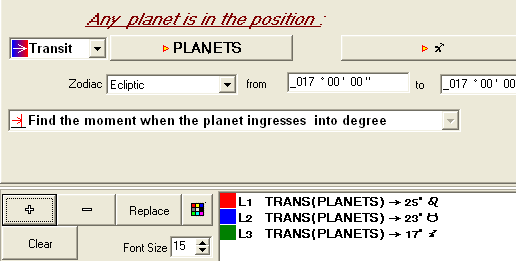
L3 - 17th degree of Sagittarius:
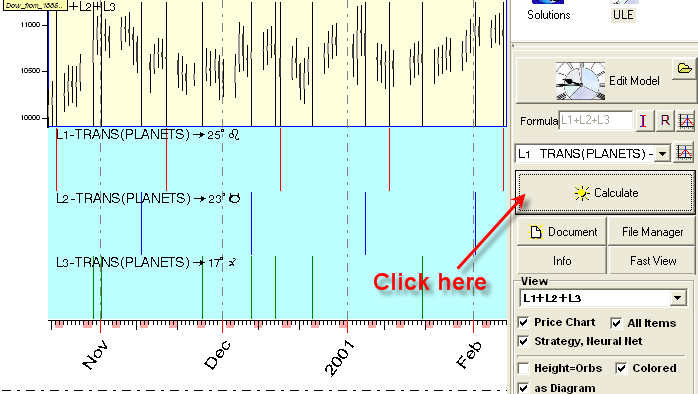
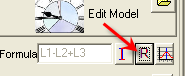
We want to find the moments when ANY of these events took place. Type in the Events Formula L1+L2+L3
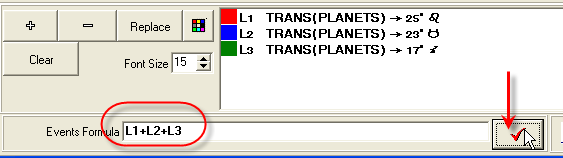
Do not forget to click: ![]() and then the Calculate button (see below).
and then the Calculate button (see below).
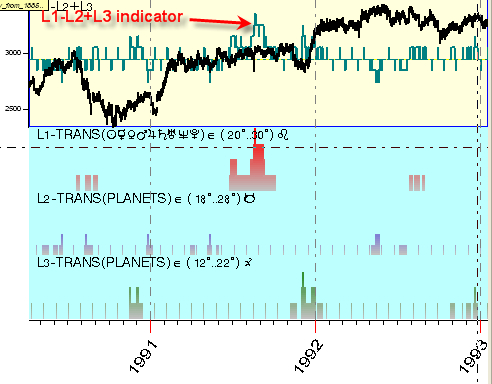
The upper screen shows these moments marked by vertical black stripes:
To get the statistics for these events, click the button as below:
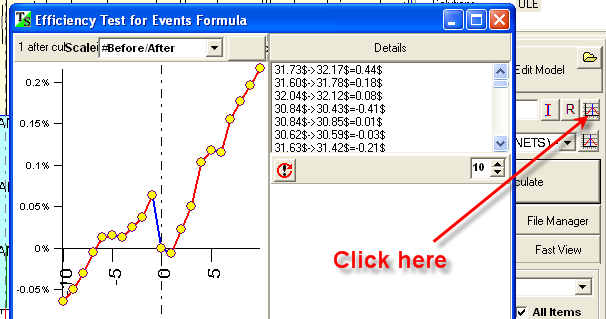
The program displays the Efficiency Test for this combination, and you can work with it in a regular way.
If you would like to research the effect of these phenomena in some specific time of the year, let us say in the month of August, you need to create one more event, L4 - now is August.
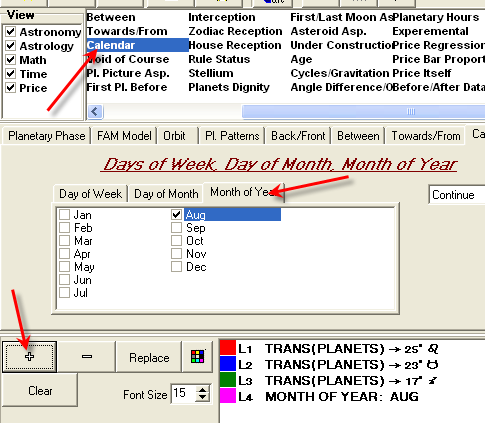
and add this event to the formula above.
The final formula should be L4*(L1+L2+L3). Multiplication means that these two events L4 (August) and L1+L2+L3 (planets passing different degrees) should happen together:

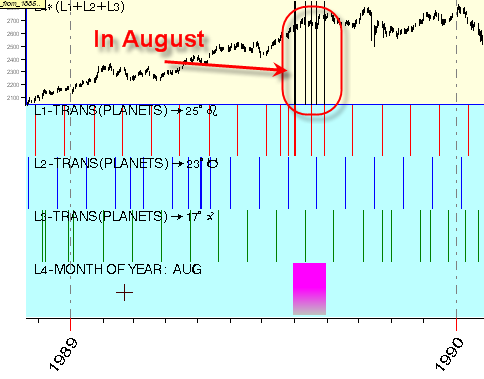
As always, do not forget to click: ![]()
Now you see the result with a possibility to do the statistical analysis of this combined event:
Varying L4, you can define different possibilities, events like "planets pass these sensitive points above while Mercury is retrograde". In this case, you should define L4 as:
Or this combination may occur when the transit Sun is in the first natal house:
and many many others.
Let's consider the more complicated case: find the moments when planets pass these sensitive points (L1+L2+L3) while the Sun is located in fifth house OR Venus is in the second house.
We need to create two additional events: L4 - the Sun in the fifth house and L5 - Venus in the second house.
The formula (L4+L5) means that we look for the moments when the Sun is in the fifth OR Venus is in the second houses.
All these events together are described by this formula: ![]()
Let's modify our model. Let define L1 (in Leo) and L3 (in Sagittarius) as "GOOD" sensitive points, while L2 (in Taurus) is a "BAD" sensitive point. When planets pass the "good" sensitive points, the price goes up, while on "bad" sensitive points it reacts by downtrend movement (we might find this or similar information in some book or newsletter).
Here I define the event "planets crossing the 25th degree of Leo" a bit differently:
Here we set 5 degrees orb for this event. The same is done for L2 and L3 events.
Now we have L1 and L3 as a good guys a and L2 - bad guy. This formula
reflects this fact: ![]()
Thus we have created the indicator based on sensitive points:
If you really decide to create a working indicator, the "Correlation" button is recommended:
You can estimate the real performance of the analyzed indicator. See here for more details.