Timing Solution Software: About the Projection Line
Timing Solution software is focused on modeling of the stock market behavior and market trends.
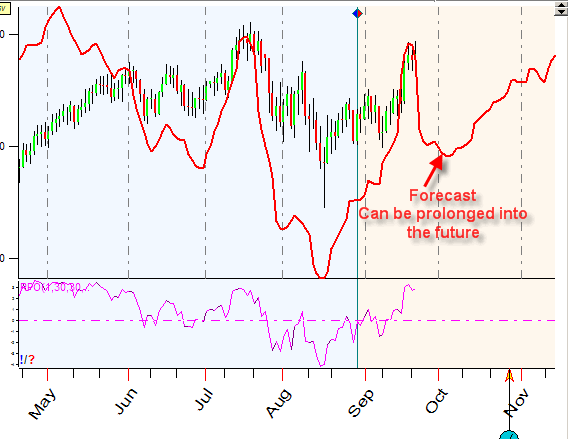
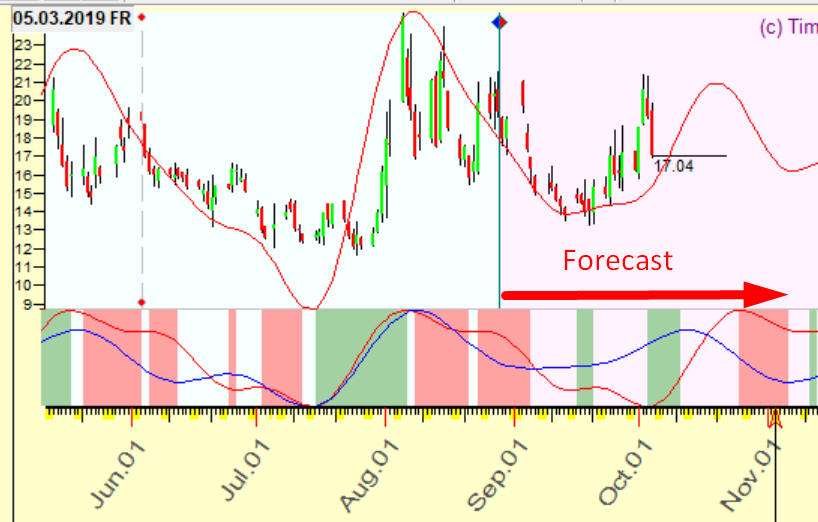
The projection line is our main product. It represents market timing forecast.
In brief, the process is:
- study of past price history data looking for patterns related to a certain market stage (upward or downward movement) or a certain market move (big ups or drops, %% increase/decrease , some price level, etc.);
- create a model based on these findings;
- test the model;
- make a projection line based on that model.
Different techniques are used to create Timing Solution models, including cyclical analysis, machine learning (Neural Networks), statistics and Walk Forward Analysis (WFA). Tools to evaluate and verify forecasts based on these models are also provided wherever possible.
Quick Solutions
If you have no time to create a financial forecast using different techniques, Timing Solution offers its own version of "Easy" Button. Just download the price data for your financial instrument, and select Solutions from the top menu.
Timing Solution will then generate a projection line based on different models (fixed cycles, astro cycles, etc).
If you prefer to create your own projection line and would like to know how they are formed, Timing Solution software provides a huge variety of tools to work with.
Models to create a projection line
Let us briefly look at forecast models that are the base of Timing Solution projection lines:
- Math cycles models
- Astronomy/Astrology based models
- Pattern recognition models
Math cycles models
The idea that the stock marked is ruled by underlying cycles is the most exciting idea of stock market analysis. Popular examples are economical cycles, such as 39-41 months Kitchen inventory cycle, 9-11 years Juglar financial cycle, and Kondratieff cycle. These cycles are used by economists and market analysts. For you the most interesting question is: can cyclical approach be applied for trading and are there other cycles rather than these long-term economical ones?
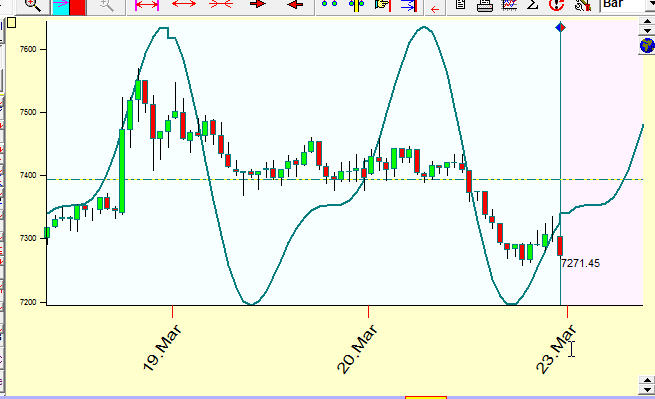
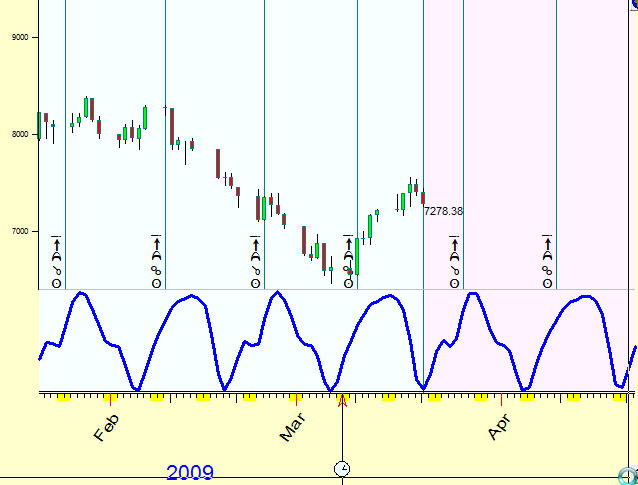
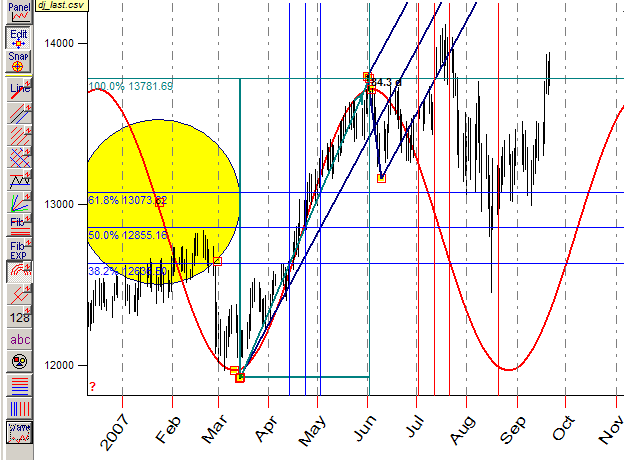
You have seen "traces" of cycles in different price charts. This is an example of a 55-day cycle (for intraday chart):
If a trader can find such cycles, they can be prolonged into the future giving the trader a certain advantage.
The first type of cycles to be considered is Fourier transform - cycles revealed by old-school analysis. Many software packages do that, but there is a problem - cycles found by this type of analysis are good in describing the past (it is nothing more than curve-fitting) and are not as good at being applied for trading. Timing Solution team has developed a very special technology that combines classical harmonic analysis (Fourier transform, developed almost two hundred years ago) and methods of financial analysis (Walk Forward Analysis).
Such combination works well: the classical approach reveals cycles in a price chart, and the financial approach allows to select only cycles that proved being suitable for trading. Both these steps are important as financial data should be treated in a different way than data of any physical process. The difference is due to direct human involvement in the process of trading as opposed to laws of nature that are major players in physical processes.
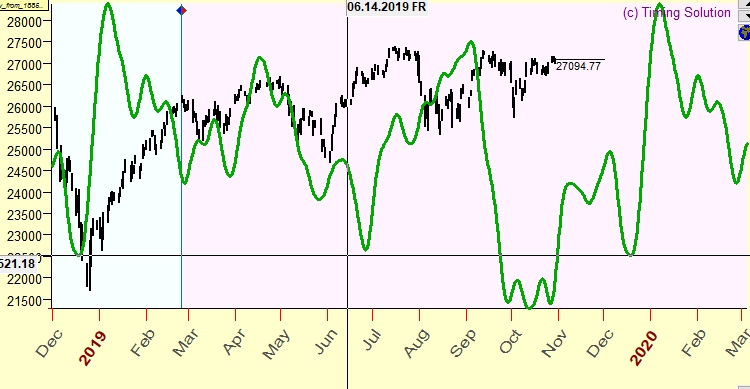
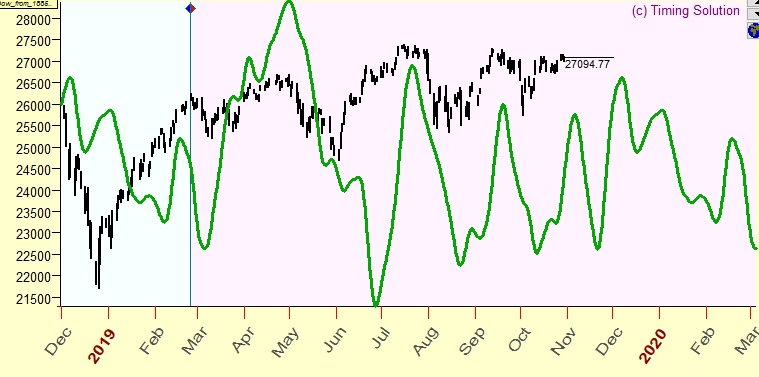
In practice it looks like this: Timing Solution finds cycles in a certain data set, creates a model based on these cycles, checks the model's accuracy on separate data and gives a forecast suitable for trading decisions. For example, below is a cyclical "portrait" of VIX index; the forecast was made by Q-Spectrum module at the end of August, 2019:
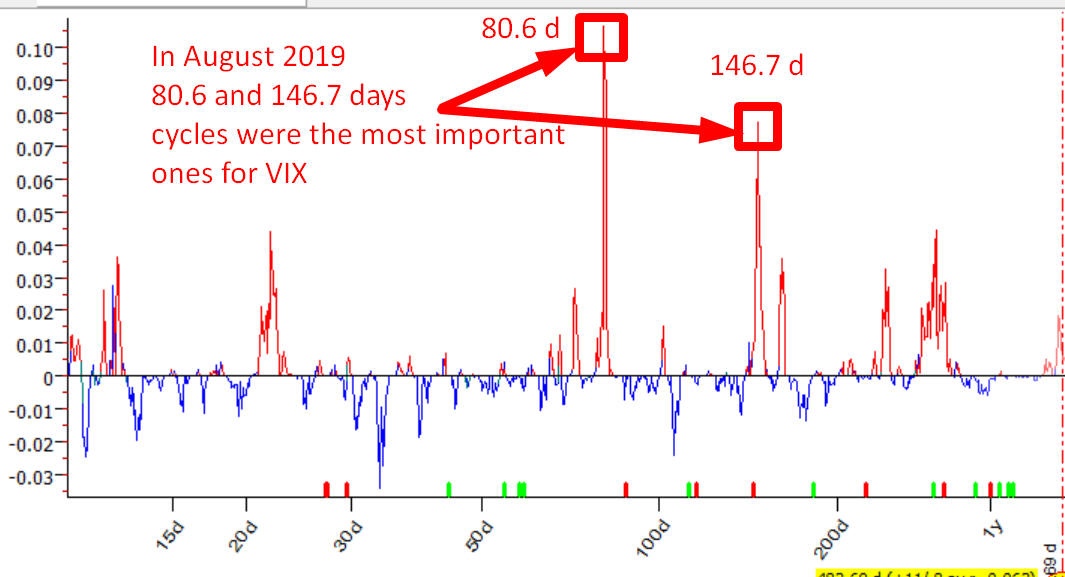
Highest peaks correspond to 80.6 and 146.7 day cycles. These two cycles form a model to get a projection line based on these cycles:
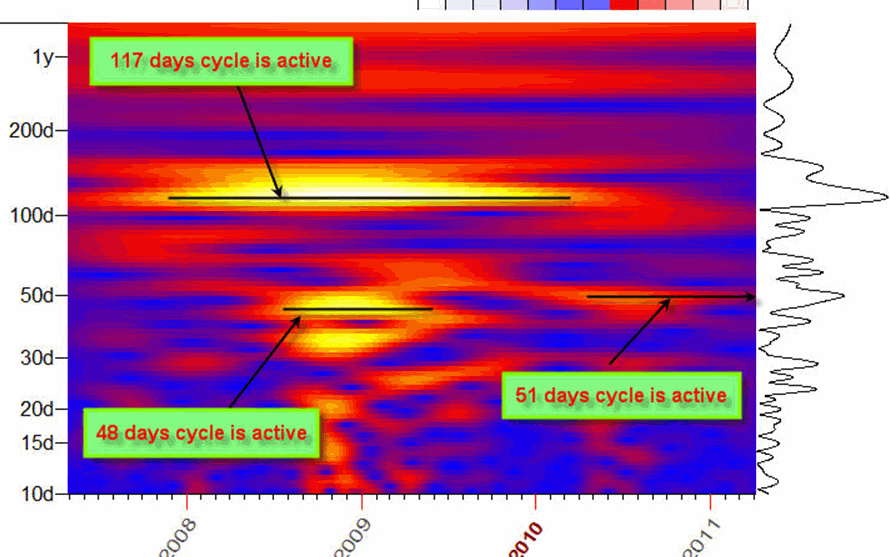
Timing Solution software offers one more way to work with classical cyclical routines. Wavelet Analysis shows how a cycle starts, grows and ends. The colored diagram below shows a life of a cycle; brighter areas are where a cycle is stronger:
Astronomy/Astrology based models
Cycles revealed by Fourier transform are not the only ones that can be used for trading. We should not ignore the ancient knowledge of the Sun, the Moon and planetary cycles. These astrocycles can be applied to stock market forecasting as well. Ability to work with these cycles is a very significant part of Timing Solution. There is no doubt about importance of these cycles, neither in old times nor today. Modern mathematical approach brings a new breath, new possibilities, and new ideas to this ancient knowledge. The most precious feature of astro based cycles is that there is no need to find them - they just exist and are there all the time. They are like special clocks, and it is possible to find correlations between certain market moves (like tendency to go up or down) and certain astro cycles.
Below is an Annual/Seasonal cycle applied to Dow Jones Industrial Index. In the first case, ALL of available DJI price history was used for analysis:
When calculated that way, Annual cycle does not always follow the index's moves. This is expected as economical drivers a hundred years ago were different than they are today. For example, September drop pattern was more certain in older times than it is now.
That same Annual cycle, for the same DJI, could be calculated using only the last 12 years of price historically. It looks better (follows market moves better):
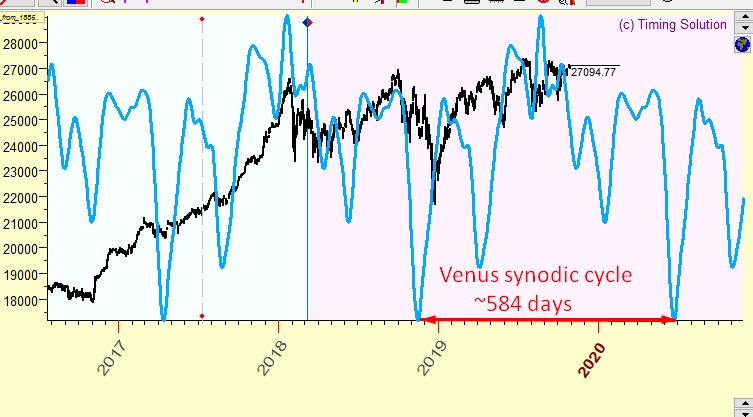
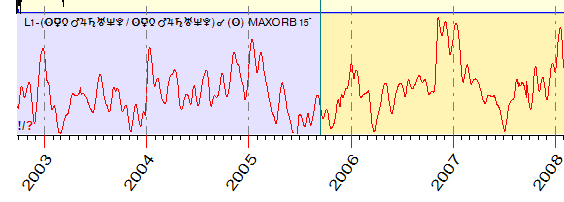
The two examples above were related to the Sun. Similar analysis can be done to other planets. Here is an example of a projection line based on Venus synodic cycle; it allows to catch longer trends as the period of this cycle is 584 days:
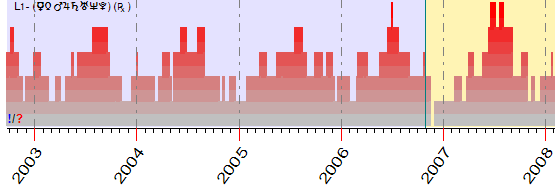
Or you may want to look at a short term cycle - Moon Phases cycle. The diagram shows that Dow is high around the New Moon and it is low several days before the Full Moon (as a rule):
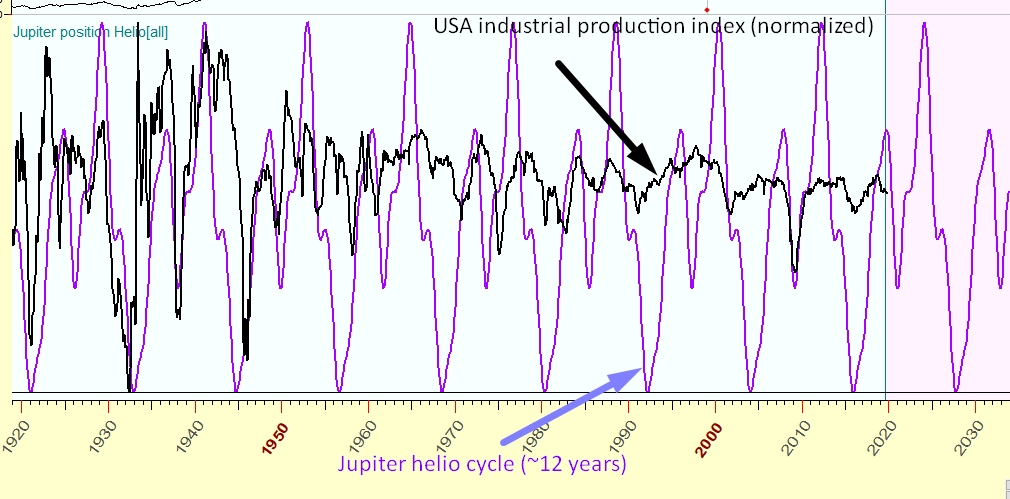
Or you may want to apply to your market research with Jupiter 12-year cycle (it is close to the famous Juglar cycle). This is how it worked for USA production index during the last 100 years.
These examples represent only a small part of what is available in Timing Solution. The software is able to calculate the projection line based practically on any astro phenomena: planetary positions in houses, planetary dignities (details here), waxing/waning aspects between the planets (details here) or planetary speed (details here).
All of these and much more can be done with Timing Solution software!
Pattern recognition models
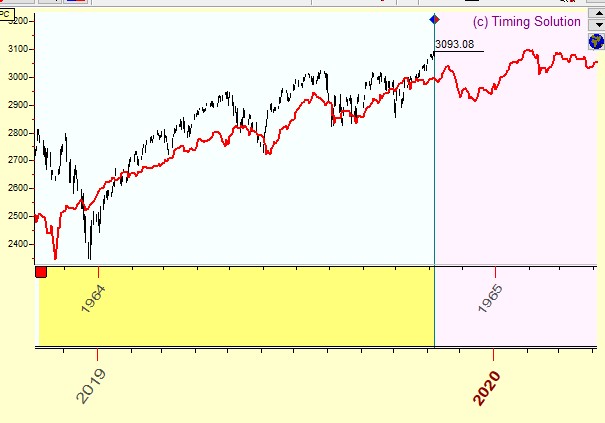
There is a popular idea that market moves repeat themselves from time to time and, if similar patterns are found inside a data set, we can apply these repeating patterns to forecast future market moves. For example: the current SNP500 chart (as of November 2019) is similar to the price chart in 1964-1965 (the red line):
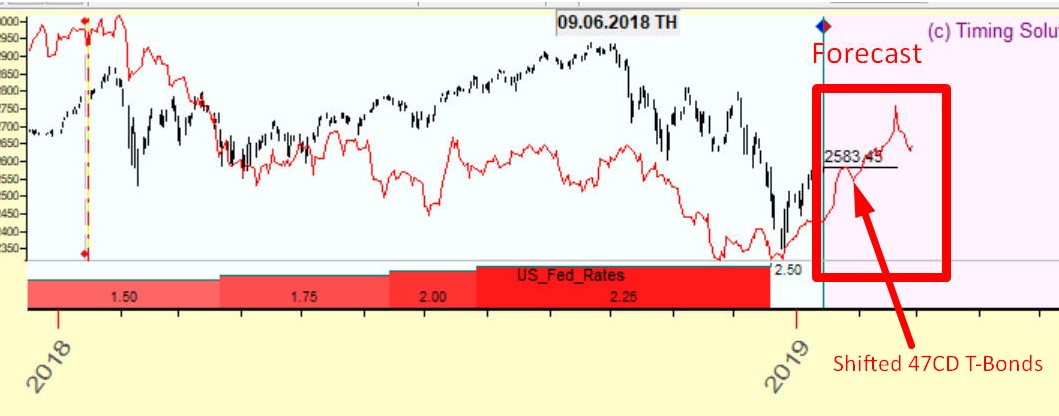
Also what is going on in one market may appear later in another market. This is the idea behind Intermarket Analysis module. Models provided by this module allow to find leading indicators in the pairs of different markets (like T-Bonds is a leading indicator for SNP500 chart (with the lag of 47 trading days). The diagram shows
that: the red line here represents 47 trading days shifted T-Bonds chart:
Timing Solution team created a special procedure to find the best leading indicator for different financial instruments and it can be used for forecasting.
Timing Solution Pattern Recognition software is described here.
Examples of Projection Lines
Traditional Astrology techniques
With these you can perform more detailed astro analysis.
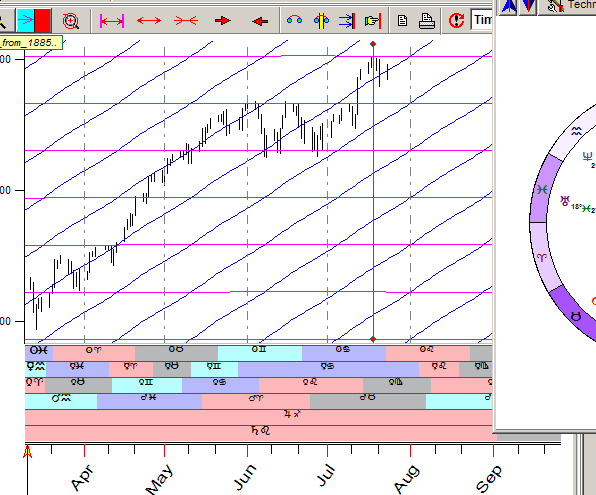
The program is able to show the stock market data together with planetary positions in Zodiac:
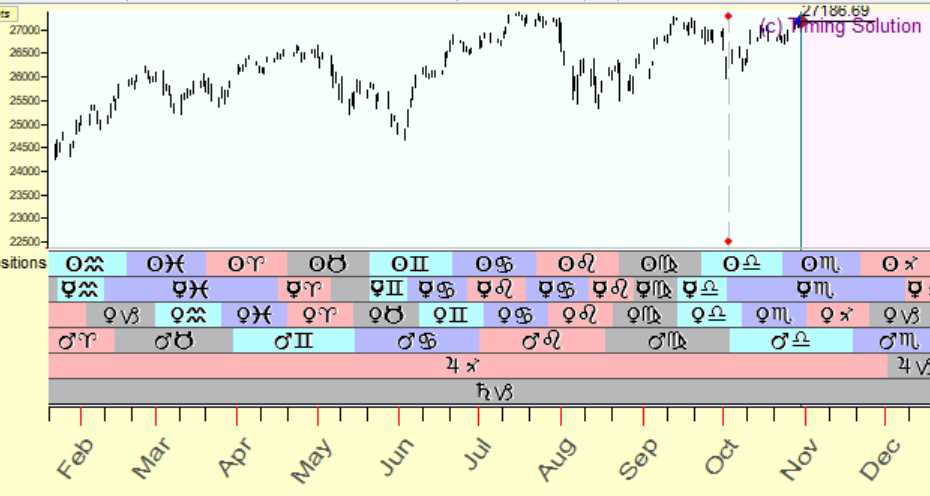
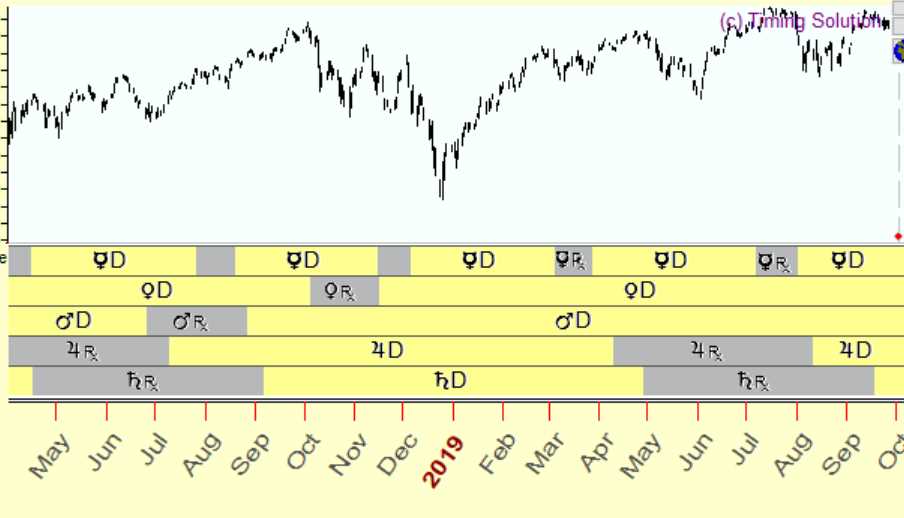
or in regards to periods when planets are direct/retrograde:
You may try to explore stock market moves in regards to planetary positions in terms, faces, duads, the Moon (or any other planet) phases, and many other phenomena.
Along with visual analysis (as in the examples above), you can conduct statistical analysis to get an idea what astro events were at play when a market had a certain move (5% increase, big ups or downs, 10% decline, etc.) Statistically significant events may give you a hint what might occur in the market when this event happens again. This is the best part of using astrology techniques: astrological events can be calculated beforehand.
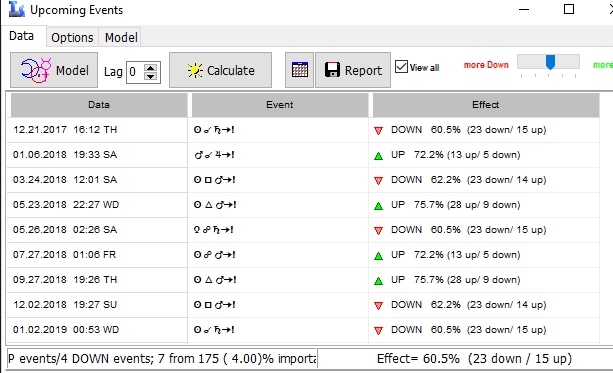
"Upcoming Events" module performs statistical analysis for hundreds of astrological phenomena giving you a hint how they may affect your market in the future:
The Easy Expert module analyzes thousands of events and displays the summary effect of all analyzed phenomena as shown below:
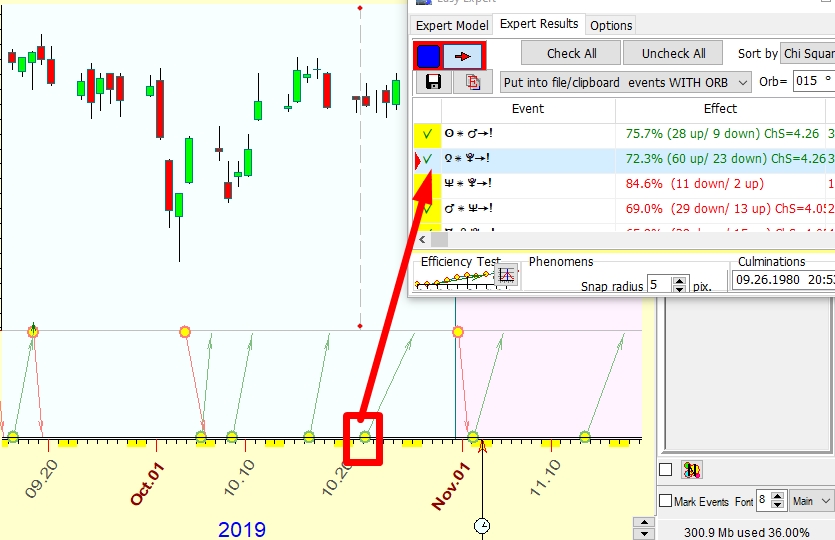
Green and red arrows represent up and down events. Each arrow corresponds to some aspect between planets, allowing you to see how any of these aspects have worked in the past. The highlighted arrow in the example above corresponds to Venus making a 60-degrees aspect to Pluto. As you can see, historically DJI went up around this aspect 60 times versus 23 times down. Statistical significance of this aspect (chi square) is 4.26 or in terms of probability 90%.
Gann based techniques
You can calculate different planetary lines:
Timing Solution software includes a Planetary Lines Optimizer module. It analyzes thousands of planetary lines and finds the best fit to your price chart. An example is shown below:
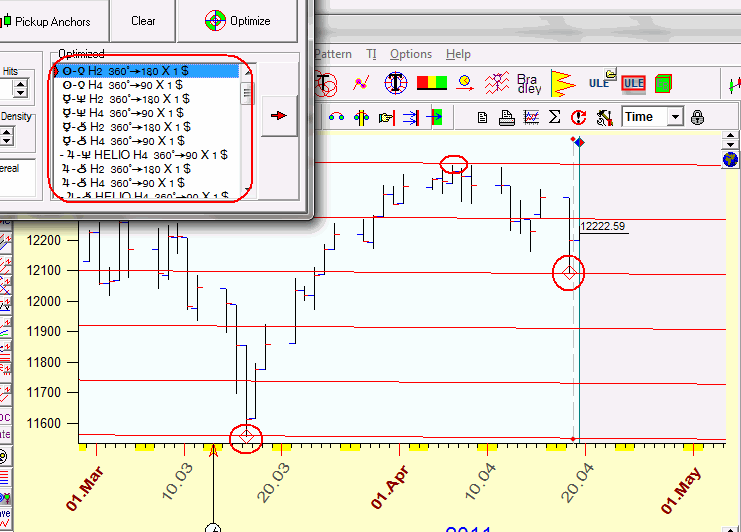
The program analyzes over 42000 of different planetary lines; only a dozen of them fit the price chart above. It is practically impossible to do that manually.
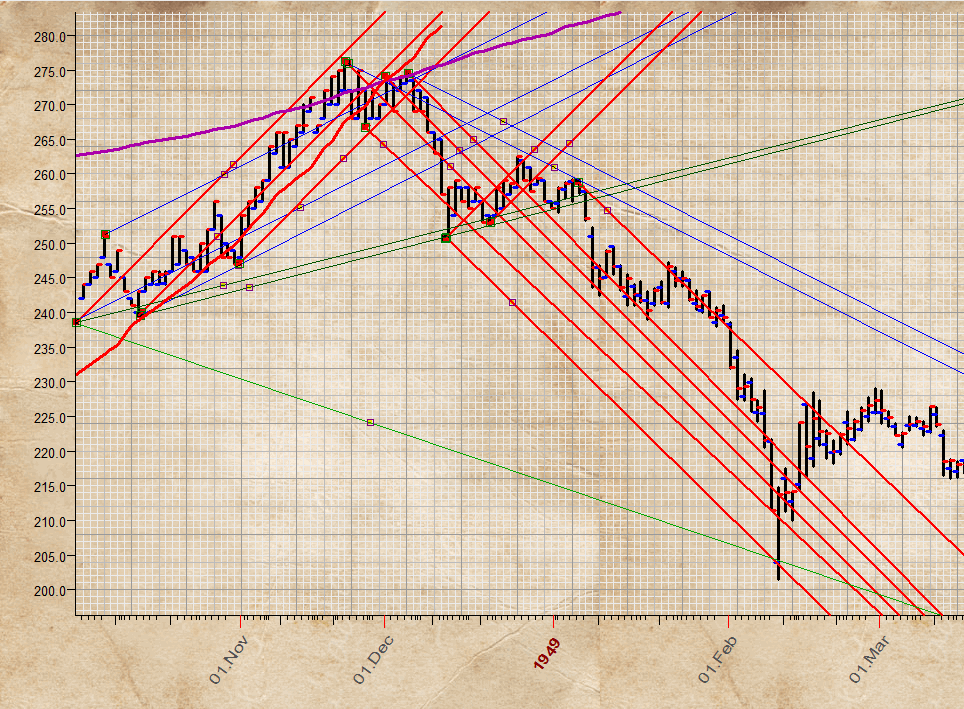
Precise Charting module allows to do charting as it has been done at Gann's time, so-called paper style charting. This is a famous Gann's soybeans chart made with Precise Charting module:
Universal Language of Events (ULE)
With this feature, you are able to create more advanced models analyzing everything that occurs in time and researching the effect of these phenomena on the stock market. Here are some examples:
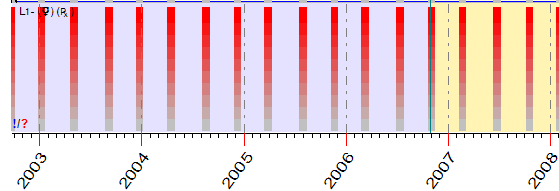
The periods when Mercury has been retrograde:
The "retrograde indicator" shows how many planets are retrograde at any given moment and compare it to your chart. The higher the shaded red area, the more planets are retrograde at that moment:
Or you may create a customized "astro indicator" (like the one below) that shows how the transiting Sun conjuncts the midpoints between transiting planets. The higher the diagram, the more midpoints are hit by the transiting Sun:
Other examples of ULE events include "Venus Gravitation Force":
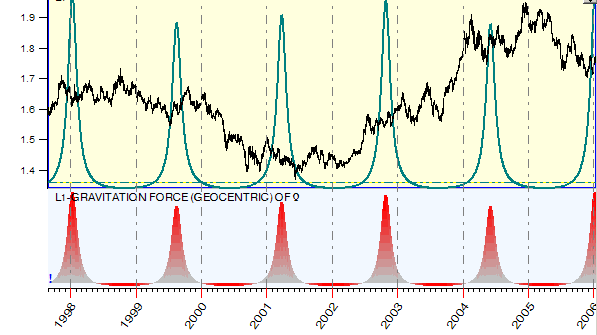
The Tidal Force:
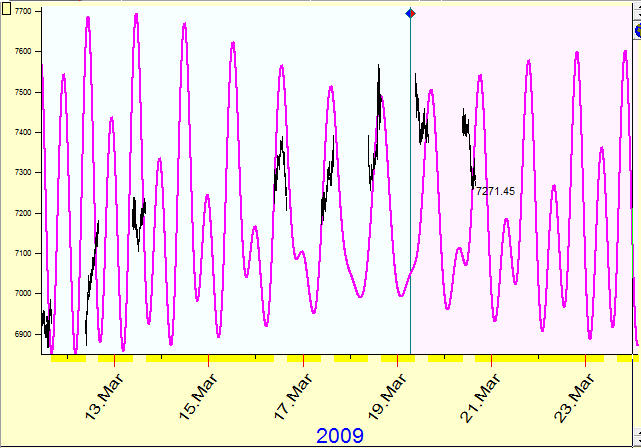
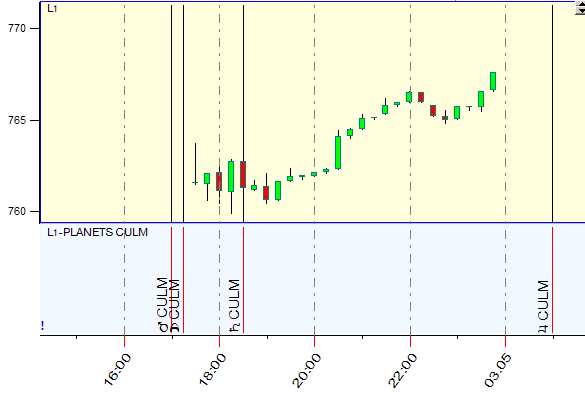
Moments when planets culminate (this event may be applied for intraday data):
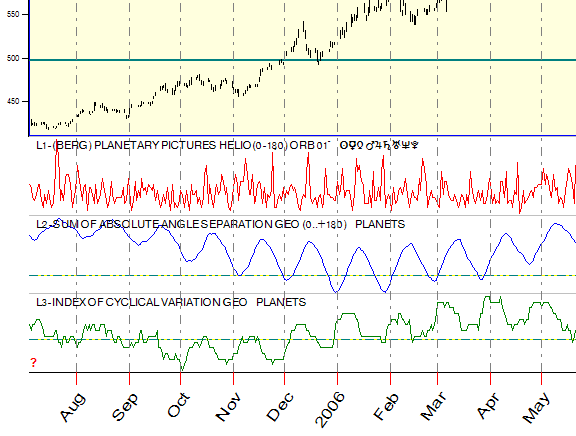
Other Astro Indicators like Ganue, Barbot, Berg, Index of Cyclical variations:
All these sample models can be applied later for analysis of any financial instrument of your choice. If the correlation is found, you can make a future projection of the model for that financial instrument.
Any phenomenon can be calculated and estimated in regards to its effect on the stock market. And you can easily do that with Timing Solution. For example, somebody says that the conjunction of the Sun and Saturn affects Dow Jones Index in some specific way. Instead of guessing if that is true, you can check this information in a moment by running the Efficiency Test module for this aspect as shown below:
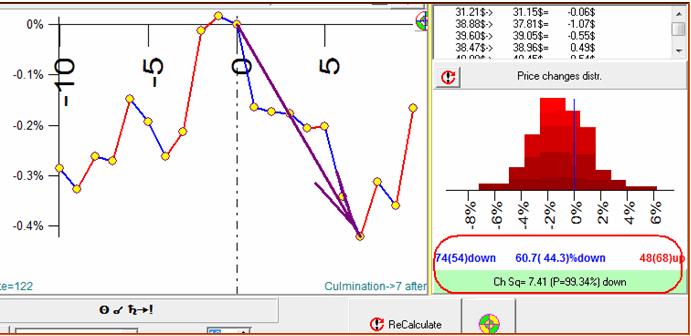
In this example, it shows that a week after this aspect culminates, the price tends to go down: 74 times down versus 48 times up (the control group shows 54 down versus 68 up, Chi square=7.4, probability=99.3%)
Learn more about ULE (Universal Language of Events) module here.
Other Charting and Forecasting Tools
Along with the modules described above, Timing Solution offers a large selection of other tools for market analysis and forecasting.
Turning Point Analyzer module allows to forecast support/resistance levels; it is based on statistical research results.
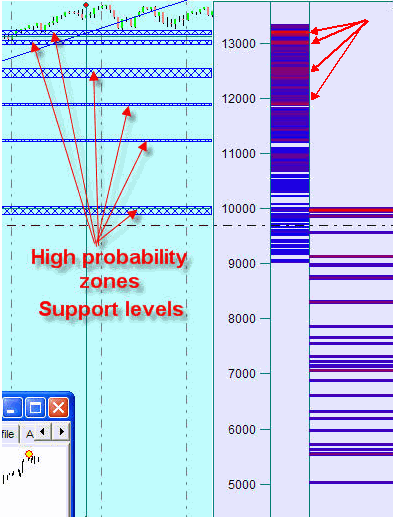
Here the program analyses all turning points, conducts their statistical analysis and displays the most probable support/resistance levels. The red stripes in the right corner correspond to the most probable support levels. This module is very popular among Timing Solution users. Learn more about TPA here.
Charting Tools like Fibonacci levels, Pitchforks, Gann Angles and many others are available here:
Planetary Time Charting Tool allows to calculate another type of cycles: the distance between these vertical lines is calculated as an angle separation between two planets (Sun-Mars 15 degrees separation in this example):
More information about this module is here.
Software Packages
The versions of Timing Solution software are listed below:
- TS Primo: this version is designed to learn the basics of creating a projection line. You will be able to work wtih basic Math Cycles, Astro Cycles and Charting Tools. This version is a good start; it can be later upgraded to the next version, TS Advanced;
- TS Advanced: this version covers practically all the popular techniques used to create a projection line and the Neural Networks;
- Terra Incognita Experimental Modules are only available to TS Advanced users. It is a subscription based service that provides access to experimental modules of Timing Solution. Terra Incognita is where Timing Solution research and development takes place. It allows you to create a forecast (projection lines) using techniques that are not accessible otherwise. Terra Incognita modules are constantly being tested and perfected and new modules are constantly added.
- TS Mobile: This is an online service that allows you to work with multiple stocks at once and perform the very basic analysis. Use two of the most popular analysis techniques to do your own analysis, or rely on our TS Experts to do some of the analysis for you.
Some modules included in TS Advanced and Terra Incognita project are available as add-ons to TS standard versions. Please contact TS Support team for more information.
You can find what is included in each version of Timing Solution here.
It is highly recommended to try Timing Solution Demo version before buying the software. The information regarding the Demo version is here.
________________
We are aware that the projection lines produced by Timing Solution software are not perfect. There is nothing surprising in it as the task of predicting the stock market's behavior is one of the most complicated. The good news is that every year reveals some new knowledge that improves Timing Solution models and their forecasting ability. At least, we have created a system that ideally follows our knowledge of financial markets. We believe that it will help you too.